CPD
9, 4035–4063, 2013Deglacial Intermediate Water
reorganization
S. Romahn et al.
Title Page
Abstract Introduction
Conclusions References
Tables Figures
◭ ◮
◭ ◮
Back Close
Full Screen / Esc
Printer-friendly Version Interactive Discussion
Discussion
P
a
per
|
D
iscussion
P
a
per
|
Discussion
P
a
per
|
Discuss
ion
P
a
per
Clim. Past Discuss., 9, 4035–4063, 2013 www.clim-past-discuss.net/9/4035/2013/ doi:10.5194/cpd-9-4035-2013
© Author(s) 2013. CC Attribution 3.0 License.
Open Access
Climate of the Past
Discussions
Geoscientiic Geoscientiic
Geoscientiic Geoscientiic
This discussion paper is/has been under review for the journal Climate of the Past (CP). Please refer to the corresponding final paper in CP if available.
Deglacial intermediate water
reorganization: new evidence
from the Indian Ocean
S. Romahn1, A. Mackensen1, J. Groeneveld2, and J. Pätzold2 1
Alfred-Wegener-Institut Helmholtz-Zentrum für Polar- und Meeresforschung, Am Alten Hafen 26, 27568 Bremerhaven, Germany
2
MARUM-Center for Marine Environmental Sciences, Bremen University, Leobener Straße, 28359 Bremen, Germany
Received: 7 June 2013 – Accepted: 4 July 2013 – Published: 17 July 2013
Correspondence to: S. Romahn (sarah.romahn@awi.de)
CPD
9, 4035–4063, 2013Deglacial Intermediate Water
reorganization
S. Romahn et al.
Title Page
Abstract Introduction
Conclusions References
Tables Figures
◭ ◮
◭ ◮
Back Close
Full Screen / Esc
Printer-friendly Version Interactive Discussion
Discussion
P
a
per
|
D
iscussion
P
a
per
|
Discussion
P
a
per
|
Discuss
ion
P
a
per
|
Abstract
The importance of intermediate water masses in climate change and ocean circulation has been emphasized recently. In particular, Antarctic Intermediate Water (AAIW) is thought to have acted as an active interhemispheric transmitter of climate anomalies. Here we reconstruct changes in AAIW signature and spatial and temporal evolution
5
based on a 40 kyr time series of oxygen and carbon isotopes as well as planktic Mg/Ca based thermometry from a site in the western Indian Ocean. Our data suggest that AAIW transmitted Antarctic temperature trends to the equatorial Indian Ocean via the “oceanic tunnel” mechanism. Moreover, our results reveal that deglacial AAIW carried a signature of aged Southern Ocean deep water. We find no evidence of increased
10
formation of intermediate waters during the deglaciation.
1 Introduction
Despite growing evidence that intermediate water masses originating from the South-ern Hemisphere are an important component of the global thermohaline circulation, there is disagreement about the variability of chemical properties and the spatial
dimen-15
sion of these watermasses through time. Especially the architecture of the Southern Ocean’s intermediate level during the last Termination is a matter of current debate. For example, an enhanced formation of AAIW during Heinrich event 1 (H1) and the Younger Dryas (YD) has been recorded in the Atlantic (Pahnke et al., 2008), in the Pacific (Pahnke and Zahn, 2005) and in the Indian Ocean (Jung et al., 2009).
20
AAIW is also thought to transmit climate anomalies from the Southern Ocean to the tropics, via the so-called “oceanic tunnel” (Liu and Yang, 2003; Ninnemann et al., 2006; Pena et al., 2013). This term describes the flow of southern-sourced waters via an intermediate pathway to the low latitude thermocline, where this extratropical water is supposed to regulate tropical sea surface temperature (SST). The growing number
25
of high-resolution SST records from shallow depths of tropical oceans, showing an
CPD
9, 4035–4063, 2013Deglacial Intermediate Water
reorganization
S. Romahn et al.
Title Page
Abstract Introduction
Conclusions References
Tables Figures
◭ ◮
◭ ◮
Back Close
Full Screen / Esc
Printer-friendly Version Interactive Discussion
Discussion
P
a
per
|
D
iscussion
P
a
per
|
Discussion
P
a
per
|
Discuss
ion
P
a
per
Antarctic-type SST pattern for the last deglaciation (Kiefer et al., 2006; Naidu and Govil, 2010; Visser et al., 2003; Weldeab et al., 2006), supports this idea and indicates that AAIW is elemental for interhemispheric forcing of climate variability.
In this context, the hypothesis that the deglacial atmospheric CO2increase and∆14C
decline is explained by the release of carbon from an isolated deepwater carbon pool
5
(Broecker, 1982), gained new attention. This idea has been corroborated recently since anomalous radiocarbon-depleted waters were identified in the Pacific (Marchitto et al., 2007; Sikes et al., 2000; Stott et al., 2009), the Atlantic (Keigwin, 2004; Robinson et al., 2005; Thornalley et al., 2011) and the Indian Ocean (Bryan et al., 2010). These old wa-ters were all detected in thermocline to shallow intermediate depth and interpreted as
10
pulses of preformed AAIW, and therewith locating the aged deep water reservoir in the Southern Ocean. Spero and Lea (2002) presented a superordinate hypothesis that in-terprets globally distributed carbon isotope minimum events (CIME, Ziegler et al., 2013) at glacial terminations as the result of increased upwelling of aged deep water in the Southern Ocean, once Antarctica began to warm and sea ice melted back. Accordingly,
15
supersaturated deep waters emit CO2, which results in rising CO2concentrations and
decreasingδ13C signature of the atmosphere, while the low δ13C of these upwelled
waters propagate northwards in AAIW and Subantarctic Mode Water (SAMW). The
AAIW/SAMW δ13C minimum, Antarctic temperature rise and atmospheric CO2 rise
coincide, because all these effects arise from the same process (Spero and Lea, 2002;
20
Stephens and Keeling, 2000).
High-resolution sediment records from the tropical intermediate ocean are still rare, but they are essential to answer the questions of how the geographical and vertical extent of AAIW changed since the Last Glacial Maximum (LGM), and how AAIW in-fluenced the physical properties of the tropical and subtropical oceans in both
hemi-25
CPD
9, 4035–4063, 2013Deglacial Intermediate Water
reorganization
S. Romahn et al.
Title Page
Abstract Introduction
Conclusions References
Tables Figures
◭ ◮
◭ ◮
Back Close
Full Screen / Esc
Printer-friendly Version Interactive Discussion
Discussion
P
a
per
|
D
iscussion
P
a
per
|
Discussion
P
a
per
|
Discuss
ion
P
a
per
|
participate in the current discussion on the importance of AAIW/SAMW as part of the global overturning circulation.
2 Oceanographic framework
The study site GeoB12615-4 is located offTanzania, East Africa (Fig. 1). It receives
sur-face water predominantly from the westward flowing South Equatorial Current (SEC),
5
to a large part supplied by the Indonesian Throughflow (Schott et al., 2009). Whereas SAMW from the southeast Indian Ocean is the source for thermocline waters, there are several sources that contribute to the intermediate waters of the Indian Ocean (Fine et al., 2008). Although You (1998) estimated the water along the western boundary at
5◦N to be a mixture of 20 % AAIW, 70 % Red Sea Water, and 10 % Indonesian
through-10
flow, Fine et al. (2008) found AAIW, entering the Indian Ocean from the southwest, to be the most significant ventilation source of the intermediate Indian Ocean, including the Arabian Sea. Both AAIW and SAMW are supposed to be open-ocean upwelled at
5–10◦S due to Ekman divergence at the northern edge of the South Equatorial Counter
Current (Schott and McCreary, 2001).
15
The formation of both AAIW and SAMW in the modern ocean is associated to the
Subantarctic Front (SAF) at 45◦to 55◦S (Hartin et al., 2011; McCartney, 1977; Sloyan
and Rintoul, 2001). In the past years, it has become common practice in paleoceano-graphic studies to refer to AAIW/SAMW when speaking of, in general, a glacial South-ern component intermediate water, which originates from circumantarctic surface
wa-20
ters, subducts and subsequently spreads northwards (Bryan et al., 2010; Chen et al., 2011; Ninnemann and Charles, 1997; Spero and Lea, 2002). Although this is a simplifi-cation, it seems helpful when hypothesizing (schematically) about changes in Southern Ocean overturning (Marshall and Speer, 2012; Skinner et al., 2010). For the sake of clarity, we continue with this practice and refer to AAIW/SAMW subsequently in the
25
text, always keeping in mind that this term represents southern component intermedi-ate wintermedi-ater as part of the Southern Ocean overturning circulation.
CPD
9, 4035–4063, 2013Deglacial Intermediate Water
reorganization
S. Romahn et al.
Title Page
Abstract Introduction
Conclusions References
Tables Figures
◭ ◮
◭ ◮
Back Close
Full Screen / Esc
Printer-friendly Version Interactive Discussion
Discussion
P
a
per
|
D
iscussion
P
a
per
|
Discussion
P
a
per
|
Discuss
ion
P
a
per
3 Material and methods
3.1 Sampling
The gravity core GeoB12615-4 was recovered during Meteor cruise M75/2 in
Febru-ary 2008 at 07◦08.30′S 39◦50.45′W from 446 m water depth and spans 644 cm
(Savoye et al., 2013). For this study we sampled at 4 cm spacing with a sample width
5
of 1 cm. We wet sieved over 63 µm, 125 µm and 2 mm and dried the sediment fractions at 40◦C.
3.2 Age model
The chronology is based on 16 AMS (accelerator mass spectrometer) radiocarbon analyses, carried out at the Leibniz-Laboratory for Radiometric Dating and Isotope
Re-10
search, Kiel. Both monospecific planktic foraminifera samples (Globigerinoides ruber
white s.s.) and mixed samples of surface-dwelling planktic species (Globigerinoides
sacculifer,Globigerinella aequilateralis, Globigerinoides conglobatus) were analysed. Measured radiocarbon ages were converted into calibrated ages before present (BP) using the Calib 6.0 software (Stuiver et al., 2005), based on the Marine09 calibration
15
curve and a reservoir age correction of∆R=140 yr (Southon et al., 2002). The
sedi-mentation rate varies strongly between the Holocene (average of 46 cm kyr−1, highest
beween ∼8.7 and 8.2 kyr with 70 cm kyr−1) and the glacial (below 10 cm kyr−1). The
complete dataset covers the past 40 kyr (Fig. 2).
3.3 Oxygen and carbon isotopes
20
For isotopic analysis, six to eight individuals of G. ruber white s.s. and three to four
individuals of benthic foraminifer Planulina ariminensis were selected from the 250–
CPD
9, 4035–4063, 2013Deglacial Intermediate Water
reorganization
S. Romahn et al.
Title Page
Abstract Introduction
Conclusions References
Tables Figures
◭ ◮
◭ ◮
Back Close
Full Screen / Esc
Printer-friendly Version Interactive Discussion
Discussion
P
a
per
|
D
iscussion
P
a
per
|
Discussion
P
a
per
|
Discuss
ion
P
a
per
|
The isotope measurements were calibrated via NBS 19 international standard to the
PDB scale. All results are given inδ-notation versus VPDB. Precision of measurements
based on an internal laboratory standard (Solnhofen limestone) measured over a one-year period together with samples was better than 0.08 and 0.06 for oxygen and carbon isotopes, respectively
5
3.4 Mg/Ca ratios
35 to 45 individuals of G. ruber white s.s. (250–300 µm), were selected for Mg/Ca
analysis of every second sample of the uppermost part of the core, resulting in a sam-pling interval of 8 cm. In contrast, in the lowermost 2.50 m of the core each sample was analysed (4 cm sampling interval). The shell samples were gently crushed and cleaned
10
according to the cleaning protocol of Barker et al. (2003). Then the dissolved samples were centrifuged (10 min at 6000 rpm), transferred into autosampler tubes and diluted
for analysis. Mg/Ca ratios were measured using a Perkin Elmer Optima 3300 R
In-ductively Coupled Plasma Optical Emission Spectrophotometer (ICP-OES) equipped with an auto sampler and an ultrasonic nebulizer U-5000 AT (Cetac Technologies Inc.)
15
housed at the Faculty of Geosciences, University of Bremen. The Mg/Ca values are
re-ported as mmol mol−1. Instrumental precision was determined by analysis an external,
in-house standard (Mg/Ca=2.92 mmol mol−1), which was measured after every fifth
sample. The standard deviation of the external standard was±0.48 %. Reproducibility
of the samples (n=14) was±0.09 mmol mol−1. Long-term measurement of an
interna-20
tional limestone standard (ECRM752-1; Greaves et al., 2008) allows for interlaboratory
comparison. Mn/Ca, Fe/Ca and Al/Ca were determined along with Mg/Ca because
clay contamination of the foraminifera shells can affect the Mg/Ca ratios resulting in
overestimated SST (Barker et al., 2003). Our results indicate no significant Mg contri-butions due to Mn-oxides, Mn-rich carbonates or clay contaminiation because average
25
Mn/Ca, Fe/Ca and Al/Ca were<0.1 mmol mol−1. SSTs (T in◦C) were calculated
CPD
9, 4035–4063, 2013Deglacial Intermediate Water
reorganization
S. Romahn et al.
Title Page
Abstract Introduction
Conclusions References
Tables Figures
◭ ◮
◭ ◮
Back Close
Full Screen / Esc
Printer-friendly Version Interactive Discussion
Discussion
P
a
per
|
D
iscussion
P
a
per
|
Discussion
P
a
per
|
Discuss
ion
P
a
per
ing the equation given by Anand et al. (2003):
Mg/Ca (mmol mol−1
)=0.38 exp(0.090 T) (1)
4 Results
The δ18O record of planktic G. ruber white s.s. (noted as δ18Op) shifts between
−0.25 %during glacial conditions and−2.2 %during the Holocene. The deglacial
de-5
cline ofδ18Opstarts at 18.2 kyr and shows a clear setback to higher values at 13 kyr,
which appears to resemble the Greenland ice cores and therefore Northern
Hemi-sphere climate variability. In contrast, the stable isotope records of benthic P.
arimi-nensis(noted asδ18Obandδ13Cb) and the SST record are out of phase with surface
oxygen isotopes and resemble Antarctic climate variability. Theδ18Ob shifts between
10
2.5 %in the LGM and∼1 %for the Holocene. The record exhibits a deglacial decline
starting at 19.5 kyr, and a slackening ofδ18Obdecrease during the Antarctic Cold
Re-versal (ACR). The record of surface carbon isotopes shows quite consistent values of
0.9–1.1 %during the glacial, and an abrupt increase of about 0.7 %during the early
Holocene (EH), parallel to sea level rise, to∼1.4 %. Theδ13Cb varies around 1.5 %
15
between 35–18.2 kyr. Values decrease abruptly at 18.2 kyr (about 0.4 %), increase
during the ACR and reach a minimum of 0.9 %in the EH. Synchronous to the global
sea level rise, δ13Cb gradually increases about 0.5 % to Holocene levels of approx.
1.5 %. The Mg/Ca based SST record exhibits a similar deglacial variability and shows
a sudden temperature increase from∼25◦C to 27◦C at 18.2 kyr, an ACR-like
temper-20
ature drop starting at 15 kyr, and a final increase to Holocene temperatures (28–29◦C)
at around 13 kyr. To sum up; theδ18Opsurface signal can be linked to Northern
Hemi-sphere (NH) climate variability, whereas both the Mg/Ca based SST, as well as the
δ18Ob and δ13Cb deep-water records are in line with Antarctic temperature records
(Fig. 3).
CPD
9, 4035–4063, 2013Deglacial Intermediate Water
reorganization
S. Romahn et al.
Title Page
Abstract Introduction
Conclusions References
Tables Figures
◭ ◮
◭ ◮
Back Close
Full Screen / Esc
Printer-friendly Version Interactive Discussion
Discussion
P
a
per
|
D
iscussion
P
a
per
|
Discussion
P
a
per
|
Discuss
ion
P
a
per
|
5 Discussion
5.1 Oceanic tunnel transmitting Antarctic temperature
It is a widespread feature of the Indian Ocean to show an Antarctic-style deglacial warming in surface-based temperature proxies (Govil and Naidu, 2010; Huguet et al.,
2006; Levi et al., 2007), while surfaceδ18O varies independently of SST
reconstruc-5
tions and likely reflects the influence of the monsoon (Anand et al., 2008; Huguet et al.,
2006; Levi et al., 2007). On the contrary, benthicδ18O records of intermediate depth
carry a typical Antarctic signature (Anand et al., 2008; Jung et al., 2009; Lueckge et al., 2012). The idea that SST variability in the western Indian Ocean is controlled by Antarctic temperature via SAMW has been proposed by Kiefer et al. (2006) and
10
was corroborated by Naidu and Govil (2010). The authors suggest the “oceanic tunnel” mechanism (Liu and Yang, 2003; Ninnemann et al., 2006), in form of SAMW that orig-inates from subantarctic surface waters. After subducting and spreading northwards, SAMW returns to the surface in regions of equatorial upwelling and thus conveys sur-face water anomalies from the Subantarctic Zone to the tropical Indian Ocean. Here
15
we confirm this interpretation by presenting a SST record from a location of modern AAIW/SAMW influence that clearly shows simultaneous warming of the tropical west-ern Indian Ocean and Antarctica (Fig. 3). We find that our data necessarily call for an oceanic mechanism that modulated SST variability, for two reasons.
First, we can exclude that atmospheric processes controlled SST variability, because
20
δ18Op of GeoB12615-4 with its distinct NH pattern differs so clearly from the SST
data. This indicates two independent factors affect the surface water properties at our
study site. Similarly, the Arabian Sea record NIOP905 (Huguet et al., 2006) exhibits an Antarctic-style SST pattern as well, evident in two independent surface temperature
proxy reconstructions (TEX86 and alkenones), while the corresponding δ
15
N record
25
and planktic δ18O follows NH climate variability. The δ15N, a proxy for productivity
changes, as well as plankticδ18O likely reflect the strength of the Arabian Sea
CPD
9, 4035–4063, 2013Deglacial Intermediate Water
reorganization
S. Romahn et al.
Title Page
Abstract Introduction
Conclusions References
Tables Figures
◭ ◮
◭ ◮
Back Close
Full Screen / Esc
Printer-friendly Version Interactive Discussion
Discussion
P
a
per
|
D
iscussion
P
a
per
|
Discussion
P
a
per
|
Discuss
ion
P
a
per
mer Monsoon (Ivanochko et al., 2005). If we conclude that ourδ18Opreflects monsoon
strength as well, and hence is controlled by an atmospheric process following NH
cli-mate, then SST variability following antarctic climate must be modulated differently. If
atmospheric control can be ruled out, only oceanic control remains as a mechanism modulating SST.
5
Second, the benthic record of GeoB12615-4 does not only exhibit aδ18Obsignal that
is in phase with Antarctic temperature variability, it also shows a distinct carbon isotope minimum event (CIME) during the deglaciation (Ninnemann and Charles, 1997; Spero and Lea, 2002). This minimum is a common feature of both southern high latitude
plankticδ13C profiles (Bostock et al., 2004; Lopes dos Santos et al., 2012; Ninnemann
10
and Charles, 1997; Pahnke and Zahn, 2005) and of tropicalδ13C records of
subther-mocline and intermediate depth (Curry and Oppo, 2005; Oppo and Fairbanks, 1989; Stott et al., 2009; Zahn and Stüber, 2002). Oppo and Fairbanks (1989) suggested CIME to be linked to AAIW/SAMW, and Lynch-Stieglitz et al. (1994) and Ninnemann and Charles (1997) assumed that CIME at sites ventilated by AAIW/SAMW reflect a
pre-15
formed signal from Subantarctic surface waters. The combination of Antarctic-style
benthicδ18O and benthicδ13C from site GeoB12615-4, showing a distinct deglacial
minimum, confirms that the “oceanic tunnel” in form of AAIW/SAMW is the most likely mechanism controlling past SST in the western Indian Ocean.
5.2 AAIW/SAMW formation during the deglaciation
20
If SST variability is controlled by AAIW/SAMW, transmitting Antarctic temperature to the
tropics, what in turn does the benthicδ13C record tell us about AAIW/SAMW variability
since glacial times? We first evaluate how the observed pattern in our benthic signal
can be best explained by current concepts of deglacialδ13CDICsetting in the Southern
Ocean.
CPD
9, 4035–4063, 2013Deglacial Intermediate Water
reorganization
S. Romahn et al.
Title Page
Abstract Introduction
Conclusions References
Tables Figures
◭ ◮
◭ ◮
Back Close
Full Screen / Esc
Printer-friendly Version Interactive Discussion
Discussion
P
a
per
|
D
iscussion
P
a
per
|
Discussion
P
a
per
|
Discuss
ion
P
a
per
|
We then discuss how the spatial extent of AAIW/SAMW may have varied since the last glacial by combining our findings in the western Indian Ocean with recent data that focus on AAIW/SAMW variability as well.
5.2.1 Preformedδ13C of deglacial AAIW/SAMW?
As described above, the globally distributed deglacialδ13C minima (CIME) are
con-5
sistently interpreted to reflect deep upwelling in the Southern Ocean and intermediate
distribution of old,δ13C depleted water (Spero and Lea, 2002). Moreover, findings of
radiocarbon depleted intermediate waters have been reported from all oceans so far (Bryan et al., 2010; Mangini et al., 2010; Marchitto et al., 2007; Stott et al., 2009; Thornalley et al., 2011), but there are just as many results where no injections of old
10
water could be found (Cléroux et al., 2011; De Pol-Holz et al., 2010, 2012; Rose et al., 2010; Sortor and Lund, 2011). If the strong depletion in radiocarbon was the result of increased upwelling of a long-time isolated carbon reservoir, it should stringently
coincide with a δ13C minimum of the same water mass, just as described by Spero
and Lea (2002). This is the case for sites with pronounced radiocarbon depletions,
15
such as off Baja California (Marchitto et al., 2007) and south of Iceland (Thornalley
et al., 2010). This hypothesis also holds for the Indian Ocean, if we combine the re-sults of Geob12615-4 and recently published ventilation age reconstructions in the
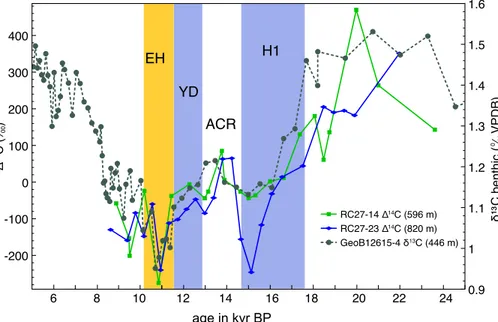
Arabian Sea (Bryan et al., 2010). We compareδ13Cbof GeoB12615-4 to intermediate
water ventilation (∆14C (%)), reconstructed from sediment cores 14 and
RC27-20
23, and see a remarkable similarity between the minima in our benthic carbon and
highest values of intermediate water ∆14C, especially when comparing to RC27-14
(596 m water depth) (Fig. 4). Whereas other 14C anomalies, that are likely
transmit-ted by AAIW/SAMW, indicate pulses of aged intermediate water during H1 and the Younger Dryas (Marchitto et al., 2007), the Arabian Sea records do not show high
ven-25
tilation ages during YD. Instead, we see very large benthos–plankton differences and
therefore the highest ventilation ages during the early Holocene (EH) in the Arabian
Sea. This is exactly the same time interval when lowest δ13Cb values are found in
CPD
9, 4035–4063, 2013Deglacial Intermediate Water
reorganization
S. Romahn et al.
Title Page
Abstract Introduction
Conclusions References
Tables Figures
◭ ◮
◭ ◮
Back Close
Full Screen / Esc
Printer-friendly Version Interactive Discussion
Discussion
P
a
per
|
D
iscussion
P
a
per
|
Discussion
P
a
per
|
Discuss
ion
P
a
per
GeoB12615-4. Additionally, the signals of core RC27-14 (596 m) and GeoB12615-4 (446 m), both monitoring a similar water depth, correlate more explicitly, which argues for a large-scale connection and a watermass like AAIW/SAMW to be the transmitter of both anomalies in the Indian Ocean. Therefore we conclude that the bottom signal of GeoB12615-4 reflects the deglacial evolution of the Southern Ocean and gives
evi-5
dence of upwelled aged deep waters (Broecker, 1982) at high southern latitudes, which then flow northwards into all ocean basins as AAIW/SAMW.
5.2.2 CIME caused by temperature-dependent fractionation?
The carbon isotopic fractionation between atmosphere and ocean increases with
de-creasing temperature, with lower temperatures resulting in more enriched δ13C
val-10
ues of dissolved inorganic carbon (δ13CDIC) in seawater (Broecker and Maier-Reimer,
1992; Mackensen, 2008). Though there is no region where surface ocean carbon is in
complete isotopic equilibrium with the atmosphere, the effects related to air–sea gas
exchange play an important role in defining the surface δ13CDIC, working in the
op-posite direction to the effect of biological cycling (Broecker and Maier-Reimer, 1992;
15
Lynch-Stieglitz et al., 1995; Mackensen, 2012). Today, we find the highest δ13CDIC
values of surface waters along the Subantarctic Front (SAF), between 45◦ to 55◦S,
because of low circumantarctic temperatures and enhanced air–sea gas exchange (Broecker and Maier-Reimer, 1992).
As the SST record and δ13Cb (reflecting AAIW/SAMW) of GeoB12615-4 match
20
so well during the deglaciation (Fig. 5), one could suggest that δ13Cb and therefore
δ13CDIC of AAIW/SAMW was simply the expression of temperature change at high
southern latitudes, or in other words, the formation area of AAIW/SAMW: During the
LGM,δ13CDICof see-ice free surface seawater at high southern latitudes was high due
to low temperatures and high wind speed. A deglacial temperature rise may have
de-25
creased the thermodynamic fractionation and therefore lead to lower values of surface
CPD
9, 4035–4063, 2013Deglacial Intermediate Water
reorganization
S. Romahn et al.
Title Page
Abstract Introduction
Conclusions References
Tables Figures
◭ ◮
◭ ◮
Back Close
Full Screen / Esc
Printer-friendly Version Interactive Discussion
Discussion
P
a
per
|
D
iscussion
P
a
per
|
Discussion
P
a
per
|
Discuss
ion
P
a
per
|
was transferred to low latitudes as AAIW/SAMW almost time-invariant. In fact, if we
as-sume 0.1 %depletion ofδ13CDICper degree centigrade of cooling (Mook et al., 1974;
Zhang et al., 1995), we would expect aδ13C decrease of 0.35 %for the deglaciation
until the EH, and this comes close to the observed∼0.5 % shift in deglacial δ13Cb.
Additionally, a displacement of the westerly wind belt (Lamy et al., 2004; Wyrwoll et al.,
5
2000) may have reduced air–sea gas exchange of Southern Ocean surface waters, as proposed by Ninnemann and Charles (1997). According to this interpretation, deglacial
δ13Cb of GeoB12615-4 as well as the global ocurrence of CIME in shallow depth can
be entirely explained by Southern Ocean surface water temperature variability and
ac-cordingly altered thermodynamic fractionation during air–sea CO2 exchange at high
10
latitudes, as originally proposed by Ninnemann and Charles (1997).
Indeed, based on our data alone we could reason that the deglacial CIME in our record is a purely temperature-dependent signal.
However, the corresponding radiocarbon depletions off Oman (Bryan et al., 2010)
call for a mechanism that best explains the occurrence of both signals, CIME and
15
radiocarbon depletions, detected in the same water mass; namely the mechanism pro-posed by Spero and Lea (2002). Nevertheless, since we cannot determine important prerequisites, such as the degree of equilibration between the surface ocean carbon and atmosphere, we do not want to definitely exclude that temperature-dependent frac-tionation during air–sea gas exchange played a role in developing deglacial CIME in
20
AAIW/SAMW.
5.2.3 An additional atmospheric pathway for transmission of CIME?
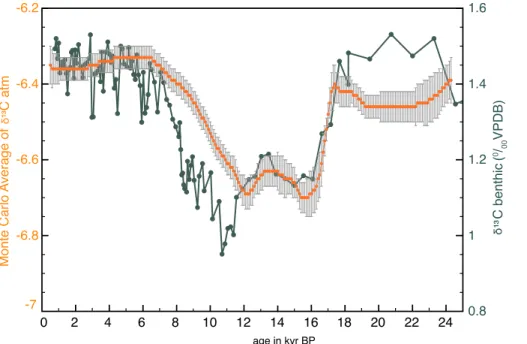
The carbon isotope ratio of atmospheric CO2 (δ13Catm) experienced pronounced
de-pletion during the deglaciation as well. New findings ofδ13Catm (Schmitt et al., 2012)
are likewise explained by the release of old carbon from the deep ocean, and in line with
25
the concept drafted by Spero and Lea (2002). The high-resolution record showsδ13C
minima during H1 and YD, which is in line with the timing of the early H1-synchron
CPD
9, 4035–4063, 2013Deglacial Intermediate Water
reorganization
S. Romahn et al.
Title Page
Abstract Introduction
Conclusions References
Tables Figures
◭ ◮
◭ ◮
Back Close
Full Screen / Esc
Printer-friendly Version Interactive Discussion
Discussion
P
a
per
|
D
iscussion
P
a
per
|
Discussion
P
a
per
|
Discuss
ion
P
a
per
CIME of many marine records, and also correlates with our benthic carbon isotope record (Fig. 6). Since a pronounced CIME without an associated radiocarbon depletion
has been identified in intermediate waters offequatorial Africa (Cléroux et al., 2011),
one has to consider that both signals needn’t necessarily to be coupled, even though they may arise from the same process. In the Philippine Sea, western Pacific, the
5
carbon isotope minimum is recorded in both surface and subsurface water, but with
differing amplitude and timing. The independent signals are thought to be formed by
atmospheric CO2imprint on the surface water in case of the surface signal, and via the
“oceanic tunnel” and thus preformed AAIW in case of the subsurface one (Chen et al., 2011). So, the atmosphere can probably work as an additional pathway for transmitting
10
the deglacial CIME to tropical oceans, which should be considered when interpreting
deglacialδ13C profiles. Comparing our data (Fig. 6) to the recent record of δ13Catm
(Schmitt et al., 2012), the initial drop in bothδ13Catmandδ13C of AAIW/SAMW occurs
synchronous and is of the same magnitude (approx. 0.3 %). However, since 12.3 kyr
BP both records vary independently. This mismatch, along with the synchronous peaks
15
of old carbon offOman (Bryan et al., 2010), corroborates that the “oceanic tunnel” (Liu
and Yang, 2003) mechanism is configuring the intermediate water history at our site.
5.2.4 Diminished or enhanced glacial AAIW/SAMW formation?
A current hypothesis proposes an enhanced production and northward flow of AAIW during H1 and YD in the Atlantic (Pahnke et al., 2008), the Pacific (Pahnke and
20
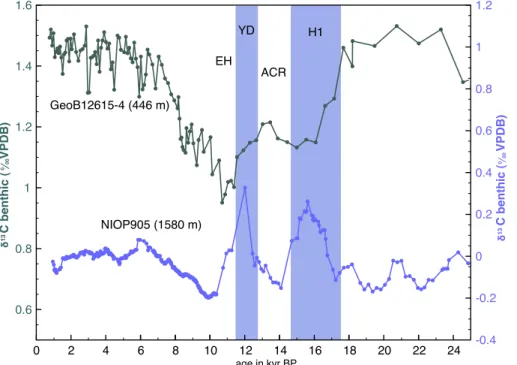
Zahn, 2005) and in the Indian Ocean (Jung et al., 2009). For example, sediment core
NIOP905 (1580 m) from the continental slope off Somalia (Fig. 7, see Fig. 1 for core
location) shows an increase of benthic δ13C during H1 and YD, which suggests
in-tensified AAIW formation and inflow to the Indian Ocean (Jung et al., 2009). This is in line with results from the Pacific (MD97-2120, 1210 m, Pahnke and Zahn, 2005)
25
and Atlantic Ocean (Pahnke et al., 2008), which also show higher benthicδ13C and
pro-CPD
9, 4035–4063, 2013Deglacial Intermediate Water
reorganization
S. Romahn et al.
Title Page
Abstract Introduction
Conclusions References
Tables Figures
◭ ◮
◭ ◮
Back Close
Full Screen / Esc
Printer-friendly Version Interactive Discussion
Discussion
P
a
per
|
D
iscussion
P
a
per
|
Discussion
P
a
per
|
Discuss
ion
P
a
per
|
nounced CIME as a large-scale water mass signal, then our data contradict the inter-pretation of enhanced deglacial AAIW production (and subsequent inflow to the
Ara-bian Sea), because both δ13C datasets (NIOP905 and GeoB12615-4) anticorrelate
during this specific time interval (H1 and YD) (Fig. 7). This apparent anticorrelation of carbon isotope signals within the intermediate stockwork was found in the South
Pa-5
cific as well (Bostock et al., 2004), and it can even be found when using other water
mass proxies, such as authigenic neodymium isotope ratios (εNd) of seawater: two
re-cent studies from the western tropical Atlantic present anticorrelatingεNd records from
546 m and 1330 m water depth, which potentially reflects reduced or even no contri-bution of deglacial AAIW in case of the shallow record, and enhanced advection of
10
deglacial AAIW in case of the deeper one, respectively (Pahnke et al., 2008; Xie et al., 2012) – a contradiction which calls for an alternative interpretation of global
intermedi-ate wintermedi-ater records that cover this particular time period. In general, the deglacialδ13C
minimum seems to be restricted to the surface and intermediate level down to approx-imately 800–900 m water depth both in the Indian Ocean and the Pacific, whereas the
15
deglacial δ13C increase, consistently interpreted as “enhanced” flow of AAIW,
char-acterizes the lower intermediate level of 1000–1500 m water depth, such as recorded in NIOP905 or MD97-2120, respectively. Furthermore, the upper water level is mostly
associated to the radiocarbon depletion, whereas the lower level, showing the δ13C
maximum, gives no evidence of anomalous high ventilation ages (Rose et al., 2010).
20
Bryan et al. (2011) suggest a deglacial boundary shift between AAIW and Circumpolar Deep Water (CDW), as ventilation age reconstructions in the Pacific Ocean at 1032 m
water depth show much older glacial waters and a deglacial increase in∆14C.
Con-sequently, the missing signature of old carbon in some intermediate records can only be explained by the fact that the chosen core site is located “too deep” (1000 m and
25
greater water depth) and does not catch deglacial AAIW/SAMW.
Transferring this idea to the Arabian Sea, we suggestδ13Cb of NIOP905 does not
record AAIW/SAMW at any time. Instead, benthicδ13C of NIOP905 seems to record
a watermass that is unaffected of the specific upwelling processes in the deglacial
CPD
9, 4035–4063, 2013Deglacial Intermediate Water
reorganization
S. Romahn et al.
Title Page
Abstract Introduction
Conclusions References
Tables Figures
◭ ◮
◭ ◮
Back Close
Full Screen / Esc
Printer-friendly Version Interactive Discussion
Discussion
P
a
per
|
D
iscussion
P
a
per
|
Discussion
P
a
per
|
Discuss
ion
P
a
per
Southern Ocean, that lead to both CIME and strong radiocarbon depletions in
south-ern component intermediate waters. It rather resembles theδ13Cbpattern observed in
mid-depth South Atlantic (Ziegler et al., 2013), representing one part of the “mid-depth overturning circuit” in the Southern Ocean. Hence we suggest that the benthic record of NIOP905 as well as those of other “deeper” intermediate sites, such as MD97-2120
5
(Pahnke and Zahn, 2005) and GC-12 (Bostock et al., 2004) from the Pacific, might record a deglacial analogue of modern CDW predominantly, as part of the South-ern Ocean overturning (Skinner et al., 2010; Ziegler et al., 2013). Particularly higher
δ13C values of deglacial CDW might result from changing endmember compositions
(Curry and Oppo, 2005) in the deep Southern Ocean, and this is how we interpret
10
the pattern observed in benthic records of “deeper” intermediate sites. The fact that glacial–interglacial changes in Southern Ocean overturning circulation most likely re-sult in changing water mass signatures has to be taken into account when interpreting
deglacialδ13C profiles. Moreover, considering the concept that preformedδ13C
deter-mined the signature of deglacial AAIW/SAMW, we suggest that AAIW/SAMW
convec-15
tion was restricted down to approx. 800–900 m, whereas the lower intermediate levels were filled by a southern-sourced water analogue to modern CDW.
6 Conclusions
In this study we present evidence that deglacial SST variability in the western Indian Ocean is primarily controlled by Antarctic air temperature, which was transmitted to the
20
equatorial Indian Ocean on a subsurface pathway by AAIW/SAMW. We discuss current
concepts of what determines the deglacial AAIW/SAMWδ13C signature, and we
sup-port the hypothesis (Spero and Lea, 2002) that deglacial upwelling of isolated Southern Ocean deep water caused a drop in atmospheric, surface and subsurface ocean car-bon isotopy (CIME) and thereby determines the AAIW/SAMW signature recorded at
25
CPD
9, 4035–4063, 2013Deglacial Intermediate Water
reorganization
S. Romahn et al.
Title Page
Abstract Introduction
Conclusions References
Tables Figures
◭ ◮
◭ ◮
Back Close
Full Screen / Esc
Printer-friendly Version Interactive Discussion
Discussion
P
a
per
|
D
iscussion
P
a
per
|
Discussion
P
a
per
|
Discuss
ion
P
a
per
|
Moreover, we discuss whether recent carbon isotope records of the intermediate ocean give evidence of enhanced AAIW/SAMW flow during H1 and YD, but we do not find that deglacial AAIW/SAMW formation was enhanced. Instead, we suggest that AAIW/SAMW convection depth was shallower than today, whereas the deeper
inter-mediate levels (>1000 m) were filled by southern-sourced water analogue to
mod-5
ern CDW. Finally, the question remains unanswered why Indian Ocean AAIW/SAMW shows a pronounced CIME and corresponding radiocarbon minimum (Bryan et al., 2011) during the EH, while other regional (Marchitto et al., 2007) and global records (Schmitt et al., 2012) precede.
Acknowledgements. We thank Günther Meyer, Heike Röben, Lisa Schönborn, Susanne Wiebe
10
for help and advice in the laboratories, as well as the ship crew and scientific parties of Meteor cruise M75/2. We also thank Franziska Kersten and Johannes Ullermann for essential discus-sion and comments. This work was funded by the Deutsche Forschungsgemeinschaft (DFG) as part of the DFG-Research Center/Cluster of Excellence MARUM “The Ocean in the Earth System”.
15
References
Anand, P., Elderfield, H., and Conte, M. H.: Calibration of Mg/Ca thermometry in plank-tonic foraminifera from a sediment trap time series, Paleoceanography, 18, PA1050, doi:10.1029/2002PA000846, 2003.
Anand, P., Kroon, D., Singh, A. D., Ganeshram, R. S., Ganssen, G., and Elderfield, H.: Coupled
20
sea surface temperature–seawaterδ18O reconstructions in the Arabian Sea at the millennial scale for the last 35 ka, Paleoceanography, 23, PA4207, doi:10.1029/2007PA001564, 2008. Andersen, K. K., Azuma, N., Barnola, J.-M., Bigler, M., Biscaye, P., Caillon, N., Chappellaz, J.,
Clausen, H. B., Dahl-Jensen, D., and Fischer, H.: High-resolution record of Northern Hemi-sphere climate extending into the last interglacial period, Nature, 431, 147–151, 2004.
25
Barker, S., Greaves, M., and Elderfield, H.: A study of cleaning procedures used for foraminiferal Mg/Ca paleothermometry, Geochem. Geophy. Geosy., 4, 8407, doi:10.1029/2003GC000559, 2003.
CPD
9, 4035–4063, 2013Deglacial Intermediate Water
reorganization
S. Romahn et al.
Title Page
Abstract Introduction
Conclusions References
Tables Figures
◭ ◮
◭ ◮
Back Close
Full Screen / Esc
Printer-friendly Version Interactive Discussion
Discussion
P
a
per
|
D
iscussion
P
a
per
|
Discussion
P
a
per
|
Discuss
ion
P
a
per
Bostock, H. C., Opdyke, B. N., Gagan, M. K., and Fifield, L. K.: Carbon isotope ev-idence for changes in Antarctic Intermediate Water circulation and ocean ventilation in the southwest Pacific during the last deglaciation, Paleoceanography, 19, PA4013, doi:10.1029/2004PA001047, 2004.
Broecker, W.: Glacial to interglacial changes in ocean chemistry, Prog. Oceanogr., 11, 151–
5
197, 1982.
Broecker, W. S. and Maier-Reimer, E.: The influence of air and sea exchange on the carbon isotope distribution in the sea, Global Biogeochem. Cy., 6, 315–320, 1992.
Bryan, S., Lehman, S., Marchitto, T., and Ninnemann, U.: Intermediate Water Radiocarbon Anomalies During the Last Deglaciation, AGU Fall Meeting, San Francisco, California, USA,
10
5–9 December 2011, PP23E-02, 2006.
Bryan, S. P., Marchitto, T. M., and Lehman, S. J.: The release of14C-depleted carbon from the deep ocean during the last deglaciation: evidence from the Arabian Sea, Earth Planet. Sc. Lett., 298, 244–254, 2010.
Chen, S. X., Li, T. G., Tang, Z., Qiu, X. H., Xiong, Z. F., Nan, Q. Y., Xu, Z. K., and Chang, F. M.:
15
Response of the northwestern Pacific upper water δ13C to the last deglacial ventilation of the deep Southern Ocean, Chinese Sci. Bull., 56, 2628–2634, 2011.
Cléroux, C., deMenocal, P., and Guilderson, T.: Deglacial radiocarbon history of tropical At-lantic thermocline waters: absence of CO2 reservoir purging signal, Quaternary Sci. Rev., 30, 1875–1882, 2011.
20
Curry, W. B. and Oppo, D. W.: Glacial water mass geometry and the distribution ofδ13C ofΣCO 2
in the western Atlantic Ocean, Paleoceanography, 20, PA1017, doi:10.1029/2004PA001021, 2005.
De Pol-Holz, R., Keigwin, L., Southon, J., Hebbeln, D., and Mohtadi, M.: No signature of abyssal carbon in intermediate waters offChile during deglaciation, Nat. Geosci., 3, 192–195, 2010.
25
De Pol-Holz, R., Mohtadi, M., and Southon, J.: Intermediate water radiocarbon offwest Sumatra
during the last 45 000 years, EGU General Assembly, Vienna, Austria, 22–27 April 2012, EGU2012-11829, 2012.
Fine, R. A., Smethie Jr., W. M., Bullister, J. L., Rhein, M., Min, D.-H., Warner, M. J., Poisson, A., and Weiss, R. F.: Decadal ventilation and mixing of Indian Ocean waters, Deep-Sea Res. Pt.
30
CPD
9, 4035–4063, 2013Deglacial Intermediate Water
reorganization
S. Romahn et al.
Title Page
Abstract Introduction
Conclusions References
Tables Figures
◭ ◮
◭ ◮
Back Close
Full Screen / Esc
Printer-friendly Version Interactive Discussion
Discussion
P
a
per
|
D
iscussion
P
a
per
|
Discussion
P
a
per
|
Discuss
ion
P
a
per
|
Govil, P. and Naidu, P. D.: Evaporation–precipitation changes in the eastern Arabian Sea for the last 68 ka, implications on monsoon variability, Paleoceanography, 25, PA1210, doi:10.1029/2008PA001687, 2010.
Greaves, M., Caillon, N., Rebaubier, H., Bartoli, G., Bohaty, S., Cacho, I., Clarke, L., Cooper, M., Daunt, C., and Delaney, M.: Interlaboratory comparison study of calibration
5
standards for foraminiferal Mg/Ca thermometry, Geochem. Geophy. Geosy., 9, Q08010, doi:10.1029/2008GC001974, 2008.
Hartin, C. A., Fine, R. A., Sloyan, B. M., Talley, L. D., Chereskin, T. K., and Happell, J.: Formation rates of Subantarctic mode water and Antarctic intermediate water within the South Pacific, Deep-Sea Res. Pt. I, 58, 524–534, 2011.
10
Huguet, C., Kim, J. H., Damsté, J. S. S., and Schouten, S.: Reconstruction of sea surface temperature variations in the Arabian Sea over the last 23 kyr using organic proxies (TEX86 and UK37), Paleoceanography, 21, PA3003, doi:10.1029/2005PA001215, 2006.
Ivanochko, T. S., Ganeshram, R. S., Brummer, G.-J. A., Ganssen, G., Jung, S. J., More-ton, S. G., and Kroon, D.: Variations in tropical convection as an amplifier of global climate
15
change at the millennial scale, 235, 302–314, doi:10.1016/j.epsl.2005.04.002, 2005. Jouzel, J., Masson-Delmotte, V., Cattani, O., Dreyfus, G., Falourd, S., Hoffmann, G., Minster, B.,
Nouet, J., Barnola, J.-M., and Chappellaz, J.: Orbital and millennial Antarctic climate variabil-ity over the past 800 000 years, Science, 317, 793–796, 2007.
Jung, S. J. A., Kroon, D., Ganssen, G., Peeters, F., and Ganeshram, R.: Enhanced Arabian Sea
20
intermediate water flow during glacial North Atlantic cold phases, Earth Planet. Sc. Lett., 280, 220–228, 2009.
Keigwin, L. D.: Radiocarbon and stable isotope constraints on Last Glacial Maximum and Younger Dryas ventilation in the western North Atlantic, Paleoceanography, 19, PA4012, doi:10.1029/2004PA001029, 2004.
25
Kiefer, T., McCave, I. N., and Elderfield, H.: Antarctic control on tropical Indian Ocean sea surface temperature and hydrography, Geophys. Res. Lett, 33, L24612, doi:10.1029/2006GL027097, 2006.
Lamy, F., Kaiser, J., Ninnemann, U., Hebbeln, D., Arz, H. W., and Stoner, J.: Antarctic timing of surface water changes off Chile and Patagonian ice sheet response, Science, 304, 1959–
30
1962, 2004.
Levi, C., Labeyrie, L., Bassinot, F., Guichard, F., Cortijo, E., Waelbroeck, C., Caillon, N., Duprat, J., de Garidel-Thoron, T., and Elderfield, H.: Low-latitude hydrological cycle and
CPD
9, 4035–4063, 2013Deglacial Intermediate Water
reorganization
S. Romahn et al.
Title Page
Abstract Introduction
Conclusions References
Tables Figures
◭ ◮
◭ ◮
Back Close
Full Screen / Esc
Printer-friendly Version Interactive Discussion
Discussion
P
a
per
|
D
iscussion
P
a
per
|
Discussion
P
a
per
|
Discuss
ion
P
a
per
rapid climate changes during the last deglaciation, Geochem. Geophy. Geosy., 8, Q05N12, doi:10.1029/2006GC001514, 2007.
Liu, Z. and Yang, H.: Extratropical control of tropical climate, the atmospheric bridge and oceanic tunnel, Geophys. Res. Lett, 30, 1230, doi:10.1029/2002GL016492, 2003.
Lopes dos Santos, R. A., Wilkins, D., De Deckker, P., and Schouten, S.: Late Quaternary
pro-5
ductivity changes from offshore Southeastern Australia: a biomarker approach, Palaeogeogr.
Palaeocl., 363–364, 48–56, 2012.
Lueckge, A., Deplazes, G., Stuut, J. B., Pätzold, J., Kuhlmann, H., Scheeder, G., and Haug, G.: Monsoonal and oceanographic variability in the Arabian Sea during the last glacial period, AGU Fall Meeting, San Francisco, California, USA, 3–7 December 2012, PP52A-07, 2012.
10
Lynch-Stieglitz, J., Fairbanks, R. G., and Charles, C. D.: Glacial–interglacial history of Antarc-tic Intermediate Water: relative strengths of AntarcAntarc-tic versus Indian Ocean sources, Paleo-ceanography, 9, PA729, doi:10.1029/93PA02446, 1994.
Lynch-Stieglitz, J., Stocker, T. F., Broecker, W. S., and Fairbanks, R. G.: The influence of air–sea exchange on the isotopic composition of oceanic carbon: observations and modeling, Global
15
Biogeochem. Cy., 9, 653–665, 1995.
Mackensen, A.: On the use of benthic foraminiferalδ13C in palaeoceanography: constraints from primary proxy relationships, Geol. Soc. Lond. Spec. Pub., 303, 121–133, 2008.
Mackensen, A.: Strong thermodynamic imprint on recent bottom-water and epibenthicδ13C in the Weddell Sea revealed: implications for glacial Southern Ocean ventilation, Earth Planet.
20
Sc. Lett., 317–318, 20–26, 2012.
Mangini, A., Godoy, J., Godoy, M., Kowsmann, R., Santos, G., Ruckelshausen, M., Schroeder-Ritzrau, A., and Wacker, L.: Deep sea corals off Brazil verify a poorly ventilated Southern
Pacific Ocean during H2, H1 and the Younger Dryas, Earth Planet. Sc. Lett., 293, 269–276, 2010.
25
Marchitto, T. M., Lehman, S. J., Ortiz, J. D., Flückiger, J., and van Geen, A.: Marine radiocarbon evidence for the mechanism of deglacial atmospheric CO2 rise, Science, 316, 1456–1459, 2007.
Marshall, J. and Speer, K.: Closure of the meridional overturning circulation through Southern Ocean upwelling, Nat. Geosci., 5, 171–180, 2012.
30
CPD
9, 4035–4063, 2013Deglacial Intermediate Water
reorganization
S. Romahn et al.
Title Page
Abstract Introduction
Conclusions References
Tables Figures
◭ ◮
◭ ◮
Back Close
Full Screen / Esc
Printer-friendly Version Interactive Discussion
Discussion
P
a
per
|
D
iscussion
P
a
per
|
Discussion
P
a
per
|
Discuss
ion
P
a
per
|
Mook, W., Bommerson, J., and Staverman, W.: Carbon isotope fractionation between dissolved bicarbonate and gaseous carbon dioxide, Earth Planet. Sc. Lett., 22, 169–176, 1974. Naidu, P. D. and Govil, P.: New evidence on the sequence of deglacial warming in the tropical
Indian Ocean, J. Quaternary Sci., 25, 1138–1143, 2010.
Ninnemann, U. S. and Charles, C. D.: Regional differences in Quaternary Subantarctic nutrient
5
cycling: link to intermediate and deep water ventilation, Paleoceanography, 12, 560–567, 1997.
Ninnemann, U. S., Kleiven, H., and Euler, C.: Covariation in SE Pacific surface and intermediate water properties on centennial–millennial timescales-constraints on the role of the “oceanic tunnel” in abrupt climate change, EGU General Assembly, Vienna, Austria, 2–7 April 2006,
10
EGU06-A-11008, 2006.
Oppo, D. W. and Fairbanks, R. G.: Carbon isotope composition of tropical surface water during the past 22 000 years, Paleoceanography, 4, 333–351, 1989.
Pahnke, K. and Zahn, R.: Southern Hemisphere water mass conversion linked with North At-lantic climate variability, Science, 307, 1741–1746, 2005.
15
Pahnke, K., Goldstein, S. L., and Hemming, S. R.: Abrupt changes in Antarctic Intermediate Water circulation over the past 25 000 years, Nat. Geosci., 1, 870–874, 2008.
Pena, L., Goldstein, S., Hemming, S., Jones, K., Calvo, E., Pelejero, C., and Cacho, I.: Rapid changes in meridional advection of Southern Ocean intermediate waters to the tropical Pa-cific during the last 30 kyr, Earth Planet. Sc. Lett., 368, 20–32, 2013.
20
Robinson, L. F., Adkins, J. F., Keigwin, L. D., Southon, J., Fernandez, D. P., Wang, S., and Scheirer, D. S.: Radiocarbon variability in the western North Atlantic during the last deglacia-tion, Science, 310, 1469–1473, 2005.
Rose, K. A., Sikes, E. L., Guilderson, T. P., Shane, P., Hill, T. M., Zahn, R., and Spero, H. J.: Upper-ocean-to-atmosphere radiocarbon offsets imply fast deglacial carbon dioxide release,
25
Nature, 466, 1093–1097, 2010.
Savoye, B., Ridderinkhof, H., Pätzold, J., and Schneider, R.: Western Indian Ocean Climate and Sedimentation, Cruise No. M75, 29 December 2007–April, 2008, Port Louis (Mauritius)– Cape Town (South Africa), METEOR-Berichte, 196, 2013.
Schmitt, J., Schneider, R., Elsig, J., Leuenberger, D., Lourantou, A., Chappellaz, J., Köhler, P.,
30
Joos, F., Stocker, T. F., and Leuenberger, M.: Carbon isotope constraints on the deglacial CO2rise from ice cores, Science, 336, 711–714, 2012.
CPD
9, 4035–4063, 2013Deglacial Intermediate Water
reorganization
S. Romahn et al.
Title Page
Abstract Introduction
Conclusions References
Tables Figures
◭ ◮
◭ ◮
Back Close
Full Screen / Esc
Printer-friendly Version Interactive Discussion
Discussion
P
a
per
|
D
iscussion
P
a
per
|
Discussion
P
a
per
|
Discuss
ion
P
a
per
Schott, F. A. and McCreary, J. P.: The monsoon circulation of the Indian Ocean, Prog. Oceanogr., 51, 1–123, 2001.
Schott, F. A., Dengler, M., and Schoenefeldt, R.: The shallow overturning circulation of the Indian Ocean, Prog. Oceanogr., 53, 57–103, 2002.
Schott, F. A., Xie, S.-P., and McCreary Jr., J. P.: Indian Ocean circulation and climate variability,
5
Rev. Geophys., 47, RG1002, doi:10.1029/2007RG000245, 2009.
Sikes, E. L., Samson, C. R., Guilderson, T. P., and Howard, W. R.: Old radiocarbon ages in the southwest Pacific Ocean during the last glacial period and deglaciation, Nature, 405, 555– 559, 2000.
Skinner, L., Fallon, S., Waelbroeck, C., Michel, E., and Barker, S.: Ventilation of the deep
South-10
ern Ocean and deglacial CO2rise, Science, 328, 1147–1151, 2010.
Sloyan, B. M. and Rintoul, S. R.: Circulation, renewal, and modification of Antarctic Mode and Intermediate Water, J. Phys. Oceanogr., 31, 1005–1030, 2001.
Sortor, R. N. and Lund, D. C.: No evidence for a deglacial intermediate water∆14C anomaly in
the SW Atlantic, Earth Planet. Sc. Lett., 310, 65–72, 2011.
15
Southon, J., Kashgarian, M., Fontugne, M., Metivier, B., and Yim, W. W. S.: Marine reservoir corrections for the Indian Ocean and Southeast Asia, Radiocarbon, 44, 167–180, 2002. Spero, H. J. and Lea, D. W.: The cause of carbon isotope minimum events on glacial
termina-tions, Science, 296, 522–525, 2002.
Stephens, B. B. and Keeling, R. F.: The influence of Antarctic sea ice on glacial–interglacial
20
CO2variations, Nature, 404, 171–174, 2000.
Stott, L., Southon, J., Timmermann, A., and Koutavas, A.: Radiocarbon age anomaly at inter-mediate water depth in the Pacific Ocean during the last deglaciation, Paleoceanography, 24, PA2223, doi:10.1029/2008PA001690, 2009.
Thornalley, D. J. R., Elderfield, H., and McCave, I. N.: Intermediate and deep water
paleo-25
ceanography of the northern North Atlantic over the past 21 000 years, Paleoceanography, 25, PA1211, doi:10.1029/2009PA001833, 2010.
Thornalley, D. J. R., Barker, S., Broecker, W. S., Elderfield, H., and McCave, I. N.: The deglacial evolution of North Atlantic deep convection, Science, 331, 202–205, 2011.
Visser, K., Thunell, R., and Stott, L.: Magnitude and timing of temperature change in the
Indo-30
CPD
9, 4035–4063, 2013Deglacial Intermediate Water
reorganization
S. Romahn et al.
Title Page
Abstract Introduction
Conclusions References
Tables Figures
◭ ◮
◭ ◮
Back Close
Full Screen / Esc
Printer-friendly Version Interactive Discussion
Discussion
P
a
per
|
D
iscussion
P
a
per
|
Discussion
P
a
per
|
Discuss
ion
P
a
per
|
Weldeab, S., Schneider, R. R., and Kölling, M.: Deglacial sea surface temperature and salinity increase in the western tropical Atlantic in synchrony with high latitude climate instabilities, Earth Planet. Sc. Lett., 241, 699–706, 2006.
Wyrwoll, K.-H., Dong, B., and Valdes, P.: On the position of Southern Hemisphere westerlies at the Last Glacial Maximum: an outline of AGCM simulation results and evaluation of their
5
implications, Quaternary Sci. Rev., 19, 881–898, 2000.
Xie, R. C., Marcantonio, F., and Schmidt, M. W.: Deglacial variability of Antarctic Intermediate Water penetration into the North Atlantic from authigenic neodymium isotope ratios, Paleo-ceanography, 27, PA3221, doi:10.1029/2012PA002337, 2012.
You, Y.: Intermediate water circulation and ventilation of the Indian Ocean derived from
water-10
mass contributions, J. Mar. Res., 56, 1029–1067, 1998.
Zahn, R. and Stüber, A.: Suborbital intermediate water variability inferred from paired benthic foraminiferal Cd/Ca and δ13C in the tropical West Atlantic and linking with North Atlantic climates, Earth Planet. Sc. Lett., 200, 191–205, 2002.
Zhang, J., Quay, P., and Wilbur, D.: Carbon isotope fractionation during gas–water exchange
15
and dissolution of CO2, Geochim. Cosmochim. Ac., 59, 107–114, 1995.
Ziegler, M., Diz, P., Hall, I. R., and Zahn, R.: Millennial-scale changes in atmospheric CO2levels linked to the Southern Ocean carbon isotope gradient and dust flux, Nat. Geosci., 6, 457– 461, 2013.
CPD
9, 4035–4063, 2013Deglacial Intermediate Water
reorganization
S. Romahn et al.
Title Page
Abstract Introduction
Conclusions References
Tables Figures
◭ ◮
◭ ◮
Back Close
Full Screen / Esc
Printer-friendly Version Interactive Discussion
Discussion
P
a
per
|
D
iscussion
P
a
per
|
Discussion
P
a
per
|
Discuss
ion
P
a
per
SAMW
AAIW SAF
STF
PF
GeoB12615-4 446 m
WIND 28K thermocline depth NIOP905 1580 m
RC27-14 / RC27-23 596 / 820 m
SEC
Fig. 1.Location map of sediment core records from the Indian Ocean discussed in this paper.
CPD
9, 4035–4063, 2013Deglacial Intermediate Water
reorganization
S. Romahn et al.
Title Page
Abstract Introduction
Conclusions References
Tables Figures
◭ ◮
◭ ◮
Back Close
Full Screen / Esc
Printer-friendly Version Interactive Discussion
Discussion
P
a
per
|
D
iscussion
P
a
per
|
Discussion
P
a
per
|
Discuss
ion
P
a
per
|
0 5 10 15 20 25 30 35
age in kyr BP 100
200
300
400
500
600
depth (cm)
53.0 cm/kyr
32.2 cm/kyr
47.0 cm/kyr
41.7 cm/kyr
22.2 cm/kyr
69.6 cm/kyr
40.4 cm/kyr
23.4 cm/kyr 10.8 cm/kyr
9.3 cm/kyr 7.3 cm/kyr
7.6 cm/kyr 3.1 cm/kyr
3.4 cm/kyr
Fig. 2.Age–depth relationship of core GeoB12615-4, including linear sedimentation rates and
calibrated radiocarbon ages with error bars
CPD
9, 4035–4063, 2013Deglacial Intermediate Water
reorganization
S. Romahn et al.
Title Page Abstract Introduction Conclusions References Tables Figures ◭ ◮ ◭ ◮ Back Close
Full Screen / Esc
Printer-friendly Version Interactive Discussion Discussion P a per | D iscussion P a per | Discussion P a per | Discuss ion P a per B-A -44 -42 -40 -38 -36 ( 0/ 00 ) -2.5 -2 -1.5 -1 -0.5 δ
18O planktic ( 0/
00
VPDB)
0 5 10 15 20 25 30 35 40
age in kyr BP
0 5 10 15 20 25 30 35 40 age in kyr BP
-10 -5 0 5 EPICA temperature (°C ) 0.8 1 1.2 1.4 1.6 δ
13C benthic ( 0/ 00 VPDB) 1 1.5 2 2.5 δ
18O benthic ( 0/00
VPDB) 25 26 27 28 29 30 SST (°C) 0.6 0.8 1 1.2 1.4 δ
13C planktic ( 0/ 00 VPDB) YD H1 ACR a) b) c) d) e) f) g) 3.5 4 4.5 5 5.5 Mg/Ca (mmol/mol) NGRIP δ 18 O
Fig. 3.Comparison of ice core records with data of GeoB12615-4 spanning the last 40 kyr.
(a) NGRIP stable oxygen isotopic record (Andersen et al., 2004). (b) δ18Oplanktic record of GeoB12615-4 in % VPDB. (c) δ13C
planktic record of GeoB12615-4 in % VPDB. (d)
Shell Mg/Ca ratio of planktic foraminifera in mmol mol−1
and reconstructed SST record of GeoB12615-4 in◦C.(e)δ13Cbenthicrecord of GeoB12615-4 in %VPDB.(f)δ18O
benthicrecord of
GeoB12615-4 in %VPDB.(g)EPICA Dome C ice core temperature estimates (Jouzel et al.,
CPD
9, 4035–4063, 2013Deglacial Intermediate Water
reorganization
S. Romahn et al.
Title Page
Abstract Introduction
Conclusions References
Tables Figures
◭ ◮
◭ ◮
Back Close
Full Screen / Esc
Printer-friendly Version Interactive Discussion
Discussion
P
a
per
|
D
iscussion
P
a
per
|
Discussion
P
a
per
|
Discuss
ion
P
a
per
|
-200 -100 0 100 200 300 400
C (
⁄
)
0.9 1 1.1 1.2 1.3 1.4 1.5 1.6
C benthic ( VPDB)
⁄
RC27-14 14C (596 m)
RC27-23 14C (820 m)
GeoB12615-4 δ13C (446 m)
H1
YD EH
ACR
6 8 10 12 14 16 18 20 22 24
age in kyr BP
Fig. 4.Comparison of 4 and sediment records from the Arabian Sea.
GeoB12615-4:δ13Cbenthic record in % VPDB (green). Arabian Sea RC27-14 and RC27-23: intermediate water∆14C as a measure for ventilation age.
CPD
9, 4035–4063, 2013Deglacial Intermediate Water
reorganization
S. Romahn et al.
Title Page
Abstract Introduction
Conclusions References
Tables Figures
◭ ◮
◭ ◮
Back Close
Full Screen / Esc
Printer-friendly Version Interactive Discussion
Discussion
P
a
per
|
D
iscussion
P
a
per
|
Discussion
P
a
per
|
Discuss
ion
P
a
per
0 2 4 6 8 10 12 14 16 18 20 22 24 26 28 30 32 34 36 38 40
age in kyr BP 26
27 28 29 30 31
SST
(°C)
0.4 0.6 0.8 1 1.2 1.4 1.6
C benthic (
⁄
VPDB)
ACR H1
YD EH
Fig. 5.Comparison ofδ13Cbenthicrecord in %VPDB (green) and SST record based on shell
Mg/Ca ratio of planktic foraminifera in◦C (pink) of GeoB12615-4. EH, YD, ACR and H1 indicate
CPD
9, 4035–4063, 2013Deglacial Intermediate Water
reorganization
S. Romahn et al.
Title Page
Abstract Introduction
Conclusions References
Tables Figures
◭ ◮
◭ ◮
Back Close
Full Screen / Esc
Printer-friendly Version Interactive Discussion
Discussion
P
a
per
|
D
iscussion
P
a
per
|
Discussion
P
a
per
|
Discuss
ion
P
a
per
|
age in kyr BP
0 2 4 6 8 10 12 14 16 18 20 22 24
-7 -6.8 -6.6 -6.4 -6.2
Monte Carlo
A
verage of
C atm
0.8 1 1.2 1.4 1.6
C benthic
(
0/
00
VPDB)
Fig. 6.Comparison of benthic carbon isotope record of GeoB12615-4 in %VPDB (green) and
Ice core reconstructions of atmosphericδ13C (δ13Catm) for the last 24 kyr (yellow, Schmitt et al., 2012).
CPD
9, 4035–4063, 2013Deglacial Intermediate Water
reorganization
S. Romahn et al.
Title Page
Abstract Introduction
Conclusions References
Tables Figures
◭ ◮
◭ ◮
Back Close
Full Screen / Esc
Printer-friendly Version Interactive Discussion
Discussion
P
a
per
|
D
iscussion
P
a
per
|
Discussion
P
a
per
|
Discuss
ion
P
a
per
0 2 4 6 8 10 12 14 16 18 20 22 24
age in kyr BP
0.2 0.4 0.6 0.8
-0.4 -0.2 0 1 1.2
0.6 0.8 1 1.2 1.4 1.6
C benthic ( VPDB)
ACR YD
EH
NIOP905 (1580 m) GeoB12615-4 (446 m)
H1
C benthic ( VPDB)
Fig. 7.Comparison of benthic carbon isotope records. GeoB12615-4 (green) and NIOP905