Threshold Prediction of a Cyclostationary
Feature Detection Process using an
Artificial Neural Network
PRINCE ANAND A#1, R.SARAVANAN#2, R.MUTHAIAH#3
School of Computing, M.Tech VLSI design, SASTRA University Thanjavur, Tamil Nadu, 613401, India
#1 inbox.prince2@gmail.com #2 saravanan23378@gmail.com #3 sjamuthaiah@core.sastra.edu
Abstract—Sensing of spectrum holes in a frequency spectrum is one of the important concepts in implementing a cognitive radio system. Cognitive radio provides a way to use the band width effectively and efficiently by identifying the spectrum holes in a particular spectrum. The presence of cyclostationary features indicates the absence or presence of primary users. The presence of signal or noise can be determined by calculating the threshold of a signal by using cyclic cross-periodogram matrix of the corresponding signal. To circumvent the difficulty in estimating the accurate threshold (statistical techniques were used by other researchers), an artificial neural network has been trained by extracted cyclostationary feature vectors which have been obtained by FFT accumulation method. 70% of extracted data has been used for training and the rest 30% has been used for testing the efficiency of the network in estimating 99% accurate prediction of the threshold. The regression plot clearly indicates the superiority of the proposed scheme in estimating the threshold. Similar threshold samples derived from the data (other samples) have also been experimented in this scheme, which provided consistently good results with reduced MSE.
Keyword-Cognitive radio, Spectrum sensing, Cyclostationary feature detection, FFT accumulation method, Cyclic cross periodogram, Threshold, Artificial neural network.
I. INTRODUCTION
Cognitive radio is viewed as an intelligent way of utilizing the spectrum efficiently depending on the environment[1][2]. Spectrum sensing serves to be the most important part in implementing a cognitive radio system. The method followed to sense the frequency spectrum must maintain accuracy. Wireless signals are subjected to many forms of distortion and disturbances depending on the factors like distance, transmission medium and so on. These types of distortions and noises tend to lower the ratio of signal to noise(SNR). So when the signal is sensed at any point, depending on the factors which has affected the signal, the signal exhibits low SNR. Cyclostationary feature detection process is one of the ways to detect the absence or presence ofa particular signal effectively even when the signal exhibits low SNR[1][8][10].Cyclostationary process is defined as a random processfor which statistical properties like mean, autocorrelation changes periodically with time [1][3]. These processes are normally caused by modulation, coding or can be inserted for information recovery [11]. The cyclostationary features in a particular signalalways exhibits regenerative periodicity which is considered as one of its characteristic property [6]. There are mainly two types of methods used to realize cyclostationary feature detection[1].
1) FFT Accumulation Method (FAM).
2) Striped Spectrum Correlation Method (SSCM).
Both FFT accumulation method and striped spectral correlation methods will produce results in the form of a matrix which represents time smoothed cyclic cross periodogram. The cross periodogram contains values in which each value represent theamount of correlation corresponding to the signal. This matrix is used to determine whether the input which was given to the detector is a signal or noise. The size of the matrix may vary depending on the sampling rate and the cyclic frequency resolution.
cross periodogram of a cyclostationary feature detection process which uses a discrete samples of signal as an input.
II. FFT ACCUMULATION METHOD (FAM)
The main challenge in cognitive radio system is to use the spectrum in an opportunistic manner is to identify the spectrum holes which are not occupied by licensed users [3][4]. The FFT accumulation method is one of the method which can be used to estimate the cyclic frequency spectrum. The method requires very long detection time [10] and undergoes a sequence of complex steps to produce the correlationof cyclic periodogram which is represented by [7]. If the signal is cyclostationary, it will represented in the cyclic periodogram as a cyclic autocorrelation function which is non-zero at non-zero cyclic frequency [1][9]. Using the periodogram matrix the threshold is calculated and that threshold is used to sense the presence of primary user. Fig. 1 shows a general architecture of FFT accumulation method.
Fig 1. Architecture of FFT Accumulation method
The method is based on the modification time smoothed cyclic cross periodogram which can be given by
lim ∑ , , (1)
The and are the two components of the equation which represent the complex envelopes of the of the cyclic cross periodogram.
, ∑
′
′ (2)
, ∑
′
′ (3)
Decision to determine whether the input is a signal or a noise can be made by calculating the threshold using the matrix. The threshold metric is given by
(4)
Where the average is value of the pilot subcarriers and is the average value of the data subcarriers.
If then the signal is not present which can be represented by . If then the signal is present which can be represented by .
Where is a constant which decide the presence and the absence of a signal.
III. ARTIFICIAL NEURAL NETWORK (ANN)
ANN is a network which consists of collection of neurons interconnected in a specific manner to emulate the function of a human brain [16]. ANN was used for many applications including prediction of spectrum holes [15]. The ANN uses an activation function at each output of a neuron in the neural network which makes it artificial. It consist of three layers and they are classified into a single input layer, any number of hidden layers and a single output layer [12].
The number of inputs in the input layer depends on the number of inputs we use in an actual system which is to be realized by an ANN. There can be any number of hidden layer and each hidden layer may contain any number of neurons depending on the application we use. Each interconnection between neurons takes a value called weight. During the learning or reasoning mode of an ANN the weights tends to change. The weights are changed by implementing some learning algorithm. The general goal of the learning algorithm is to reduce error and to make the neural network to learn effectively using the inputs and the targets [12]. There are many types of learning algorithms and each of them is used for different purpose and for different data sets.
Fig 2. General representation of a neuron which includes its inputs, weights and activation function.
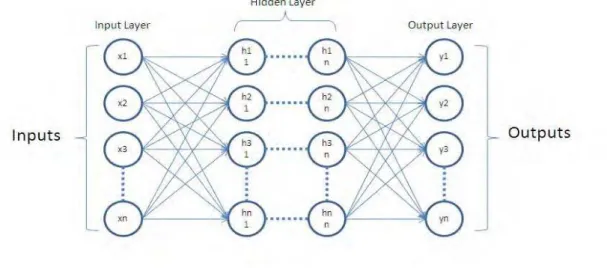
Fig 3. General representation of an artificial neural network which includes n number of input,hidden and output layers
neuron in the preceding and the succeeding layer which means if we take the hidden layer for example it is connected to all the neurons in the input layer for its input and all the neurons in the output layer to feed its output as input for the output neuron.To reduce the error, back propagation algorithm were used to change the weights which are initialized in a random manner [16].
Error can be calculated by using the following procedure
∑ (5)
∑ (6)
Where represents the summation of all the errors and represents the error due to single output and corresponding target .
The weights are updated by using the following method.
∆ (7)
∆ (8)
Where ∆ represents the change in weight of the th connection corresponding to the input and is the value of the old weight. represents the learning rate [12] involved in calculation of weight change.
IV. PREDICTION OF THRESHOLD USING ANN
For predicting the threshold of a signal, an artificial neural network was used with average value of pilot and data subcarriersobtained from the cyclic cross periodogram as inputs and threshold calculated using equation 4 as outputs. However the cyclic coss periodogram was obtained by executing the FFT accumulation method with IEEE 802.11a signal as its input. The IEEE 802.11a is a wireless standard with an operating frequency of 5GHz [14]. It uses 52 subcarrier OFDM and its maximum data rate is 54Mbps. The signal exibit periodicity which has been introduced intentionally [1][5][11].The input which was used for ANN is the average value of pilot and data subcarriers obtained from the cyclic cross periodogram which is the output of the FFT accumulation method. The ANN is trained with the average value of pilot and data subcarriers as inputs and the calculated value of threshold as outputs.
The signal format IEEE 802.11a can be represented in a form of equation which is given by
(9)
Where represents the complex baseband OFDM signal and is the carrier center frequency [1]. An OFDM(Orthogonal Frequency division multiplexing) is a multi-carrier modulation technique which is commonly denoted as MCM [13]. This modulation technique was successful in man y applications of digital communication.
The OFDM signals used in this scheme for the input to FAM contains 64 sub-carrier in which 52 of them contains pilot and data subcarriers. There are 11 guard sub-carriers and 1 DC null. In total there are 64 points IFFT which forms the OFDM signal. The pilot subcarriers are positioned at the index -21,-7,7 and 21 out of 64 subcarriers and the data subcarriers are present at the positions other then pilot subcarriers except at index point 0 which is the DC null. The parameters used for the simulation of FFT accumulation method is given in table 1.
TABLE I
PARAMETERS USED FOR SIMULATING THE FFT ACCUMULATION METHOD(FAM)
PARAMETER VALUE
Modulation 64 QAM OFDM
Band Width 20 MHz
Number of OFDM symbols 80
Number of FFT samples 64 point FFT
Number of Cyclic Prefix 16
.
box.The threshold for each input samples was calculated from the cyclic cross periodogram matrix by using equation (4) repeatedly for different samples of input which is the average value of pilot and data subcarrier.The threshold is calculated for multiple number of input signals and the datas are collected. In this paper 500 different samples of inputs were taken and the threshold for each samples were calculated using equation (4) from the cyclic cross periodogram.Each input samples of 500 different inputs contain average value of pilot subcarriers as one input and average value of data as another input to the neural network.
TABLE II
SAMPLES OF THRESHOLD VALUES CALCULATED FROM CYCLIC CROSS PERIODOGRAM
SIGNAL THRESHOLD
24.424376515061326
35.215478660814860
33.068953568026785
36.247704468706345
44.454736092592460
45.205551129327084
31.254286547506428
The data set collected were seperated into three parts. 70% of the data set were used for training, 15% for validation and 15% for testing. The threshold for some data sets are shown in table 2. These threshold values has been obtained from the cross periodogram generated by the FFT accumulation method for different set of input signal with AWGN of 10dB. The constant c which was used for determination of signal or noise was fixed to be 8. In the table it is shown that all the threshold values are above the constant value c which is 2.
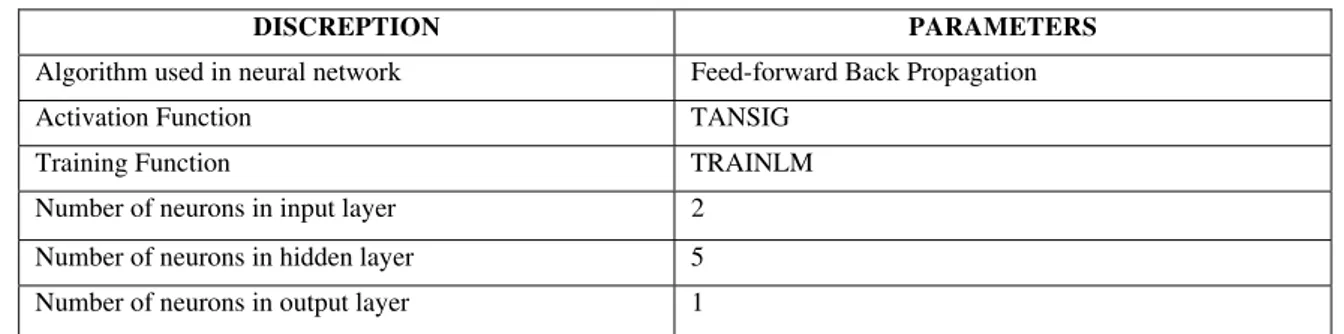
TABLE III
DESCRIPTION OF THE NEURAL NETWORK USED FOR PREDICTING THE THRESHOLD
DISCREPTION PARAMETERS
Algorithm used in neural network Feed-forward Back Propagation
Activation Function TANSIG
Training Function TRAINLM
Number of neurons in input layer 2
Number of neurons in hidden layer 5
Number of neurons in output layer 1
Table 3 shows the specifications of the artificial neural network which was used for predicting the threshold.The number of neurons in the input layer is fixed as 2, since there are 2 real values for each set of input datas representing the average value of pilot and data subcarrier. The output layer contains just one neuron, since there is only one threshold value for each set of datas. The algorithm used to reduce the error in the network is the back propagation algorithm. The error calculated using the target and the output can be used to findout how much the network has learned and correspondingly update the weight associated with each inputs to the neurons. The activation function used for the neural network is a “Tan Sigmoidal” function. The function can be given by
(10)
Fig. 4 represents the the overall process of an artificial neural network which was used for prediction of threshold. As per the specification given in table 3, it is shown that the network has an input layer containing 2 neurons, 5 neurons in the hidden layer and 1 neuron in the output layer. It is also shown that the error E
Fig 4: ANN model used for the prediction of threshold by using a discrete set of signal samples as an input
V. SIMULATION RESULTS
The simulated results are shown in regression plots, representing different modes of an artificial neural network like training, testing and validation. The response of ANN is plotted between output of the network and the target Fig. 4 represent the regression plot for an artificial neural network which was trained using the data sets containing the pilot and data subcarriersas inputs which was obtained from the cyclic cross periodogram and itsthreshold described in equation 4 as targets. Testing and Validation were carried out using the same set of extracted features .
Fig 4. Regression plot of an ANN which was used for predicting the threshold
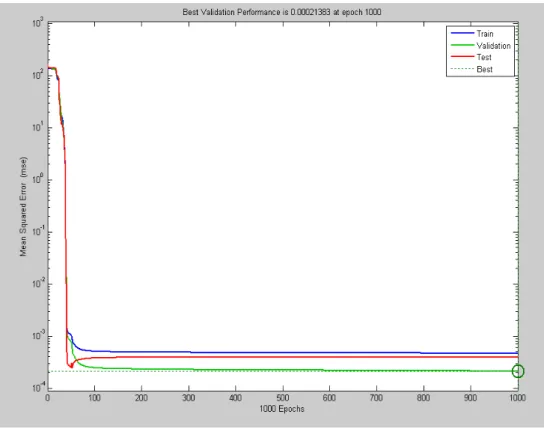
Fig 5. Mean square error vs number of epoch during training, validation and testing
The data sets for the input of the neural network were well conditioned since they were obtained from the cyclic cross periodogram. Fig. 5 shows a plot between mean square error(MSE) and the number of epoch during the training, testing and validation phase. It can be seen that the error reduces drastically upto 50 iterations since the datas were well conditioned indicating that the neural network was able to learn quickly and also was able to produce accurate results. This error plot shows that the error reducesbelow0.001 value indicating the strength of the neural network during the prediction of threshold which is the testing phase.
VII. CONCLUSION
In this paper, features from the cross-periodogram matrix of signal statistics have been used to train an artificial neural network in order to predict the thresholds. To detect the presence of signal or noise, FFT accumulation method has been invoked for extracting sample vectors. The regression plots obtained from the ANN Scheme clearly indicate the strength of the artificial neural network. Future work includes prediction of threshold using data sets of different noise strength to test the effieciency of the neural network schemes and we are planning to implement support vector machine to provide better classification acccuracy for increased noisy data.
REFERENCES
[1] V.Prithiviraj, B. Sarankumar, A. Kalaiyarasan, P. Praveen Chandru, N. NandaKumar Singh, “Cyclostationary Analysis Method of Spectrum Sensing for Cognitive Radio,”Second International Conference Wireless VITAE, pp. 1-5, Feb. 28 2011-March 3 2011. [2] Simon Haykin, “Cognitive Radio: Brain-Empowered Wireless Communications,” IEEE journal on selected areas in communications,
vol. 23, no. 2, pp. 201-220, Feb. 2005.
[3] TevfikY¨ucek and H¨useyinArslan, “A Survey of Spectrum Sensing Algorithms forCognitive Radio Applications,” IEEE communications surveys & tutorials, vol. 11, no. 1, pp.116-130, First Quarter 2009.
[4] Danda B. Rawat and Gongjun Yan, “Spectrum Sensing Methods and Dynamic Spectrum Sharing in Cognitive Radio Networks: A Survey,” International Journal of Research and Reviews in Wireless Sensor Networks (IJRRWSN), vol. 1, no. 1, pp. 1-13, March 2011.
[5] DanijelaCabric, ShridharMubaraq Mishra and Robert W. Brodersen, “Implementation Issues in Spectrum Sensing for Cognitive Radios,” Conference record of the thirty-eighth asilomar, vol. 1, pp. 772-776, 7-10 Nov. 2004.
[6] WILLIAM A. GARDNER, “Signal Interception: A Unifying Theoretical Framework for Feature Detection,” IEEE transactions on communications, vol. 36, no. 8, pp.897-906,Aug. 1988.
[7] Paul D. Sutton, Keith E. Nolan and Linda E. Doyle, “Cyclostationary Signatures in Practical Cognitive Radio Applications,” IEEE journal on selected areas in communications, vol. 26, no. 1, pp. 13-24,Jan. 2008.
[8] Hamid Arezumand, PaeizAzmi, and HamedSadeghi, “A Robust Reduced-Complexity Spectrum Sensing Scheme Based on Second-Order Cyclostationarity for OFDM-Based Primary Users,” Nineteenth Iranian Conference ICEE,pp. 1-6, 17-19 May 2011.
[9] ZiadKhalaf, Amor Nafkha, and Jacques Palicot, “Blind cyclostationary feature detector based on sparsity hypothesis for cognitive radio equipment,” IEEE Fifty Fourth International Midwest Symposium MWSCAS, pp. 1-4, 7-10 Aug. 2011.
[10] Kae Won Choi,WhaSookJeon and Dong GeunJeong, “Sequential Detection of Cyclostationary Signal for Cognitive Radio Systems,”
[11] YonghongZeng, Ying-Chang Liang, The-Hanh Pham, “Spectrum Sensing for OFDM Signals Using Pilot Induced Auto-Correlations,”
IEEE journal on selected areas in communications, vol. 31, no. 3,pp. 353-363, Mar. 2013.
[12] Robert Hecht-Nielsen, “Theory of the backpropagation neural network,” International joint conference IJCNN, vol. 1, pp.593-605, 1989.
[13] Yiyan Wu and William Y. Zou, “Orthogonal Frequency Division Multiplexing: A Multi-Carrier Modulation Scheme,” IEEE Transactions on Consumer Electronics, vol. 41, no. 3, pp. 392-399, Aug. 1995.
[14] Abu Nasser M. Abdullah, HajaMoinudeen, Wajdi Al-Khateeb, “Scalability and Performance Analysis of IEEE 802.11a,” Canadian conference Electrical and Computer Engineering,” pp. 1626-1629, 1-4 May 2005.
[15] Vamsi Krishna Tumuluru, Ping Wang and DusitNiyato, “A Neural Network Based Spectrum Prediction Scheme for Cognitive Radio,”
IEEE international conference ICC, pp. 1-5, 23-27 May 2010.