www.hydrol-earth-syst-sci.net/14/2259/2010/ doi:10.5194/hess-14-2259-2010
© Author(s) 2010. CC Attribution 3.0 License.
Earth System
Sciences
Water and nutrient balances in a large tile-drained agricultural
catchment: a distributed modeling study
H. Li1,2, M. Sivapalan1,3,4, F. Tian3,5, and D. Liu3,5
1Department of Civil and Environmental Engineering, University of Illinois at Urbana-Champaign, Urbana, IL 61801, USA 2Pacific Northwest National Lab, Richland, WA 99352, USA
3Department of Geography, University of Illinois at Urbana-Champaign, Urbana, IL 61801, USA
4Department of Water Management, Faculty of Civil Engineering and Geosciences, Delft University of Technology,
Postbus 1048, Stevinweg 1, 2600 GA Delft, The Netherlands
5Department of Hydraulic Engineering, State Key Laboratory of Hydroscience and Engineering, Tsinghua University,
Beijing, 100084, China
Received: 8 June 2010 – Published in Hydrol. Earth Syst. Sci. Discuss.: 28 June 2010 Revised: 24 October 2010 – Accepted: 9 November 2010 – Published: 16 November 2010
Abstract. This paper presents the development and
imple-mentation of a distributed model of coupled water nutrient processes, based on the representative elementary watershed (REW) approach, to the Upper Sangamon River Basin, a large, tile-drained agricultural basin located in central Illi-nois, mid-west of USA. Comparison of model predictions with the observed hydrological and biogeochemical data, as well as regional estimates from literature studies, shows that the model is capable of capturing the dynamics of water, sed-iment and nutrient cycles reasonably well. The model is then used as a tool to gain insights into the physical and chemical processes underlying the inter- and intra-annual variability of water and nutrient balances. Model predictions show that about 80% of annual runoff is contributed by tile drainage, while the remainder comes from surface runoff (mainly sat-uration excess flow) and subsurface runoff. It is also found that, at the annual scale nitrogen storage in the soil is depleted during wet years, and is supplemented during dry years. This carryover of nitrogen storage from dry year to wet year is mainly caused by the lateral loading of nitrate. Phosphorus storage, on the other hand, is not affected much by wet/dry conditions simply because the leaching of it is very minor compared to the other mechanisms taking phosphorous out of the basin, such as crop harvest. The analysis then turned to the movement of nitrate with runoff. Model results sug-gested that nitrate loading from hillslope into the channel is preferentially carried by tile drainage. Once in the stream
Correspondence to:H. Li
it is then subject to in-stream denitrification, the significant spatio-temporal variability of which can be related to the variation of the hydrologic and hydraulic conditions across the river network.
1 Introduction
areas of prairie grasses along tributary streams (David et al., 1997; Rhoads and Herricks, 1996).
The interactions and feedbacks between these subsystems that occur at all scales, however, are poorly understood, inad-equately observed, and extremely complex. The gaps in our knowledge and understanding of these interacting processes limit our ability to make robust predictions and provide a solid basis for sustainable watershed management. Under-standing the interactions between various water and biogeo-chemical processes is also important in the wider context of climate change and human induced land use and land cover changes, with suggestions that the hydrological cycle may be accelerating as a result. A coupled modeling framework of these subsystems may open new opportunities for studying interacting hydrological and biogeochemical processes, con-tributing significantly towards improved predictive capabil-ity. The move towards such a coupled modeling framework is also motivated by the fact that many of the interacting nat-ural processes cannot be observed directly – instead we are only able to observe spatial and temporal patterns of signa-tures arising from the process interactions. A pattern dynam-ical approach that is focused on the identification of internal process interactions on the basis of spatio-temporal patterns of outcomes is an emerging paradigm towards making robust predictions. Such an approach has to be facilitated by a com-bination of data mining and modeling analysis.
There are quite a few well known models for the coupled hydrological and biogeochemical processes, such as AN-SWERS (Beasley et al., 1977), CREAMS (Knisel, 1980), EPIC (Jones et al., 1984), SWRRB (Williams et al., 1985), HSPF (Donigian et al., 1995), AGNPS (Young et al., 1995), and SWAT (Arnold and Allen, 1996). Some of them, however, are limited to small scale studies (for example, EPIC, CREAMS, AGNPS) and thus not appropriate for large watershed scale applications. Some of them have over-simplified underlying hydrological structures (for example, ANSWERS, SWRRB, HSPF), which prevents deep insight into the role of hydrological processes (especially runoff gen-eration processes). Some of them require intensive parame-ter calibration, such as SWAT. The coupled hydrological and biogeochemical process model presented here has its founda-tion in the distributed watershed model, THREW, based on the representative elementary watershed (REW) approach pi-oneered by Reggiani et al. (1998, 1999, 2000). The THREW model has been designed for macro-scale applications. Its hydrological representation is comprehensive enough for this study, including all key processes contributing to the com-plex hydrological responses of watersheds. Also, the pasi-monious parameter set and scale-consistent spatial organiza-tion of THREW decrease the calibraorganiza-tion requirement relative to other process based models (Lee et al., 2005, 2007; Tian et al., 2006, 2010; Li et al., 2010).
The work on this paper has been especially motivated by the combination of biophysical (e.g. a plentiful supply of summer rains, and fertile, deep glacial till soils) and
social factors (e.g. intensive agricultural advisory services, land use and conservation strategies, and advanced precision-agriculture technologies) that have made the US Mid-West the Nation’s breadbasket, albeit with considerable local and remote environmental impacts, such as contributing to eu-trophication problems in the Gulf of Mexico. Despite the importance of this region both in terms of agricultural pro-ductivity and as a contributor to the environmental problems faced by the Nation, there are still critical knowledge gaps about the complex interactions among the various interacting processes that contribute to local and regional water quality impacts.
In this study we have extended THREW to include the ef-fects of tile drains, which is a major human modification to this agricultural landscape. More importantly, we have ex-tended THREW further to include modules for the interac-tions between water flow processes and processes associated with the generation of both sediments and nutrients (N and P) after previously published work (Viney and Sivapalan, 1999; Viney et al., 2000). The combined model is then applied to Upper Sangamon River Basin (USRB), a 3600 km2 tile-drained agricultural catchment located in south-central Illi-nois, and calibrated on the basis of all available water quality data, including regional summaries. The model is then used to generate insights into the process interactions underlying the observed and model-generated spatio-temporal patterns.
The paper is organized as follows: Sect. 2 describes the distributed computational framework of coupled hydrolog-ical and biogeochemhydrolog-ical processes at the catchment scale. Section 3 provides the background information on the case study area and data sources. Section 4 lays out the model application results for the water and nutrient modeling, fol-lowed by discussion on the hydrological and biogeochemical process interactions. Section 5 closes with the summary.
2 Model description
2.1 A spatially distributed hydrological model
.
(b) (a)
Fig. 1.Spatial delineation in THREW model.(a)A basin is divided into a number of representative elementary watersheds (REW).(b)Each REW is further divided into several sub-zones.
and the accompanying exchanges of mass, momentum, en-ergy etc. that occur within the REW. Although the REW has an explicit and invariant boundary, the boundaries between the sub-zones are mostly varying with time (Lee et al., 2005, 2007; Tian, 2006; Tian et al., 2006). In the latest version of THREW the sub-zones are the saturated zone (s-zone), the unsaturated zone (u-zone), the vegetated zone (v-zone), the bare soil zone (b-zone), the snow covered zone (n-zone), the glacier covered zone (g-zone), the sub-stream network (t-zone), and the main channel reach (r-zone), as shown in Fig. 1. To adequately capture the vertical movement of water and nutrient within soil column, the unsaturated zone is fur-ther divided into two layers, the upper unsaturated zone (u1
-zone) and the lower unsaturated zone (u2-zone). The depth of
theu1-zone is usually fixed (for example, at 0.3 m), and that
ofu2-zone is allowed to vary with the water table. The
en-semble of REWs constituting the watershed also interact with each other by way of exchanges of mass, momentum and en-ergy through the inlet and outlet sections of the associated channel reaches. The mass, energy and momentum balances within the individual zones within the REW, and between the REWs, are described using a coupled set of ordinary differ-ential equations (ODE), derived from thermodynamic princi-ples (mass conservation, Newton’s laws of motion, 2nd Law of Thermodynamics) by averaging, with a minimum num-ber of simplifying assumptions. These coupled set of ordi-nary differential equations, together with appropriate closure relations and geometric relations, are the equation set that
lies at the heart of the numerical implementation of REW approach. They can be solved using an appropriate numer-ical algorithm, such as the CVODE solver (please refer to http://www.llnl.gov/casc/sundials/) currently adopted in the THREW model. Details of THREW, including the various (mass and force) balance equations, as well as the details of the constitutive and closure relations, are not presented here for reasons of brevity. These are available in several previous publications (Tian et al., 2006, 2010; Mou et al., 2008).
and shallow groundwater (and if needed deep groundwater as well), which help facilitate inclusion of various types of nu-trients; in turn this makes it possible to examine how and to what degree different components of the hydrologic cycle are interacting with different components of the biogeochemical cycles.
2.2 Extension to agricultural basins: tile drainage
Although THREW has been applied to a number of basins in China, US and Europe under various climate and land-scape conditions, it has not been applied to an agricultural basin with extensive tile drains, as we have in the US Mid-West. Field studies suggest that tile drainage, where it exists, is usually a very important source of streamflow (Algoazany et al., 2007; Goswami, 2006). It is thus necessary to incor-porate the process of tile drainage for successful prediction in these agricultural basins.
Tile drainage is an artificial way to remove excess surface and subsurface water from the water-logging land to enable crop growth (Ritzema, 1994). In the mid-west of US, tile drains have been laid out under swamps and wetlands to de-plete the soil water in the saturated zone, and to maintain the water table to an acceptable level to facilitate agricul-tural production. There have been numerous studies on tile drainage, and various modeling approaches have been pro-posed such as the classical Hooghoudt equation (Hooghoudt, 1940), Kirkham equation (Kirkham, 1958), Ernst equation (Ernst, 1956). Most of these drainage equations are derived based on the Dupuit-Forchheimer assumptions. However, these equations require the exact locations of the tile drains, which are not often available and, moreover, how their ef-fects up-scale to the watershed or REW scale is also not well quantified. Therefore, in this paper we opt for a conceptual description of their drainage effects, in combination of REW-scale effective parameters. In fact, the efficiency of tile drains is governed by the subsurface water storage, i.e., the higher the water table is, the faster the saturated soil water is de-pleted through the tile drains. It is thus not unreasonable to adopt a simple storage-discharge relation to describe the in-tegrated response of all tile drains present at the REW scale. In this work, we adopt the following conceptual relationship to characterize drainage through tile drains at REW scale:
qtile =
0
α ks[(ys − (Z −ztile))/ztile]β
ys ≤ Z−ztile
ys > Z −ztile (1) whereqtileis the rate of saturated soil water being depleted
to the channel through the tile drains, [m/s], averaged over the local REW area. ksis the saturated hydraulic
conductiv-ity which controls the subsurface flow into tile drains, [m/s].
Zis the total depth of soil column (from ground surface to an impervious layer), [m]. ys is the depth of the saturated
layer from the water table to the impervious layer, [m]. ztile
is the assumed depth of drainage tiles, [m]. α is a dimen-sionless constant which is mainly a function of the hydraulic
NO
PO PI NNH4
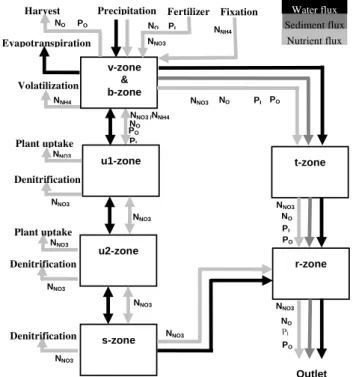
u2-zone u1-zone s-zone r-zone t-zone v-zone & b-zone Outlet Precipitation Evapotranspiration Fertilizer Harvest Sediment flux Nutrient flux Water flux NNO3 NO PO PI NO NNO3 NNO3 NNO3 NO
NNO3 NNO3 NO PO PI PO NNO3 /NNH4 NO PI PO NNH4 Volatilization Fixation NNO3 Denitrification NNO3 Plant uptake NNO3 Plant uptake NNO3 Denitrification NNO3 Denitrification NNO3
Fig. 2.Conceptual illustration of coupled water, sediment and nutri-ent modeling in THREW.PIrepresents inorganic dissolvable phos-phorous.POrepresents organic phosphorous and soil-absorbed in-organic phosphorous. NO is organic nitrogen. NNO3 is nitrate.
NNH4is ammonium.
properties of the tile drain network. β is an exponent pa-rameter subject to the spatial layout of tile drain system. Equation (1) applies when the focus is on the integrated tile drainage response at large scale, and the detailed information about the tile drain system is not available or is incomplete.
2.3 Coupled model of water, sediment and nutrients
The component models for suspended sediments, nitrogen and phosphorus are mostly taken from Viney and Siva-palan (1999) and Viney et al. (2000) with some minor modi-fications, and only brief summaries are presented here. Note that the processes governing suspended sediments, nitrogen and phosphorus are described at the sub-watershed scale, which makes them consistent with the scale at which hydro-logical processes are described within THREW.
The lateral loading of sediments, phosphorus and nitrogen is triggered by surface and subsurface runoff generation and subsequent delivery to river reaches. For instance, the initi-ation (soil erosion) and routing of suspended sediments on hillslopes are driven by the generation and routing of surface runoff. The fluxes of water and different substances are trans-ported across the watershed through a set of REWs, which are organized around the river network (not shown in this figure). Presentations of more detailed process descriptions for phosphorus, nitrogen and suspended sediments that fol-low are adapted from Viney and Sivapalan (1999) and Viney et al. (2000).
2.3.1 Sediment model
The sediment model predicts upslope surface erosion and the in-stream processes of deposition, bank and bed erosion, re-entrainment and settling. The physics and modeling of sed-iments are not the focus in this paper, and will not be de-scribed in detail here., The details of the sediment process description are provided in Viney and Sivapalan (1999) and Liu et al. (2009).
2.3.2 Phosphorus model
The phosphorus model describes the processes of precipita-tion, fertilizaprecipita-tion, plant uptake, residue decay, sorpprecipita-tion, har-vest losses, erosion, surface entrainment and subsurface dis-charge. Most of the phosphorus cycle models proposed in the literature (e.g., Neitsch et al., 2005) separately consider the organic and inorganic stores, which are further subdivided into readily mobilized active pools and slowly changing less accessible stable pools. After Viney et al. (2000), we com-bine the organic and slowly changing and less accessible sta-ble pools into one single pool, and denote it as particulate phosphorus (PP). The readily-mobilized active pools have been combined into another single pool, denoted as dissolv-able phosphorus (DP). Another pool of phosphorus is bio-logical phosphorus. The key components of the phosphorus model are described below. For better understanding of these components and fluxes the readers are referred to Figs. 2 and 6, although the main purpose of Fig. 6 is to show the mass balance of phosphorous.
(i) Phosphorus from rainfall
Precipitation of inorganic phosphorus is assumed to occur at a specified concentration that, for simplicity, is assumed to be constant in time and space. As the surface runoff interacts with the underlying soil, it entrains an amount of soil inor-ganic phosphorus. The resulting entrained phosphorus aug-ments the concentration of phosphorus already being carried by the surface flow.
(ii) Phosphorus from fertilizer
The rate and timing of fertilizer application is determined by many factors, such as climate conditions, crop plantation, and soil properties and so on. The phosphorus from fertilizer, organic and inorganic, is assumed to contribute to the storage of the top soil layer.
(iii) Leaching of phosphorus
Leaching of dissolvable phosphorus to deeper levels in the unsaturated zone and ultimately to the deep groundwater is neglected by the model because phosphorus anions are much more affiliated to soil particles rather than water molecules. While it is not doubted that phosphorus leaching can lead to significant groundwater pollution according to some stan-dards, its effect on streamflow discharges is considered neg-ligible since the primary sources of phosphorus discharge in-volve surface and near-surface processes.
(iv) Residue decay
The processes of leaf fall, crop residue accumulation and lit-ter decay are captured by the single lit-term “residue decay”. For a crop, a fixed proportion of the biomass phosphorus is assumed to contribute to residue decay after harvesting, and the rate is given by
HP = kHPPB (2)
HPshould be regarded as a flux averaged throughout the
lo-cal REW area, [kg/m2/s]. All the nutrient fluxes and stor-age items in the rest of this paper, unless specified, are aver-aged throughout the local REW area, and have the same units [kg/m2/s] or [kg/m2]. kHP is a constant coefficient, [1/s],
which is non-zero during a certain period after harvesting, and zero during the remainder of time.PBis biomassP
ac-cumulated during the growing period, [kg/m2]. For a forested field, the rate of residue decay is assumed to be the same as the rate of plant uptake. The rest of the biomass phosphorus is harvested and exported out, mainly in the form of grain.
(v) Plant uptake
Plant uptake rate of phosphorus is assumed to depend on the rate of canopy biomass accumulation and therefore varies seasonally. This uptake is extracted from the dissolvable (i.e., labile) phosphorus stores provided that there is sufficient sup-ply, and the rate is given by
UP = kUP
dLAI
dt (3)
Plant uptake transfers soluble inorganic P to biomass P. In Eq. (3),kUPis a constant coefficient, [kg/m2]. dLAIdt is the rate
(vi) Mineralization/immobilization and desorption/adsorption
Fluxing between the dissolvable and organic forms is typi-cally achieved through the complementary processes of min-eralization and immobilization, while fluxing between the dissolvable and adsorbed forms is through the processes of desorption and adsorption. Since the organic and adsorbed pools have been combined into a single pool, which we ex-pect to be dominated by the organic component, we could model the net desorption/mineralization flux in term of a sim-ple desorption equation
MP =kMP
1
1 +r (PO −rPI) (4)
wherekMP is a constant coefficient, [1/s],POis the storage
of organic phosphorus, [kg/m2]. PI is the storage of
inor-ganic phosphorus, [kg/m2].ris phosphorus retention index, [−], which is a function of soil type, but in this work a uni-versal value is applied to all soil types for simplicity. It is also assumed that this fluxing does not occur if the soil tem-perature is below zero degree Celsius (Neitsch et al., 2005, p. 190). Note the net desorption/mineralization flux (from the organic phosphorous store) contributes to the inorganic phosphorus store, while the residue decay (from the biomass phosphorous store) contributes to the organic phosphorous store.
(vii) Phosphorus movement with water flux
Due to its low mobility, soluble phosphorus only moves with surface water flux, including infiltration excess runoff and saturation excess runoff, and the lateral loading rate of DP from hillslope into channel is therefore given by
SP = kSPqsPI (5)
wherekSPis a constant coefficient, [1/m], andqsis the lateral
water discharge rate (averaged throughout the local REW area) from hillslope into the channel, [m/s]. During the trans-portation of DP through the river network there is no mineral-ization/immobilization or desorption/adsorption in the chan-nel flow.
(viii) Phosphorus movement with sediment flux
Upslope erosion of organic and adsorbed phosphorus oc-curs in conjunction with surface sediment erosion and is de-pendent on the occurrence and presence of surface runoff. Eroded phosphorus is preferentially attached to the finer sed-iment particles, which in turn tend to be the first eroded. Con-sequently, the concentration of eroded phosphorus decreases as the mass of eroded material increases. In the absence of quantitative information on the concentration of organic and adsorbed phosphorus in the upper layers, the model assumes an enrichment ratio for upslope erosion as a function of the
amount of sediment erosion. The transport of attached nutri-ents with channel flow is not conservative since the exchange of suspended sediment and channel floor is incorporated.
2.3.3 Nitrogen modeling
The nitrogen model has a similar structure to that of phos-phorus. The nitrogen fluxes for plant uptake, harvest/residue decay, surface entrainment and the mobilization and trans-port of particulate nitrogen are modeled analogously to the corresponding phosphorus fluxes, and will not be repeated here (for more details see Viney et al., 2000). The nitrogen modeling, nonetheless, is more complex for a few reasons. One is the need to separately predict NO3-N and ammonium
forms of the dissolvable inorganic component, which neces-sitates the inclusion of an extra flux, nitrification, to account for nitrogen cycling between these two forms. Secondly, un-like phosphorus, nitrogen undergoes gaseous exchange with the atmosphere, and this exchange has to be modeled ex-plicitly through the processes of ammonium volatilization, denitrification and nitrogen fixation. Furthermore, as NO3
-N is highly dissolvable, its leaching to deeper levels in the soil profile is a significant loss mechanism, and an explicit modeling of that process is included. For better understand-ing of these components and fluxes, readers are are referred to Figs. 2 and 7, although the main purpose of Fig. 7 is to present the mass balance of nitrogen.
(i) Atmospheric N fixation
Plant fixation converts atmospheric N (mainly N2) into
am-monia, which is directly utilized by numerous prokaryotes in the soil. Therefore it delivers nitrogen from the atmosphere to the ammonium pool, not to the biomass nitrogen store. The plant fixation rate is modeled as a function of vegetation status.
FN =kFNLAI (6)
kFNis a constant coefficient, [kg/m2/s]. (ii) Nitrification and volatilization
Nitrification transfers ammonium to nitrate when the soil temperature is higher than a certain value, and the rate is given by
JN = kJNNNH4 (7)
kJNis a constant coefficient, [1/s]. NNH4is ammonium
(iii) Field denitrification
The hillslope denitrification process is microbially mediated and occurs primarily in anoxic conditions. In the model, this process is assumed to occur as a fixed proportion of the NO3
-N pool and occurs only if the soil water content is greater than 90% of the saturated soil moisture content and the soil temperature is higher than a certain value (Williams et al., 1984; Neitsch et al., 2005).
GN =
kGNNNO3
0
θ/θs > θc/θs
θ/θs ≤ θc/θs (8)
kGN is a constant coefficient, [1/s]. NNO3 is the storage of
NO3-N in the soil, [kg/m2].θis the soil moisture content.θs
is the saturated soil moisture content. θc is a threshold soil
moisture content. Hereθc/θsis taken as 0.9 after Williams et
al. (1984).
(iv) Nitrogen movement and variation within soil column
Ammonium is easily attracted by negative-charged soil par-ticles, while nitrate is highly mobile. Therefore it is assumed that all nitrate storage is soluble and movable with water. The nitrate storage in the unsaturated soil layer will lose nitrate due to denitrification, plant uptake and leaching, and receive nitrate due to infiltration, nitrification and fertilization. The nitrate storage in saturated soil layer only exchange nitrate with other zones by the way of water flux.
(v) Nitrogen movement with water flux
Nitrate is highly soluble and moves with all types of wa-ter fluxes, including infiltration excess runoff, saturation ex-cess runoff and subsurface flow (or tile drainage). The lat-eral loading of nitrate is simulated similar to that of DP. The transportation of nitrate through the river network is not con-servative, i.e., in-stream denitrification is considered.
(vi) In-stream denitrification
While traveling through the river network, NO3-N is
re-moved due to in-stream denitrification process. After Donner et al. (2004) and Wollheim et al. (2006), the instantaneous fractional removal ratio is defined as
Rr = vf
HL
(9) wherevf is the apparent nutrient uptake velocity [m/s],HL
is the hydraulic load [m/s]. In the THREW model, HL is
estimated as
HL =
h
τ (10)
wherehis the water depth [m],τ is the mean residence time [s] given by
τ = l
v (11)
lis the reach length [m],vis the water velocity [m/s]. Note thatτ is essentially the mean travel time of NO3-N through
the main channel zone (r-zone) within each REW. NO3-N
joins the main channel from mainly two sources: the inflow from upstream channel and lateral loading from the hillslope. For the NO3-N from lateral loading, the mean in-channel
travel time is in fact about half of that of the NO3-N from
upstream inflow. But here it is assumed that the major part of the in-stream NO3-N comes from the upstream inflow. This
assumption is appropriate for large basins.
(vii) Nitrogen movement with sediment flux
The movement of organic and adsorbed nitrogen with sus-pended sediment is simulated similarly to PP.
3 Study area and data
The present modeling study was carried out on the Upper Sangamon River Basin (USRB) in central Illinois, which is representative of the processes and problems associated with agricultural landscapes in the Mid-West region. USRB, with a drainage area of 3600 km2, is an agricultural basin with in-tensive row-crop production. Soil in this basin is dominated by poorly drained silt clay loams and silt loams, which are very fertile due to the high organic content (Demissie and Keefer, 1996). The topography is very flat, with the aver-age slope of the main channel being 0.00049. According to Demissie and Keefer (1996), in 1994, row crops (corn and soybean) covered 85.3% of the whole basin area and grassy crops (small grains and hay) covered 2.4%. Corn and soy-bean almost equally share the row crop land area. The per-centage of area covered by corn is 42.0%, and by soybean is 43.3%, respectively. The biogeochemistry of USRB is altered annually in the spring and fall with widespread yet highly variable applications of nitrogen and phosphorus fer-tilizers. Current land and watershed management practices, such as dredging of channels, produce rapid transmission of nitrogen and phosphorus from the land surface through soils, riparian areas, and small streams to larger streams and rivers. The extensive production of corn and soybeans, substantial inputs of urban wastewater and agricultural runoff, and mod-ification of the drainage network have altered patterns and rates of nitrogen and phosphorus cycling.
Big Ditch
Shively
Monticello
Lake Decatur USRB outlet
Fig. 3. Upper Sangamon River Basin (USRB) and the delineation of REWs.
to examine the spatial variability of water and biogeochemi-cal processes, observations at two locations along the Upper Sangamon River with distinct drainage areas have been cho-sen for this study, namely Big Ditch and Monticello. The upstream drainage area of Big Ditch is about 134.2 km2and of Monticello is about 1379.8 km2.
DEM data with 30 m resolution from the USGS National Elevation Dataset was used to delineate the geometric in-formation, including sub-catchments which are the build-ing blocks of the THREW model and linked by the chan-nel network. Hourly observations of precipitation were ob-tained from National Climate Data Center (NCDC) of Na-tional Oceanic and Atmospheric Administration (NOAA). Hourly stream discharge, irregularly sampled concentra-tion values of suspended sediments, NO3-N, and dissolved
phosphorus were obtained from the long term monitoring project by ISWS (Keefer and Bauer, 2008). Hourly soil temperature data were obtained from the Water and Atmo-sphere Resources Monitoring Program conducted by ISWS. Potential evaporation time series were extracted from the NOAA/NARR dataset. Vegetation data including LAI were downloaded and extracted from MODIS/terra dataset. Soil properties such as porosity and saturated hydraulic conduc-tivity were extracted from the STATSGO database. The study period is from 1 October 1993 to 30 September 2004, and was chosen according to data availability.
The application of nitrogen and phosphorus fertilizers is an important external input to the catchment, which of-ten exhibits high spatial and temporal variability. Empir-ical values of fertilization have been obtained from litera-ture and through personal communication (McIsaac and Hu, 2004; G. McIcsaac, personal communication, 2008). For the sake of simplicity, the application of fertilizers is assumed to be spatially uniform and to be carried out twice a year, the first one during 15 March–1 April, and the next during 1 November–15 November (Hu et al., 2007). In most of the areas corn and soybean are planted in rotation. We assume for simplicity that, in each year, 50% of the field area is corn
and another 50% is soybean. The harvest of both corn and soybean is assumed to occur in mid-September.
4 Results and discussion
4.1 Model application
As shown in Fig. 3, for the implementation of the coupled model, the whole USRB area has been divided into 51 REWs (3600 km2). In this work, nonetheless, the analysis is only fo-cused on the area upstream of Monticello station (1400 km2), which consists of 19 REWs. The coupled model has been run at a 1-h time step.
We divide the whole study period into two parts: a warm-up period, 1 October 1993∼30 September 1994, and a cal-ibration period, 1 Ocoteber 1994∼30 September 2004. We use multiple criteria for calibration. For the water part the criteria include optimal Nash-Sutcliffe coefficient (Nash and Sutcliffe, 1970) and the percent bias (defined as the ratio of the difference between simulated and observed runoff vol-ume to the observed runoff volvol-ume; Ivanov et al., 2004). Some other signatures of temporal variability are also used during the calibration, such as the regime curve and the flow duration curve, in order to improve the fit of model predic-tions to observapredic-tions. For suspended sediments, nitrogen and phosphorus, the calibration has been conducted in order to: (a) satisfy regional mass balances indicated by the empirical data presented in the literature; (b) match the predicted time series to the observed time series as well as possible.
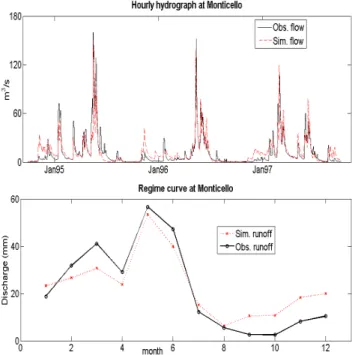
Figure 4 shows simulated and observed streamflow at Monticello station at both the hourly and seasonal scale (i.e., mean monthly streamflows). The results show strong season-ality with two peaks (during winter and spring) and low flows during summer and fall. Comparison between the observed and predicted hydrographs and regime curves suggests that the model captures the variation of streamflow very well at both the hourly and seasonal scale. For the period of 1 Ocote-ber 1994∼30 September 2004, the Nash-Sutcliffe efficiency on the basis of hourly flows is 0.67, and the percent bias is 5%.
Figure 5 shows the model predicted time series of NO3
-N concentrations and dissolved phosphate concentrations (at hourly time step) and the observed time series (at irregular time intervals). We are not presenting the results for sus-pended sediments, due to lack of data to fine tune model, cal-ibrate model parameters and validate model predictions. The temporal variation of NO3-N concentration has been well
captured by the model at both Big Ditch and Monticello. It can be inferred that the NO3-N loads (product of water
dis-charge and NO3-N concentration) has also been satisfactorily
reproduced. On top of this, one might notice that the NO3-N
concentration at Monticello appears to be lower than that at Big Ditch. This decrease of NO3-N concentration from
Table 1.Nitrogen annual balance [Kg N/ha].
Expected Simulated Source/reference
NH4-N Fertilizer 95.0*1 – McIsaac and Hu, 2004
NH4-N Deposition 5.0* – NADP/NTA Bondiville Station (IL11)
NO3-N Deposition 4.8* – NADP/NTA Bondiville Station (IL11)
NH4-N Fixation 51∼621 65.3 McIsaac and Hu, 2004; Hu et al., 2007
NO3-N Field Denitrification 10∼23 10.9 David and Gentry, 2000; Howarth et al., 1996; Hu et al., 2007
NH4-N Volatilization 5.0 4.9 McIsaac and Hu, 2004
NO3-N Riverine Denitrification 5.22 5.8 David and Gentry, 2000; Howarth et al., 1996
NO3-N Riverine Export 25.8 29.1 McIsaac and Hu, 2004
TKN 3.5 3.2 McIsaac and Hu, 2004
Grain Export 116.0 115.8 McIsaac and Hu, 2004
* Model inputs.
1It is assumed that 50% of the study area is planted corn, and another 50% is soybean. NH4-N fertilizer is only applied to the corn field. So this value is in fact half of what will be
applied to a corn field.
2Estimated as 20% of riverine flux.
Fig. 4. Comparison of the model predicted and observed runoff response at Monticello. The regime curves are normalized by the total upstream drainage area of Monticello.
denitrification process, which will be discussed later. As for dissolved phosphorus, the model captures the temporal vari-ation at Big Ditch, but significantly underestimates the con-centration of dissolved phosphorus at Monticello, especially in the summer and fall seasons. A possible explanation for this under-estimation is the effluent discharge from the ur-ban areas between Big Ditch and Monticello, including the towns of Mahomet and Monticello. Effluent from the local sewer system and wastewater treatment plants is discharged
into the Sangamon River, which introduces non-negligible amounts of nutrients into the river, especially phosphorus. Dissolved phosphorus from effluent discharge, in the form of point-source pollution could make a significant contribution to the in-stream concentrations of phosphorus in the sum-mer and fall seasons. Due to lack of reliable observation data, nutrient inputs through effluent discharges are not in-cluded in the current version of the model. This might have led to the poor prediction of dissolved phosphorous from the model. The amount of nitrogen such as nitrate from efflu-ent discharge is rather small compared to the other sources contributing to the channel, so its impact on the nitrate con-centration is insignificant.
As mentioned before, model calibration involved not only comparisons of model predicted against observed time series within the USRB, but also checks of broad measures of water and nutrient balances (regional space scale and annual time scale) against published estimates from Illinois region, to en-sure that model predictions are consistent. Tables 1 and 2 present a comparison of various aspects of regional nitrogen and phosphorus balances between model predictions within USRB and regional estimates obtained from the literature (McIsaac and Hu, 2004; Hu et al., 2007; David and Gentry, 2000; Howarth et al., 1996; Gentry et al., 2009), demonstrat-ing reasonable consistency in both N and P predictions.
Table 2.Phosphorous annual balance [Kg P/ha].
Expected Simulated Source/reference
P2O5-P Fertilizer 30∗ – Greg McIsaac (personal communication, 2008 PO4-P Deposition 0.04∗ – NADP/NTA Bondiville Station observation (IL11) DP Riverine Export 0.3∼0.55 0.30 Gentry et al., 2007; David and Gentry, 2000 PP Riverine Export 0.3∼0.55 0.31 Gentry et al., 2007 ; David and Gentry, 2000 Grain Export 28.9∼29.4∗∗ 29.6
∗Model inputs.
∗∗Estimated according to mass balance.
Fig. 5.Comparison between the predicted and observed nitrate and phosphate concentration series. The simulated NO3-N and DP concen-tration series are at hourly scale; while the observed series are at irregular intervals, most biweekly. There is no observation some time.
internal processing (plant uptake, generation of plant residue and mineralization), which are included in the model in con-ceptual form (see Viney et al., 2000 for details). The picture is very different and more complex in the case of N, where in addition to fertilizer application (95 kg N/ha/yr) in the form of ammonia, there is in addition large amount of fixation by plants (65 kg N/ha/yr), and small amount of precipitation (10 kg N/ha/yr). The resulting total inputs (170 kg N/ha/yr)
Biomass
P
Organic/
adsorbed
Soluble
P
Precipitation Fertilization Harvest Plant Residue Net mineralizationErosion Runoff
29.6
12.7
12.2
43.0
30.0 0.04
0.5 0.3
cip
n st
n n
ff n
n
Fig. 6.Simulated phosphorous cycling (all values are in Kg P/ha/yr, averaged through the drainage area of Monticello station).
to nitrate through nitrification and from nitrate into nitrogen through denitrification, as well as plant uptake and genera-tion of plant residue. These processes are of course included in the model in conceptual form (see Viney et al., 2000 for details). Knowledge of these relative estimates is extremely useful for targeting future research towards understanding and quantifying key components of the annual nutrient bal-ances, and associated process controls.
4.2 Multi-scale interactions between water and nutrient
cycling processes
In spite of the average water and nutrient balances presented in Figs. 6 and 7, there is considerable temporal (and spatial) variability in the nutrient mass balances, which are intimately related to climatic and hence hydrological variability at mul-tiple time scales. The coupled model predictions are next used to throw light on these interactions, and the resulting temporal patterns.
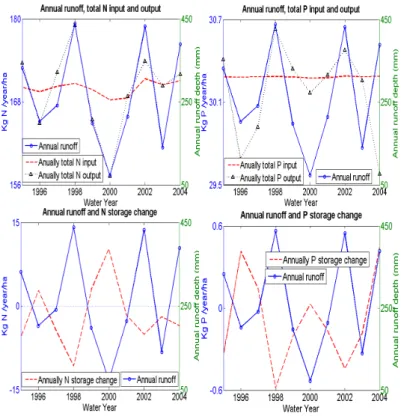
Figure 8 shows the relationship between the annual runoff and annual mass balance of nitrogen and phosphorus at the basin scale. Annual runoff depth is a hydrological indicator and is itself a result of the interactions between variability in climatic forcing and landscape properties. Roughly, the wetter the climate (due to more precipitation or less evapo-rative energy) is, the larger the annual runoff depth. There-fore the annual runoff depth can be regarded as a first or-der indicator of the inter-annual variability of wet/dry con-ditions, recognizing that some of the inter-annual variabil-ity of runoff could be caused by variabilvariabil-ity in intra-annual variability of climate forcing. In Fig. 8, annual balance of nitrogen and phosphorus is expressed in terms of total an-nual mass brought into the basin, total anan-nual mass exported out of the basin, and annual storage change within the basin. The results presented in Fig. 8 show that total nitrogen inputs,
Biomass
Organic NH4-N
Precipitation Fertilization Harvest Plant Uptake Residue Net mineralization
Erosion Erosion
NO3-N Surface runoff Denitrification Nitrification Volatilization Fixation Subsurface runoff 115.8 49.6
4.9 45.3
65.3 95.0 4.9 0.2 206.1 166.6 10.9 4.8 5.0
0.7 31.3 0.2
Tile drainage
Fig. 7. Simulated nitrogen cycling (all values are in Kg N/ha/yr, averaged through the drainage area of Monticello station).
dominated by fertilizer and plant fixation, do not show a sig-nificant relationship with annual runoff. Although annual precipitation clearly impacts annual runoff, the concentration of nitrogen in the precipitation is small, so the annual mass of deposition through precipitation is negligible compared to the corresponding amounts of fertilizer application and plant fixation. Fertilizer application is human related, and is as-sumed constant in this study. Plant fixation is a function of nutrient storage and the growing status of the crops, and does lead to significant inter-annual variability of the annual ni-trogen inputs. But this inter-annual variability of nini-trogen inputs is much less than that of nitrogen outputs, and for en-vironmental reasons, our focus is thus on the latter. Total nitrogen output, including river loading (export) of nitrogen, field denitrification and volatilization, in-stream denitrifica-tion and grain export (through harvest), show an increasing trend with increasing annual runoff depth. Correspondingly, this contributes to a systematic decrease of nitrogen storage with increase of annual runoff depth, from a positive change (storage supplement) during dry years to a negative change (storage depletion) during wet years. Inter-annual variability of phosphorous mass balance, on the other hand, is similar to that of nitrogen, but the variations of the output, and thus the storage, are much smaller compared with the magnitude of annual phosphorous input (i.e., compare the units of the vertical axes in Fig. 8).
Figure 8. Annual runoff, annual input, output nd storage change of nitrogen and phosphorous Fig. 8.Annual runoff, annual input, output and storage change of nitrogen and phosphorous.
Figure 9. Interactions between hydrologica
Fig. 10. Interactions between hydrological and biochemical pro-cesses at the monthly scale.
accumulated biomass gain (from plant uptake), and plant up-take itself is subject to many factors such as soil moisture, soil temperature, crop growing status and nitrogen storage in the soil.
The bottom panel of Fig. 9 presents the breakdown of the non-grain part of the nutrient export into its various compo-nents. In the case of N, the biggest component is riverine dissolved export, which increases strongly with increase of annual runoff. The other three major components, i.e., field denitrification and volatilization, riverine denitrification and particulate riverine export are smaller, relative to the riverine dissolved export, but also appear not to be dependent on an-nual runoff. One can therefore see the connection between the increased dissolved nitrate export and depletion of nitrate storage during wet years, and decreased nitrate export and ac-cumulation of nitrate storage in dry years. The net result of this is that average annual concentrations of dissolved nitrate in rivers in this region can remain constant between years, a type ofchemostatic behaviorthat is being widely reported (Darracq et al., 2008; Godsey et al., 2009; Basu et al., 2010). On the other hand, while the results for P show a strong de-pendence on annual runoff, the magnitudes are so low that one cannot draw definitive conclusions.
The interaction between hydrological and biochemical processes is manifested not only in the inter-annual vari-ability, but also in the intra-annual variability. For example, Fig. 10 shows the monthly variation of nitrogen storage and streamflow. Nitrogen storage variation is subject to both the input and output. From Fig. 10 one can see that the nitro-gen storage peaks twice a year due to fertilizer application, and is depleted significantly in the month of September due to harvesting and during winter and spring when the highest amount runoff is produced. Among the output components, harvesting and riverine export are relatively significant and play an important role in the depletion of nitrogen storage. For phosphorus, the inputs are dominated by fertilizer appli-cation, and the outputs are almost completely dominated by
Fig. 11. Seasonal variation of runoff components and the loading of NO3-N by different runoff components. All values are averaged through the upstream area of Monticello.
grain export. Riverine export of DP and PP do not appear to have any significant impact on phosphorus storage varia-tions.
Further insights into the role of the interactions between hydrological and biochemical processes on nutrient export, as shown in Figs. 9 and 10, can be gained by exploring the relative effects or contributions of different runoff generation components. Figure 11 shows the breakdown of three com-ponents of runoff generation within USRB watershed, and the fractions of NO3-N lateral loading (from the hillslope
Fig. 12.Seasonal variation of riverine export of nitrogen.
Once the nutrients are delivered to the nearest river reach, they are then transported down the stream network. Figure 12 shows the riverine export of nitrogen, showing the dissolved component is the dominant component, whereas riverine ex-port of particulate nitrogen (the part carried by the suspended sediment) is rather small, since it is carried mainly by the Dunne overland flow (which is small). Note that the sea-sonal variation of riverine export of NO3-N is in phase with
the seasonality of streamflow (especially tile drain flows). The riverine flux of NO3-N, before being exported out
of the basin, is subject to in-stream denitrification, which is usually considered a significant loss (Alexander et al., 2009; David and Gentry, 2000; Howarth et al., 1996). In USRB, the obvious decrease of NO3-N concentration from
Big Ditch (upstream) to Monticello (downstream), as shown in Fig. 5, is an indicator of this process. Our model study shows that, without incorporation of in-stream denitrifica-tion process this decrease of NO3-N from upstream to
down-stream cannot be reproduced. The rate of in-down-stream denitrifi-cation is controlled by many hydrological and biogeochemi-cal factors, such as channel water depth, channel flow veloc-ity and nitrate concentration. Nitrate concentration affects in-stream denitrification by the way of uptake velocity, i.e., uptake velocity decreases with the increase of nitrate con-centration (Mulholland et al., 2008). In our model constant uptake velocity is assumed, so the effect of nitrate concen-tration is not incorporated explicitly. We thus focus on the impacts of channel discharge on in-stream denitrification of NO3-N, as shown in Fig. 13. According to Eqs. (9)–(11),
the rate of in-stream denitrification increases with the chan-nel length and decreases with the chanchan-nel water depth and flow velocity. Figure 13 shows a significant seasonality of in-stream denitrification efficiency. The denitrification effi-ciency is defined here as the percentage of in-stream flux removed by in-stream denitrification per unit channel area (channel area = local channel length×channel width). It is highest in August when the channel water depth and flow velocity are smallest, and lowest in May when the channel water depth and flow velocity are largest. As for the spatial variability of in-stream denitrification, it is more significant
Fig. 13.Seasonal variation of channel waterdepth and in-stream re-moval efficiency (for the local channel reach corresponding to each station). The in-stream removal efficiency is defined as the percent-age of in-stream flux removed per unit area of channel by in-stream denitrification, estimated as NO3-N in-stream removal/(upstream inflow + lateral hillslope inflow)/channel area.
5 Summary and conclusions
In this paper we have explored the coupled water and nutrient balances in a large tile-drained agricultural watershed in cen-tral Illinois, with the use of a distributed model based on the representative elementary watershed (REW) approach. We compared average annual estimates of the various compo-nents of the runoff generation against two previous experi-mental studies, confirming that about 80% of the streamflow in the basin is carried by tile drain flows. Likewise, aver-age annual estimates of the various components of the nu-trient (N and P) balances were compared against estimates obtained from several previous experimental studies in the literature, and found good agreement. Once again, tile drains are found to be the carrier of over 90% of the riverine ex-port of dissolved nutrients, especially nitrate. In the case of P, over 98% of the fertilizer application is removed through grain harvest, and only a small fraction (less than 2%) is ex-ported with runoff either in dissolved or particulate form. In the case of N, however, nitrogen fixation by plants repre-sents 40% of the total annual inputs to the catchment (fix-ation + fertiliz(fix-ation), of which slightly over 20% is exported with runoff mostly in dissolved form, predominantly by tile drain flow. The remainder is removed through grain harvest. The coupled model was also used to gain insights into the interactions between hydrological and biogeochemical processes, and the role of climate and consequent hydro-logic variability on nutrient export processes. The results showed that there is a very dependence on the strength of annual runoff and the annual export of nutrients, especially dissolved nitrate component. Assuming that nutrients inputs through fertilizer application is constant between years, and the observation that removal by grain harvest decreases only slightly with increase annual runoff, it is found that relatively dry years are characterized by nutrient accumulation in soil and relatively wet years are characterized by nutrient removal from soil storage. The net result of higher runoff and higher nutrient runoff in wet years and vice versa means that annual average nutrient concentration can be expected to stay rela-tively constant in such human-impacted agricultural regions. This phenomenon may be one of the causes of chemostatic behavior that has been reported in some agricultural regions of the world. This is not the case for phosphorus removal, however, since in this case the removal of phosphorus by runoff is minor comparing with the removal by harvesting.
This work has demonstrated that a parsimonious model of coupled water, sediment and nutrient balances can be devel-oped that does justice to much of the multi-scale variability of hydrological and biogeochemical processes and their in-teractions, which are essential for the simulation and predic-tion of sediments and nutrients in large agricultural catch-ments. The model presented here can serve as a numerical framework, not only for making predictions of the effects of climate and land use changes, but also to provide guidelines for undertaking new observations and new process studies
that are critical for improving the predictive capability of such models in the future. Still, improvements are needed in several areas, including the transportation of phosphorous by tile drainage, an explicit treatment of nutrient uptake by vegetation (including varieties of food and biofuel crops and natural vegetation), and denitrification processes within the river network, including a more accurate representation of channel hydraulic geometry. Continuous measurements of nutrient concentrations in tile drains, river reaches at a range of scales and in the hillslopes are needed to improve process descriptions in the model and to validate the model predic-tions. This is left for future research.
Acknowledgements. We thank ISWS and USGS for kindly pro-viding most of the data used in this study. We are also grateful to Greg McIsaac, Prasanta Kalita and Praveen Kumar for providing valuable comments and suggestions on various aspects of the modeling. The work was funded in part by the University of Illinois through the IACAT project (PI: Barbara Minsker), the National Science Foundation (NSF EFRI-0835982, Ximing Cai, PI), and the National Science Foundation of China (NSFC 50779022, Heping Hu, PI). The financial support is gratefully acknowledged.
Edited by: A. Gelfan
References
Algoazany, A. S., Kalita, P. K., Czapar, G. F., and Mitchell, J. K.: Phosphorus transport through subsurface drainage and surface runoff from a flat watershed in East Central Illinois, USA, J. En-viron. Qual., 36, 681–693, 2007.
Alexander, R. B., B¨ohlke, J. K., Boyer, E. W., David, M. B., Harvey, J. W., Mulholland, P. J., Seitzinger, S. P., Tobias, C. R., Tonitto, C., and Wollheim, W. M.: Dynamic modeling of nitrogen losses in river networks unravels the coupled effects of hydrological and biogeochemical processes, Biogeochemistry, 93, 91–116, 2009. Arnold, J. G. and Allen, P. M.: Estimating hydrologic budgets for
three Illinois watersheds, J. Hydrol., 176, 57–77, 1996. Basu, N. B., Destouni, G., Jawitz, J. W., Thompson, S. E.,
Louki-nova, N. V., Darracq, A., Zanardo, S., Yaeger, M. A., Sivapalan, M., Rinaldo, A., and Rao, P. S. C.: Nutrient loads exported from managed catchments reveal emergent biogeochemical stationar-ity, Geophys. Res. Lett., in review, 2010.
Beasley, D. B., Monke, E. J., and Huggins, L. F.: ANSWERS: a model for watershed planning, Purdue Agr. Exp. Stn. J. Pap., 7038, 34 pp., 1977.
Darracq, A., Lindgren, G., and Destouni, G.: Long-term devel-opment of Phosphorus and Nitrogen loads through the subsur-face and sursubsur-face water systems of drainage basins, Global Bio-geochem. Cy., 22, GB3022, doi:10.1029/2007GB003022, 2008. David, M. B., Gentry, L. E., Kovacic, D. A., and Smith, K. M.: Nitrogen balance in and export from an agricultural watershed, J. Environ. Qual., 26, 1038–1048, 1997.
Demissie, M. and Keefer, L.: Watershed Monitoring and Land Use Evaluation for the Lake Decatur Watershed. Miscellaneous Pub-lication 169, Illinois State Water Survey, Champaign, IL, 1996. Donner, S., Kucharik, C., and Oppenheimer, M.: The influence of
climate on in-stream removal of nitrogen, Geophys. Res. Lett., 31, L20509, doi:10.1029/2004GL020477, 2004.
Donigian, A. S., Bicknell, B. R., and Imhoff, J. C.: Hydrological simulation programm Fortran (HSPF), in: Computer Models of Watershed Hydrology, edited by: Singh, V. P., WRP, Highlands Ranch, Colorado, USA, 395–442, 1995.
Ernst, L. F.: Calculations of the steady flow of groundwater in ver-tical sections, Neth. J. Agr. Sci., 4, 126–131, 1956.
Gentry, L. E., David, M. B., Royer, T. V., Mitchell, C. A., and Starks, K. M.: Phosphorus transport pathways to streams in tile drained agricultural watersheds, J. Environ. Qual., 36, 408–415, 2007.
Gentry, L. E., David, M. B., Below, F. E., Royer, T., and McIsaac, G. F.: Nitrogen mass balance of a tile-drained agricultural water-shed in East-Central Illinois, J. Environ. Qual., 38, 1841–1847, 2009.
Godsey, S. E., Kirchner, J. W., and Clow, D. W.: Concentration-discharge relationships reflect chemostatic characteristics of US catchments, Hydrol. Process., 23(13), 1844–1864, 2009. Goswami, D.: Analysis of flow and water quality components in
drainage channels in tile drained watersheds, Doctoral Thesis, University of Illinois at Urbana-Champaign, USA, 2006. Hooghoudt, S. B.: Algemeene beschouwing van het probleem van
de detailontwatering en de infiltratie door middel van paral-lel loopende drains, greppels, slooten en kanalen, Versl. Land-bouwk. Onderz., 46(14) B, Gravenhage, 1940.
Howarth, R. W., Billen, G., Swaney, D., Townsend, A., Jaworski, N., Lajtha, K., Downing, J. A., Elmgren, R., Caraco, N., Jordan, T., Berendse, F., Freney, J., Kudeyarov, V., Murdoch, P., and Zhu, Z.-L.: Regional nitrogen budgets and riverine N & P fluxes for the drainages to the North Atlantic Ocean: Natural and human influences, Biogeochemistry, 35, 181–226, 1996.
Hu, X., McIsaac, G. F., David, M. B., and Louwers, C. A. L.: Mod-eling riverine nitrate export from an east-central Illinois water-shed using SWAT, J. Environ. Qual., 36, 996–1005, 2007. Ivanov, V. Y., Vivoni, E. R., Bras, R. L., and Entekhabi, D.:
Preserv-ing high-resolution surface and rainfall data in operational-scale basin hydrology: a fully-distributed physically-based approach, J. Hydrol., 298, 80–111, 2004.
Jones, C. A., Cole, C. V., Sharpley, A. N., and Williams, J. R.: A simplified soil and plant phosphorus model: I. Documentation, Soil Sci. Soc. Am. J., 48, 800–805, 1984.
Keefer, L. and Bauer, E.:. Watershed Monitoring for the Lake De-catur Watershed, 2003–2006. Illinois State Water Survey Con-tract Report 2008-06, Champaign, IL, 2008.
Knisel, W. G.: CREAMS: A Field-scale model for chemicals, runoff, and erosion from agricultural management systems, USDA Conserv. Res. Rep., No. 26, 643 pp., 1980.
Kirkham, D.: Seepage of steady rainfall through soil into drains, Trans. Am. Geophys. Union, 39, 892–908, 1958.
Lee, H., Sivapalan, M., and Zehe, E.: Representative Elemen-tary Watershed (REW) approach, a new blueprint for distributed hydrologic modeling at the watershed scale: the development of closure relations, Canadian Water Resources Association (CWRA), Ottawa, Canada, 2005.
Lee, H., Zehe, E., and Sivapalan, M.: Predictions of rainfall-runoff response and soil moisture dynamics in a microscale catchment using the CREW model, Hydrol. Earth Syst. Sci., 11, 819–849, doi:10.5194/hess-11-819-2007, 2007.
Li, H.-Y., Sivapalan, M., and Tian, F.-Q.: Comparative diagnos-tic analysis of runoff generation processes in Oklahoma DMIP2 basins: The Blue River and the Illinois River, J. Hydrol., in press, doi:10.1016/j.jhydrol.2010.08.005, 2010.
Liu, D.-F., Tian, F.-Q. and Hu, H.-P.: Sediment simulation at Up-per Sangamon River basin using the THREW model, Hydro-logical Modelling and Integrated Water Resources Management in Ungauged Mountainous Watersheds,Proceedings of a sympo-sium held at Chengdu, China, November 2008, IAHS Publ., 335, 2009.
McIsaac, G. F. and Hu, X.: Net N input and riverine N export from Illinois agricultural watersheds with and without extensive tile drainage, Biogeochemistry, 70, 251–271, 2004.
Mou, L., Tian, F., Hu, H., and Sivapalan, M.: Extension of the Representative Elementary Watershed approach for cold regions: constitutive relationships and an application, Hydrol. Earth Syst. Sci., 12, 565–585, doi:10.5194/hess-12-565-2008, 2008. Mulholland, P. J., Helton, A. M., Poole, G. C., Hall Jr., R. O.,
Hamilton, S. K., Peterson, B. J., Tank, J. L., Ashkenas, L. R., Cooper, L. W., Dahm, C. N., Dodds, W. K., Findlay, S. E. G., Gregory, S. V., Grimm, N. B., Johnson, S. L., McDowell, W. H., Meyer, J. L., Valett, H. M., Webster, J. R., Arango, C. P., Beaulieu, J. J., Bernot, M. J., Burgin, A. J., Crenshaw, C. L., Johnson, L. T., Niederlehner, B. R., O’Brien, J. M., Potter, J. D., Sheibley, R. W., Sobota, D. J., and Thomas, S. M.: Stream denitrification across biomes and its response to anthropogenic nitrate loading, Nature, 452, 202–205, doi:10.1038/nature06686, 2008.
Nash, J. E. and Sutcliffe, J. V.: River flow forecasting through con-ceptual models part I – A discussion of principles, J. Hydrol., 10(3), 282–290, 1970.
Neitsch, S. L., Arnold, J. G., Kiniry, J. R., and Williams, J. R.: Soil and Water Assessment Tool – Theoretical Documentation – Version 2005, Grassland, Soil and Water Research Laboratory, Agricultural Research Service and Blackland Research Center, Texas Agricultural Experiment Station, Temple, Tex, 2005. Reggiani, P., Sivapalan, M., and Hassanizadeh, S. M.: Unifying
framework for watershed thermodynamics: balance equations for mass, momentum, energy and entropy, and the second law of thermodynamics, Adv. Water Resour., 22(4), 367–398, 1998. Reggiani, P., Sivapalan, M., and Hassanizadeh, S. M.: Unifying
framework for watershed thermodynamics: constitutive relation-ships, Adv. Water Resour., 23(1), 15–39, 1999.
Reggiani, P., Sivapalan, M., and Hassanizadeh, S. M.: Conserva-tion equaConserva-tions governing hillslope responses, Water Resour. Res., 38(7), 1845–1863, 2000.
Ritzema, H. P.: Drainage Principles and Applications, ILRI Publi-cation No. 16, Wageningen, The Netherlands, 1994.
Rhoads, B. L. and Herricks, E. E.: Naturalization of headwater streams in Illinois: challenges and possibilities, in: River Chan-nel Restoration, edited by: Brookes, A. and Shields, F. D., John Wiley & Sons, Chichester, 331–367, 1996.
Tian, F., Hu, H., Lei, Z., and Sivapalan, M.: Extension of the Representative Elementary Watershed approach for cold regions via explicit treatment of energy related processes, Hydrol. Earth Syst. Sci., 10, 619–644, doi:10.5194/hess-10-619-2006, 2006. Tian, F.-Q., Hu, H.-P., and Lei, Z.-D.: Thermodynamic watershed
hydrological model (THModel): constitutive relationship, Sci. China Ser. E, 51(9), 1353–1369, 2008.
Tian, F.-Q., Li, H.-Y., and Sivapalan, M.: Model diagnostic analysis of seasonal switching of runoff generation mecha-nisms in the Blue River basin, Oklahoma, J. Hydrol., in press, doi:10.1016/j.jhydrol.2010.03.011, 2010.
Viney, N. R. and Sivapalan, M.: A conceptual model of sediment transport: Application to the Avon River Basin in Western Aus-tralia, Hydrol. Process., 13(5), 727–743, 1999.
Viney, N. R., Sivapalan, M., and Deeley, D.: A conceptual model of nutrient mobilisation and transport applicable at large catchment scales, J. Hydrol., 240, 23–44, 2000.
Williams, J. R., Jones, C. A., and Dyke, P. T.: A modeling approach to determining the relationship between soil erosion and soil pro-ductivity, Trans. Am. Soc. Agr. Eng., 27, 129–144, 1984. Williams, J. R., Nicks, A. D., and Arnold, J. G.: Simulator for water
resources in rural basins, J. Hydraul. Eng.-ASCE, 111, 970–986, 1985.
Wischmeier, W. H. and Smith, D. D.: Predicting rainfall ero-sion loss: A guide to conservation planning, Agricultural hand-book 537, US Department of Agriculture, Washington, DC, USA, 1978.
Wollheim, W. M., V¨or¨osmarty, C. J., Peterson, B. J., Seitzinger, S. P., and Hopkinson, C. S.: Relationship between river size and nutrient removal, Geophys. Res. Lett., 33, L06410, doi:10.1029/2006GL025845, 2006.