Submitted28 November 2014 Accepted 16 February 2015 Published5 March 2015
Corresponding author Martyna Molak,
Academic editor William Amos
Additional Information and Declarations can be found on page 11
DOI10.7717/peerj.821
Copyright 2015 Molak and Ho
Distributed under
Creative Commons CC-BY 4.0
OPEN ACCESS
Prolonged decay of molecular rate
estimates for metazoan mitochondrial
DNA
Martyna Molak1,2and Simon Y.W. Ho1
1School of Biological Sciences, University of Sydney, Sydney, Australia
2Museum and Institute of Zoology, Polish Academy of Sciences, Warsaw, Poland
ABSTRACT
Evolutionary timescales can be estimated from genetic data using the molecular clock, often calibrated by fossil or geological evidence. However, estimates of molec-ular rates in mitochondrial DNA appear to scale negatively with the age of the clock calibration. Although such a pattern has been observed in a limited range of data sets, it has not been studied on a large scale in metazoans. In addition, there is uncertainty over the temporal extent of the time-dependent pattern in rate estimates. Here we present a meta-analysis of 239 rate estimates from metazoans, representing a range of timescales and taxonomic groups. We found evidence of time-dependent rates in both coding and non-coding mitochondrial markers, in every group of animals that we studied. The negative relationship between the estimated rate and time persisted across a much wider range of calibration times than previously suggested. This indicates that, over long time frames, purifying selection gives way to muta-tional saturation as the main driver of time-dependent biases in rate estimates. The results of our study stress the importance of accounting for time-dependent biases in estimating mitochondrial rates regardless of the timescale over which they are inferred.
Subjects Evolutionary Studies, Genetics, Molecular Biology
Keywords Substitution rate, Molecular clock, Evolutionary timescale, Calibration, Time-dependent rates
INTRODUCTION
Understanding the tempo and mode of the molecular evolutionary process is one of the fundamental goals of biological research. Determining rates and timescales of evolution allows us to explore such questions as the co-evolution of species (Reed et al., 2007), causes of extinction (Lorenzen et al., 2011), and drivers of diversification (Jetz et al., 2012). Molecular estimates of evolutionary timescales are made using the molecular clock, which assumes that DNA evolves at a constant rate among lineages (Zuckerkandl & Pauling, 1962). With improving knowledge of the evolutionary process, molecular-clock methods have undergone considerable development over the past five decades (Ho, 2014;Kumar, 2005), with various forms of rate variation being able to be taken into account (Ho & Duchˆene, 2014).
To estimate evolutionary rates from DNA sequence data, molecular clocks need to be calibrated. This involves using independent information to constrain the age of one or
more nodes in a phylogenetic analysis. There are several types of evidence that can provide calibrations for molecular clocks (for a recent review, seeHipsley & M¨uller, 2014). One of the primary sources is the fossil record, which can provide an indication of the first appear-ance of a lineage and thus place a minimum bound on when it diverged from its sister lin-eage. The ages of nodes in the tree can also be estimated using biogeographic hypotheses. For example, the rise of barriers to gene flow or new habitats for colonization can provide age estimates for divergences between sister species (e.g.,Fleischer, McIntosh & Tarr, 1998). Over short timescales, molecular clocks can be calibrated by the ages of heterochronous samples or by available pedigree records. Heterochronous sampling is common in studies of viruses and of ancient DNA. If the ages of the samples are sufficiently distinct from one another, they can be used to calibrate estimates of evolutionary rates (Drummond et al., 2003;Molak et al., 2013). In pedigree studies, the relationships among samples have been documented and the divergence times might be exactly known.
The most significant challenge to the molecular clock has been widespread evidence of rate variation among lineages. These patterns of rate variation can be partly explained by differences in generation time, longevity, and other life-history characters (Bromham, 2009). Recently, however, there has been growing evidence of heterogeneity in rate estimates across timescales. For example, mitochondrial rates estimated in phylogenetic studies are about an order of magnitude lower than those estimated in analyses of pedigrees (Ho & Larson, 2006;Howell et al., 2003). More generally, estimated rates appear to be time-dependent, showing a negative relationship with the timescale over which they are measured (Ho et al., 2011;Ho et al., 2005). This pattern has been observed in coding and non-coding mitochondrial DNA from a range of taxa, including humans (Endicott et al., 2009;Henn et al., 2009;Rieux et al., 2014), fish (Burridge et al., 2008;Genner et al., 2007), birds (Garc´ıa-Moreno et al., 2006;Ho et al., 2005), and invertebrates (Crandall et al., 2012;Gratton, Konopi´nski & Sbordoni, 2008;Ho & Lo, 2013;Papadopoulou, Anastasiou & Vogler, 2010).
causing underestimates of rates over long evolutionary timescales (dos Reis & Yang, 2013;
Duchˆene, Holmes & Ho, 2014;Ho et al., 2007).
The time-dependent biases in molecular rate estimation have important implications for studies of recent evolutionary timescales. For example, the ages of coalescence events within populations will potentially be overestimated if they are based on long-term rates calibrated using fossil data (Ho et al., 2008). This time-dependence, together with substantial variation in rates among different taxa, also calls into question the application of so-called ‘standard’ mitochondrial rates, such as those estimated in studies of lizards (Macey et al., 1998), birds (Shields & Wilson, 1987;Weir & Schluter, 2008), mammals (Brown, George & Wilson, 1979), and arthropods (Brower, 1994) and used in many subsequent studies. Time-dependent biases in rate estimation might also contribute to a wider discussion about discrepancies between molecular and palaeontological estimates of divergence times (Benton & Ayala, 2003).
Although there is a clear discrepancy between rates estimated on short and long timescales, there remains uncertainty about how rates scale with time. A major hindrance has been the paucity of reliable calibrations on intermediate timescales. In this regard, ancient DNA data can be particularly useful in bridging the gap between short- and long-term rate estimates (Ho, Kolokotronis & Allaby, 2007). Because ages are assigned directly to sequences in the analysis, no assumptions need to be made about the timing of population splits and their correspondence to genetic divergences (Rambaut, 2000). Unfortunately, ancient DNA analyses are constrained by the post-mortem degradation of DNA and the limited reach of radiocarbon dating.
Accurate characterization and quantification of time-dependent biases in rate estima-tion is crucial for understanding their causes and accounting for their effects. Studies of time-dependence in rate estimates have typically involved limited data sets, comprising small numbers of taxa or sequences. This leaves open questions concerning the prevalence and ubiquity of these biases, the timescales across which rate estimates are time-dependent, and the rate of decay between high pedigree rates and low phylogenetic rate estimates.
Quantifying the extent of time-dependent rates is particularly important because it can provide insights into its causes. For example, purifying selection is only expected to operate over relatively short timescales, whereas mutational saturation tends to become a problem at greater time depths (Duchˆene, Holmes & Ho, 2014;Subramanian et al., 2009). On the other hand, if saturation has only a small impact on rate estimates, there should be an upper limit to the timescale over which the biases can be observed. If these limits and the mode of decay of rate estimates can be identified and incorporated into phylogenetic mod-els, the accuracy of the inference of evolutionary processes will be substantially improved.
In this study, we aim to characterize the taxonomic breadth and temporal depth of time-dependent rates by performing a meta-analysis of mitochondrial rates estimated from a wide range of amniote and insect taxa. We investigate how these rate estimates depend on the age of the calibrations used to estimate them, how they vary among taxonomic groups and molecular markers, and whether time-dependent biases persist across a broad temporal scale.
METHODS
Collection of published rate estimates
We performed a meta-analysis of evolutionary rate estimates to determine their relation-ship with the timescale over which they are estimated. Our data set comprised published estimates of molecular evolutionary rates, along with the ages of their corresponding calibration points (Table S1). We collected rate estimates for amniotes and insects from recent publications in several leading journals in molecular evolution (Table S1).
Because methods used to estimate rates varied widely among studies, we chose the oldest calibration used in each study as a proxy for the timescale over which the rate had been estimated. Therefore, for each rate estimate, ‘calibration time’ represents (i) the oldest fossil or biogeographical event used as an age constraint on a basal node for the phylogeny; (ii) the oldest ancient DNA sequence used in heterochronous sampling; or (iii) the depth of the genealogy in a pedigree study.
Novel rate estimates
In addition to collecting a set of published rate estimates, we obtained thirty novel estimates and re-estimates of rates by analysing available ancient DNA sequences from 16 species (Table S2). Twelve of these estimates were obtained using ancient DNA as the sole source of calibration. The remaining 18 estimates were obtained from ancient DNA data sets, but with the addition of a single sequence from a sister species; for these data sets a fossil-based estimate of the interspecific divergence time was used to calibrate the rate estimate. Identification of sister species and divergence times was done with reference to published studies (Table S2). One additional rate estimate was obtained using a mitochondrial data set from modern humans and an orangutan, calibrated using fossil evidence of the divergence time between these two species (Table S2).
The best-fitting model of nucleotide substitution was chosen for each data set according to the Bayesian Information Criterion using ModelGenerator 0.85 (Keane et al., 2006). Substitution rates were estimated using the Bayesian phylogenetic software BEAST 1.7.2 (Drummond & Rambaut, 2007). We used a strict clock calibrated only by the ages of the sequences in the analyses of intraspecific data (Brown & Yang, 2011;Drummond et al., 2006) and an uncorrelated lognormal relaxed clock when analysing the data sets that included sister species. A uniform prior of 0–10−4substitutions/site/year was specified
for the mean substitution rate, whereas a 1/xprior was used for the population size in the coalescent prior for the tree. In analyses of data sets that included sister species, an informative prior distribution was specified for the age of the root according to the fossil-based estimate of the divergence time (Table S2). Posterior distributions of parameters were estimated using Markov chain Monte Carlo sampling, with samples drawn every 103steps over a total of at least 107steps. Some chains were extended to ensure sufficient sampling and effective sample sizes above 100 for all parameters.
Drummond, 2007). We chose the rate estimate obtained using the better-fitting model. For all further analyses, we used median estimates of the strict-clock rate from the intraspecific analyses and the mean tree-wide rate from the analyses that included sister species.
Meta-analysis of the rate estimates
We conducted a meta-analysis of all of the rate estimates (previously published and gen-erated in this study) by plotting log-transformed rate estimates against log-transformed calibration times. To avoid biasing the regression analysis with multiple estimates for single species, estimates from the various human pedigree studies were pooled together and used as a single data point (Table S1). For the same reason, we took the average of the human rate estimates calibrated using theHomo-Pandivergence time (Table S1). When a study reported rate estimates from a number of mitochondrial markers for a single species, we took the average of the estimates.
We did separate linear regressions for coding and non-coding markers, and for subsets based on taxonomic classes (insects, reptiles, birds, and mammals). We also performed an intraspecific regression on the human data to test for time-dependent rates at the intraspecific level (Table S1). All linear regressions were performed in R (R Development Core Team, 2014).
To test whether the strength of time-dependence varied across timescales, we performed regression analyses for subsets of the data, chosen according to calibration times. We used a sliding window with a width of four orders of magnitude (100–104years, 101–105years, . . . 105–109years). To investigate the extent of the timescale over which time-dependent biases in rate estimation can be observed, we performed regression analyses on subsets of data based on calibrations of 106–109, 107–109, and 108–109years.
Testing for spurious self-correlation
Any correlation between substitution rates and timescales over which they are estimated might be a mathematical artifact caused by self-correlation. This phenomenon can occur when a ratio is plotted against its denominator and can produce spurious correlations that are highly significant (Kenney, 1982). Here, the ratio is the estimate of the substitution rate (genetic distance divided by time elapsed) and the denominator is the time elapsed.
For all of our regression analyses, we investigated whether the correlation we detect is solely such a mathematical artifact (Kenney, 1982;Sheets & Mitchell, 2001) using a randomization test (Jackson & Somers, 1991). For all of the data points in our analysis, we randomized the genetic distances, which we calculated by multiplying substitution rate and calibration time. We recalculated substitution rates using these randomized distances, then performed regression analyses against the corresponding calibration times. This procedure was repeated 10,000 times for each subset of data for which regression analysis was performed in our meta-analysis.
We then tested whether the estimate of the regression slope for the original data fell within the distribution of the estimated slopes for the randomized data. In this way, we determined whether or not the detected correlations were entirely the product of spurious
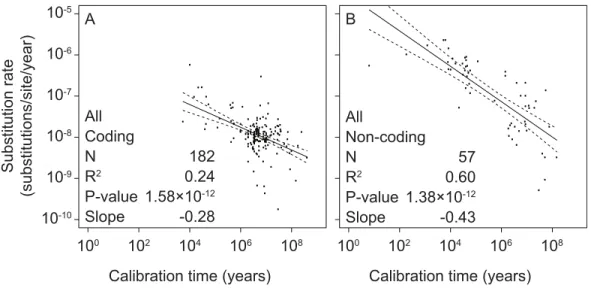
Figure 1 Linear regressions of log-transformed rate estimates from mitochondrial markers in a range of metazoan taxa against the log-transformed calibration times that were used to estimate the rates.Separate analyses were performed for coding markers (A) and non-coding markers (B).
self-correlation. Deviation from the distribution produced by the randomized data would signify that the observed time-dependence could not be exclusively a mathematical artifact.
For all data subsets tested, the randomized data produced an average regression slope of−1, which is the value expected when there is spurious self-correlation (Kenney, 1982).
Therefore, we performed an additional test by repeating the regression analysis for each subset of data using a null hypothesis of slope= −1.
RESULTS
Our analyses were based on a data set comprising 239 published, re-estimated, and novel estimates of evolutionary rates in metazoan mitochondrial DNA (Table S1). Rate estimates ranged from 1.78×10⁻¹⁰substitutions/site/year (cytochromeband tRNA genes in woolly
mammoth;Rohland et al., 2010) to 2.31×10⁻⁶substitutions/site/year (the control region
in Ad´elie penguins;Lambert et al., 2002). Calibration ages ranged from 6 years (pedigree study of Ad´elie penguins;Millar et al., 2008) to 4×10⁸years (fossil calibration forBacillus
stick insects;Plazzi, Ricci & Passamonti, 2011).
To test the relationship between mitochondrial rate estimates and calibration ages, we performed separate linear-regression analyses of coding and non-coding regions. All linear regressions were performed using log-transformed values of both estimated rates and calibration times. We found significant correlations between these two variables in coding markers (slope= −0.28,p=1.58×10⁻¹²,R2=0.24) as well as non-coding markers (slope= −0.43,p=1.38×10⁻¹²,R2=0.60) (Fig. 1andTable S3).
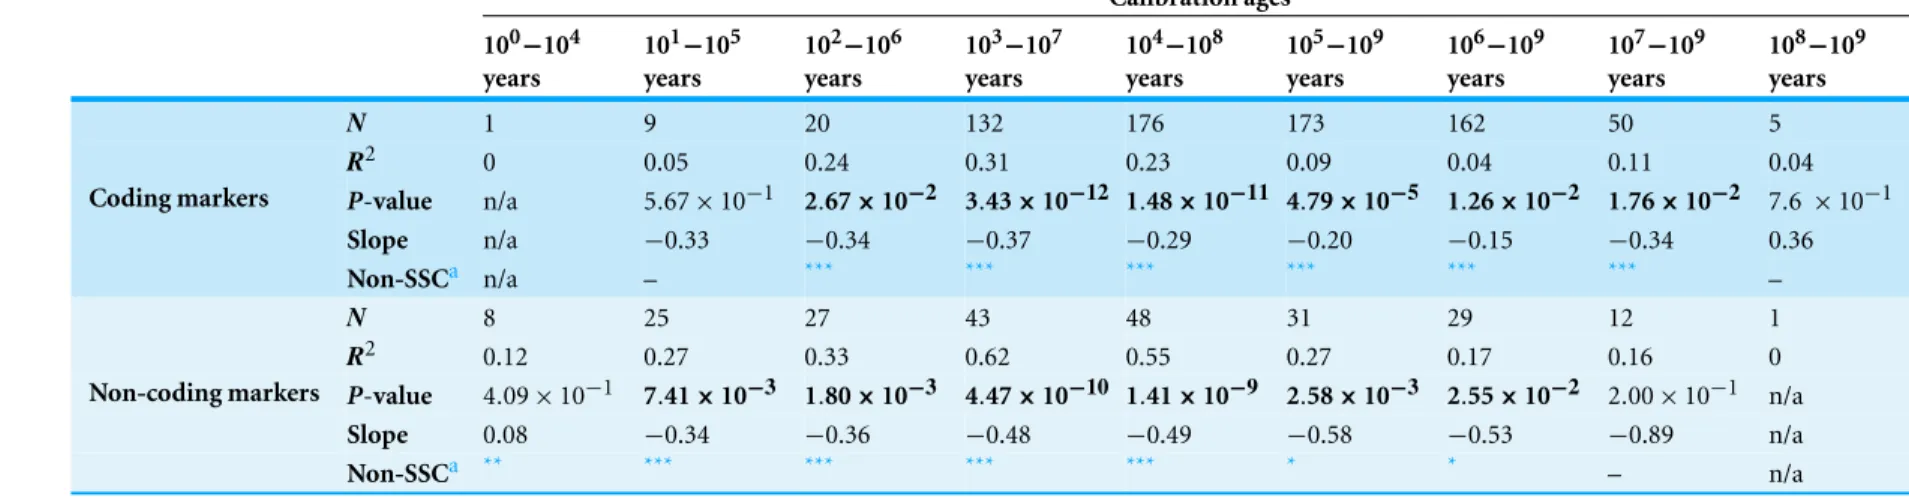
Table 1 Linear-regression analysis of data points from different time slices using a sliding window with a width of four orders of magnitude, or with a shrinking window for the oldest calibrations.Significant regression results (p≤0.05) are shown in bold. A more detailed version of this table is available asTable S4.
Calibration ages
100−104 years
101−105 years
102−106 years
103−107 years
104−108 years
105−109 years
106−109 years
107−109 years
108−109 years
N 1 9 20 132 176 173 162 50 5
R2 0 0.05 0.24 0.31 0.23 0.09 0.04 0.11 0.04
P-value n/a 5.67×10⁻¹ 2.67×10⁻² 3.43×10⁻¹² 1.48×10⁻¹¹ 4.79×10⁻⁵ 1.26×10⁻² 1.76×10⁻² 7.6×10⁻¹
Slope n/a −0.33 −0.34 −0.37 −0.29 −0.20 −0.15 −0.34 0.36
Coding markers
Non-SSCa n/a – *** *** *** *** *** *** –
N 8 25 27 43 48 31 29 12 1
R2 0.12 0.27 0.33 0.62 0.55 0.27 0.17 0.16 0
P-value 4.09×10⁻¹ 7.41×10⁻³ 1.80×10⁻³ 4.47×10⁻¹⁰ 1.41×10⁻⁹ 2.58×10⁻³ 2.55×10⁻² 2.00×10⁻¹ n/a
Slope 0.08 −0.34 −0.36 −0.48 −0.49 −0.58 −0.53 −0.89 n/a
Non-coding markers
Non-SSCa ** *** *** *** *** * * – n/a
Notes.
aResults of tests against spurious self-correlation (non-SSC). Higherp-value from the two tests is shown. *p<0.05.
**p<0.005. ***p<0.0005.
Molak
and
Ho
(2015),
P
eerJ
,
DOI
10.7717/peerj.821
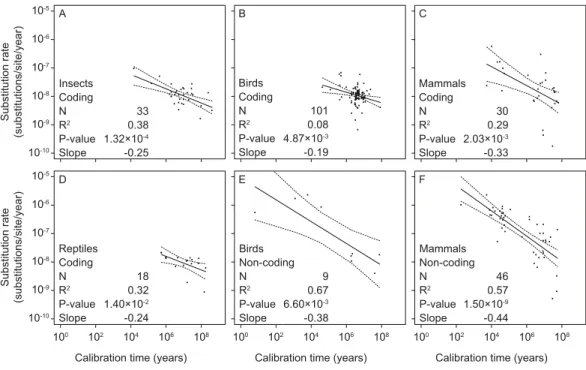
Figure 2 Linear regressions of log-transformed rate estimates against log-transformed calibration times used for their estimation for different taxonomic groups (insects (A), reptiles (D), birds (B, E), and mammals (C, F)) and mitochondrial marker types (coding (A–D) and non-coding (E, F)).There were insufficient data for regression analyses of non-coding markers in reptiles and insects.
We found significant negative relationships between mitochondrial rate estimates and calibration ages in our separate analyses of coding and non-coding markers in mammals, birds, reptiles, and insects (Fig. 2andTable S3). However, there were too few data points from non-coding markers for reptiles (2 data points) and insects (0 data points) to allow regression analysis. We also found support for time-dependent rates in our intraspecific analysis of mitochondrial sequence data from humans (Fig. S1
andTable S3), corroborating results previously obtained from a smaller data set (Henn et al., 2009).
Each of the significant regressions reported above was significantly different from a corresponding regression that was calculated after randomizing the data. Each was also significantly different from a null hypothesis of slope= −1, which was the average
slope produced by randomized data (Table 1,Tables S3andS4) as expected in the case of spurious self-correlation (Kenney, 1982).
DISCUSSION
(Burridge et al., 2008), or 1–2 Myr (Ho et al., 2005;Papadopoulou, Anastasiou & Vogler, 2010). However, our finding of a prolonged decay in molecular rate estimates is consistent with recent evidence from a large-scale analysis of substitution rates in viruses, which revealed a time-dependent bias in rate estimates across a temporal scale spanning 10 orders of magnitude (Duchˆene, Holmes & Ho, 2014). Together, these results have considerable implications for studies of divergence times.
Our finding of a prolonged relationship between rate estimates and calibration times sheds some light on the causes of time-dependent biases in rate estimation. Specifically, the temporal breadth of the relationship between rate and calibration time suggests that more than one factor is responsible. The effects of purifying selection decline over time and thus are not expected to be detectable over long timescales (Nei, 1971;Phillips, 2009), even though the lack of recombination in mitochondrial DNA can potentially extend the life of deleterious mutations through genetic hitchhiking (Ballard & Kreitman, 1995;Birky & Walsh, 1988). In turn, mutational saturation is expected to increase over time and, if the available nucleotide substitution models do not correct for multiple hits sufficiently, the rates over longer timescales will be more severely underestimated. Underestimation of the number of substitutions across longer timeframes can lead to time-dependent patterns in other evolutionary parameters, including the ratio of nonsynonymous to synonymous substitutions (dos Reis & Yang, 2013) and the ratio of transitions to transversions (Duchˆene, Ho & Holmes, in press). Therefore, we propose that purifying selection and mutational saturation are the main drivers of these biases. This is consistent with the patterns found in sequence data from viruses (Duchˆene, Holmes & Ho, 2014).
Signs of a time-dependent bias in rate estimation persisting for more than 10 Myr and in a wide range of taxa also allow us to challenge some other hypotheses about the causes of time-dependent rates. Population fluctuations and other demographic factors (Balloux & Lehmann, 2012;Henn et al., 2009), which vary among species, cannot fully explain the patterns that we have observed across a diverse range of taxa. Given the temporal depth of time-dependent biases in rate estimation, calibration errors are unlikely to represent a sufficient explanation (Ho et al., 2011;Peterson & Masel, 2009). Our data-randomization analyses suggest that the time-dependent pattern of rate estimates is unlikely to be solely a mathematical artefact. Even if this were the case, however, accounting for time-dependent biases in rate estimates would still be necessary when estimating evolutionary timescales using the molecular clock.
Our results also support a gradual decay from high pedigree to low phylogenetic rate estimates through time. Intermediate rate estimates, such as those obtained from ancient DNA studies, have previously been attributed to various methodological biases (Debruyne & Poinar, 2009;Emerson & Hickerson, in press;Navascues & Emerson, 2009). However, our results do not indicate that rate estimates based on ancient DNA are anomalous. Additionally, estimates of rates calibrated using biogeographic events in the late Pleistocene and Holocene are comparable to those based on ancient DNA data of similar age. This can be seen, for example, in our intraspecific analysis of rate estimates from humans (Fig. S1
andTable S1).
One of the disadvantages of our meta-analysis is the paucity of mitochondrial rate estimates based on young calibrations for coding markers and for insects. Although the uneven representation of taxonomic classes on different timescales might affect the regression analysis that includes all data points, our analyses of class-specific subsets of data yielded significant evidence of time-dependent trends. One other potential source of bias in the meta-analysis is that studies of evolutionary processes on short timescales tend to focus on fast-evolving taxa, whereas studies of longer timescales have a greater focus on slowly evolving organisms (Sheets & Mitchell, 2001). This, however, can be rejected as a major cause for the biases based on the observed intraspecific time-dependent variation of estimated rates, which was shown previously (Duchˆene, Holmes & Ho, 2014;Henn et al., 2009) and in this study (Fig. S1andTable S3).
Our results confirm that considerable caution needs to be exercised in molecular studies of evolutionary timescales. The need to correct for time-dependent biases in rate estimates has been pointed out previously (Ho et al., 2005). As the variability of regression slopes in our study shows, however, there is no universal function that can be applied across taxa and across markers. Although a few studies have proposed corrections for specific taxa (Cutter, 2008;Gignoux, Henn & Mountain, 2011;Obbard et al., 2012;Soares et al., 2013;Soares et al., 2009), they focused on the effects of purifying selection. Additionally, it is not clear to what extent they can be extrapolated to other taxa. Ultimately, it might be best to use only calibrations that are reasonably close in time to the evolutionary events of interest (Ho & Larson, 2006).
In view of the prevalence of time-dependent biases in estimates of mitochondrial rates, neutrally evolving nuclear loci might be a preferable alternative to the mitochondrial genome for estimating evolutionary timescales. However, there has been compelling evidence of time-dependent biases in estimates of nuclear rates in some organisms, includingCaenorhabditis elegans(Denver et al., 2004) andDrosophila melanogaster
(Haag-Liautard et al., 2007). In contrast, studies of human nuclear genomes have yielded lower estimates of rates from pedigrees than from fossil-calibrated comparisons with chimpanzees (Roach et al., 2010;Xue et al., 2009). This represents a prominent anomaly against the broad time-dependent biases seen in other estimates of evolutionary rates, and it remains to be seen whether the results from human genomes are representative of a broader trend among nuclear genomes (Scally & Durbin, 2012).
ACKNOWLEDGEMENTS
ADDITIONAL INFORMATION AND DECLARATIONS
Funding
Martyna Molak was supported by the University of Sydney International Scholarship. Simon Y.W. Ho was supported by the Australian Research Council. The funders had no role in study design, data collection and analysis, decision to publish, or preparation of the manuscript.
Grant Disclosures
The following grant information was disclosed by the authors: University of Sydney International Scholarship.
Australian Research Council.
Competing Interests
The authors declare there are no competing interests.
Author Contributions
• Martyna Molak conceived and designed the experiments, performed the experiments,
analyzed the data, wrote the paper, prepared figures and/or tables, reviewed drafts of the paper.
• Simon Y.W. Ho conceived and designed the experiments, wrote the paper, prepared
figures and/or tables, reviewed drafts of the paper.
Supplemental Information
Supplemental information for this article can be found online athttp://dx.doi.org/ 10.7717/peerj.821#supplemental-information.
REFERENCES
Ballard JW, Kreitman M. 1995.Is mitochondrial DNA a strictly neutral marker?Trends in Ecology and Evolution10:485–488DOI 10.1016/S0169-5347(00)89195-8.
Balloux F, Lehmann L. 2012.Substitution rates at neutral genes depend on population size under fluctuating demography and overlapping generations.Evolution66:605–611
DOI 10.1111/j.1558-5646.2011.01458.x.
Benton MJ, Ayala FJ. 2003.Dating the tree of life.Science300:1698–1700
DOI 10.1126/science.1077795.
Birky Jr CW, Walsh JB. 1988. Effects of linkage on rates of molecular evolution.
Proceedings of the National Academy of Sciences of the United States of America85:6414–6418
DOI 10.1073/pnas.85.17.6414.
Bromham L. 2009.Why do species vary in their rate of molecular evolution?Biology Letters 5:401–404DOI 10.1098/rsbl.2009.0136.
Brower AVZ. 1994.Rapid morphological radiation and convergence among races of the butterfly Heliconius eratoinferred from patterns of mitochondrial DNA evolution. Proceedings of the National Academy of Sciences of the United States of America91:6491–6495
DOI 10.1073/pnas.91.14.6491.
Brown WM, George M, Wilson AC. 1979.Rapid evolution of animal mitochondrial DNA. Proceedings of the National Academy of Sciences of the United States of America76:1967–1971
DOI 10.1073/pnas.76.4.1967.
Brown RP, Yang Z. 2011.Rate variation and estimation of divergence times using strict and relaxed clocks.BMC Evolutionary Biology11:271DOI 10.1186/1471-2148-11-271.
Burridge CP, Craw D, Fletcher D, Waters JM. 2008.Geological dates and molecular rates: fish DNA sheds light on time dependency.Molecular Biology and Evolution25:624–633
DOI 10.1093/molbev/msm271.
Crandall ED, Sbrocco EJ, Deboer TS, Barber PH, Carpenter KE. 2012.Expansion dating: calibrating molecular clocks in marine species from expansions onto the Sunda Shelf following the Last Glacial Maximum. Molecular Biology and Evolution29:707–719
DOI 10.1093/molbev/msr227.
Cutter AD. 2008.Divergence times inCaenorhabditisandDrosophilainferred from direct estimates of the neutral mutation rate.Molecular Biology and Evolution 25:778–786
DOI 10.1093/molbev/msn024.
Debruyne R, Poinar HN. 2009.Time dependency of molecular rates in ancient DNA data sets, a sampling artifact?Systematic Biology58:348–360DOI 10.1093/sysbio/syp028.
Denver DR, Morris K, Lynch M, Thomas WK. 2004.High mutation rate and predominance of insertions in the Caenorhabditis elegansnuclear genome. Nature 430:679–682
DOI 10.1038/nature02697.
dos Reis M, Yang Z. 2013.Why do more divergent sequences produce smaller nonsynony-mous/synonymous rate ratios in pairwise sequence comparisons?Genetics195:195–204
DOI 10.1534/genetics.113.152025.
Drummond AJ, Ho SYW, Phillips MJ, Rambaut A. 2006.Relaxed phylogenetics and dating with confidence.PLoS Biology4:e88DOI 10.1371/journal.pbio.0040088.
Drummond AJ, Pybus OG, Rambaut A, Forsberg R, Rodrigo AG. 2003.Measurably evolving populations.Trends in Ecology and Evolution18:481–488DOI 10.1016/S0169-5347(03)00216-7. Drummond AJ, Rambaut A. 2007.BEAST: Bayesian evolutionary analysis by sampling trees.BMC
Evolutionary Biology7:214DOI 10.1186/1471-2148-7-214.
Duchˆene S, Ho SYW, Holmes EC.Declining transition/transversion ratios through time reveal limitations to the accuracy of nucleotide substitution models.BMC Evolutionary BiologyIn press.
Duchˆene S, Holmes EC, Ho SYW. 2014.Analyses of evolutionary dynamics in viruses are hindered by a time-dependent bias in rate estimates.Proceedings of the Royal Society B—Biological Sciences281:20140732DOI 10.1098/rspb.2014.0732.
Emerson BC. 2007.Alarm bells for the molecular clock? No support for Ho et al.’s model of time-dependent molecular rate estimates.Systematic Biology56:337–345
DOI 10.1080/10635150701258795.
Endicott P, Ho SYW, Metspalu M, Stringer C. 2009.Evaluating the mitochondrial timescale of human evolution.Trends in Ecology and Evolution24:515–521DOI 10.1016/j.tree.2009.04.006. Fleischer RC, McIntosh CE, Tarr CL. 1998.Evolution on a volcanic conveyor belt: using
phylo-geographic reconstructions and K-Ar-based ages of the Hawaiian Islands to estimate molecular evolutionary rates.Molecular Ecology7:533–545DOI 10.1046/j.1365-294x.1998.00364.x. Garc´ıa-Moreno J, Cort´es N, Garcia-Deras GM, Hern´andez-Ba˜nos BE. 2006. Local origin
and diversification amongLampornishummingbirds: a Mesoamerican taxon.Molecular Phylogenetics and Evolution38:488–498DOI 10.1016/j.ympev.2005.08.015.
Genner MJ, Seehausen O, Lunt DH, Joyce DA, Shaw PW, Carvalho GR, Turner GF. 2007. Age of cichlids: new dates for ancient lake fish radiations.Molecular Biology and Evolution 24:1269–1282DOI 10.1093/molbev/msm050.
Gibbons A. 1998.Calibrating the mitochondrial clock.Science279:28–29
DOI 10.1126/science.279.5347.28.
Gignoux CR, Henn BM, Mountain JL. 2011.Rapid, global demographic expansions after the origins of agriculture.Proceedings of the National Academy of Sciences of the United States of America108:6044–6049DOI 10.1073/pnas.0914274108.
Gratton P, Konopi ´nski MK, Sbordoni V. 2008.Pleistocene evolutionary history of the Clouded Apollo (Parnassius mnemosyne): genetic signatures of climate cycles and a ‘time-dependent’ mitochondrial substitution rate.Molecular Ecology17:4248–4262
DOI 10.1111/j.1365-294X.2008.03901.x.
Haag-Liautard C, Dorris M, Maside X, Macaskill S, Halligan DL, Charlesworth B, Keightley PD. 2007.Direct estimation of per nucleotide and genomic deleterious mutation rates inDrosophila. Nature445:82–85DOI 10.1038/nature05388.
Henn BM, Gignoux CR, Feldman MW, Mountain JL. 2009.Characterizing the time dependency of human mitochondrial DNA mutation rate estimates.Molecular Biology and Evolution 26:217–230DOI 10.1093/molbev/msn244.
Hipsley CA, M¨uller J. 2014.Beyond fossil calibrations: realities of molecular clock practices in evolutionary biology.Frontiers in Genetics5:Article 138DOI 10.3389/fgene.2014.00138. Ho SYW. 2014.The changing face of the molecular evolutionary clock.Trends in Ecology and
Evolution29:496–503DOI 10.1016/j.tree.2014.07.004.
Ho SYW, Duchˆene S. 2014.Molecular-clock methods for estimating evolutionary rates and timescales.Molecular Ecology23:5947–5965DOI 10.1111/mec.12953.
Ho SYW, Kolokotronis SO, Allaby RG. 2007.Elevated substitution rates estimated from ancient DNA sequences.Biology Letters3:702–705DOI 10.1098/rsbl.2007.0377.
Ho SYW, Lanfear R, Bromham L, Phillips MJ, Soubrier J, Rodrigo AG, Cooper A. 2011. Time-dependent rates of molecular evolution. Molecular Ecology 20:3087–3101
DOI 10.1111/j.1365-294X.2011.05178.x.
Ho SYW, Larson G. 2006.Molecular clocks: when times are a-changin.Trends in Genetics22:79–83
DOI 10.1016/j.tig.2005.11.006.
Ho SYW, Lo N. 2013.The insect molecular clock.Australian Journal of Entomology52:101–105
DOI 10.1111/aen.12018.
Ho SYW, Phillips MJ, Cooper A, Drummond AJ. 2005.Time dependency of molecular rate estimates and systematic overestimation of recent divergence times.Molecular Biology and Evolution22:1561–1568DOI 10.1093/molbev/msi145.
Ho SYW, Saarma U, Barnett R, Haile J, Shapiro B. 2008.The effect of inappropriate calibration: three case studies in molecular ecology.PLoS ONE3:e1615DOI 10.1371/journal.pone.0001615. Ho SYW, Shapiro B, Phillips MJ, Cooper A, Drummond AJ. 2007.Evidence for time dependency of molecular rate estimates.Systematic Biology56:515–522DOI 10.1080/10635150701435401. Howell N, Smejkal CB, Mackey DA, Chinnery PF, Turnbull DM, Herrnstadt C. 2003. The
pedigree rate of sequence divergence in the human mitochondrial genome: there is a difference between phylogenetic and pedigree rates.American Journal of Human Genetics72:659–670
DOI 10.1086/368264.
Jackson DA, Somers KM. 1991.The spectre of spurious correlations.Oecologia86:147–151
DOI 10.1007/BF00317404.
Jetz W, Thomas GH, Joy JB, Hartmann K, Mooers AO. 2012.The global diversity of birds in space and time.Nature491:444–448DOI 10.1038/nature11631.
Keane TM, Creevey CJ, Pentony MM, Naughton TJ, McLnerney JO. 2006. Assessment of methods for amino acid matrix selection and their use on empirical data shows that ad hoc assumptions for choice of matrix are not justified.BMC Evolutionary Biology6:29
DOI 10.1186/1471-2148-6-29.
Kenney BC. 1982.Beware of spurious self-correlations.Water Resources Research18:1041–1048
DOI 10.1029/WR018i004p01041.
Kumar S. 2005.Molecular clocks: four decades of evolution.Nature Reviews Genetics6:654–662
DOI 10.1038/nrg1659.
Lambert DM, Ritchie PA, Millar CD, Holland B, Drummond AJ, Baroni C. 2002.Rates of evolution in ancient DNA from Ad´elie penguins.Science295:2270–2273
DOI 10.1126/science.1068105.
Lorenzen ED, Nogues-Bravo D, Orlando L, Weinstock J, Binladen J, Marske KA, Ugan A, Borregaard MK, Gilbert MTP, Nielsen R, Ho SYW, Goebel T, Graf KE, Byers D, Stenderup JT, Rasmussen M, Campos PF, Leonard JA, Koepfli KP, Froese D, Zazula G, Stafford Jr TW, Aaris-Sorensen K, Batra P, Haywood AM, Singarayer JS, Valdes PJ, Boeskorov G, Burns JA, Davydov SP, Haile J, Jenkins DL, Kosintsev P, Kuznetsova T, Lai X, Martin LD, McDonald HG, Mol D, Meldgaard M, Munch K, Stephan E, Sablin M, Sommer RS, Sipko T, Scott E, Suchard MA, Tikhonov A, Willerslev R, Wayne RK, Cooper A, Hofreiter M, Sher A, Shapiro B, Rahbek C, Willerslev E. 2011.Species-specific responses of Late Quaternary megafauna to climate and humans.Nature479:359–364
DOI 10.1038/nature10574.
Macey JR, Schulte JA, Ananjeva NB, Larson A, Rastegar-Pouyani N, Shammakov SM, Papenfuss TJ. 1998.Phylogenetic relationships among agamid lizards of theLaudakia caucasiaspecies group: testing hypotheses of biogeographic fragmentation and an area cladogram for the Iranian Plateau.Molecular Phylogenetics and Evolution10:118–131
DOI 10.1006/mpev.1997.0478.
Millar CD, Dodd A, Anderson J, Gibb GC, Ritchie PA, Baroni C, Woodhams MD, Hendy MD, Lambert DM. 2008.Mutation and evolutionary rates in Ad´elie penguins from the Antarctic. PLoS Genetics4:e1000209DOI 10.1371/journal.pgen.1000209.
Navascues M, Emerson BC. 2009. Elevated substitution rate estimates from ancient DNA: model violation and bias of Bayesian methods.Molecular Ecology 18:4390–4397
DOI 10.1111/j.1365-294X.2009.04333.x.
Nei M. 1971.Extinction time of deleterious mutant genes in large populations.Theoretical Population Biology2:419–425DOI 10.1016/0040-5809(71)90030-X.
Obbard DJ, Maclennan J, Kim KW, Rambaut A, O’Grady PM, Jiggins FM. 2012.Estimating divergence dates and substitution rates in theDrosophilaphylogeny.Molecular Biology and Evolution29:3459–3473DOI 10.1093/molbev/mss150.
Papadopoulou A, Anastasiou I, Vogler AP. 2010.Revisiting the insect mitochondrial molecular clock: the mid-Aegean trench calibration.Molecular Biology and Evolution27:1659–1672
DOI 10.1093/molbev/msq051.
Peterson GI, Masel J. 2009.Quantitative prediction of molecular clock andKa/Ksat short
timescales.Molecular Biology and Evolution26:2595–2603DOI 10.1093/molbev/msp175. Phillips MJ. 2009.Branch-length estimation bias misleads molecular dating for a vertebrate
mitochondrial phylogeny.Gene441:132–140DOI 10.1016/j.gene.2008.08.017.
Plazzi F, Ricci A, Passamonti M. 2011.The mitochondrial genome ofBacillusstick insects (Phasmatodea) and the phylogeny of orthopteroid insects.Molecular Phylogenetics and Evolution58:304–316DOI 10.1016/j.ympev.2010.12.005.
R Development Core Team. 2014.R: a language and environment for statistical computing. Vienna: R Foundation for Statistical Computing.Available athttp://www.R-project.org/.
Rambaut A. 2000. Estimating the rate of molecular evolution: incorporating
non-contemporaneous sequences into maximum likelihood phylogenies.Bioinformatics16:395–399
DOI 10.1093/bioinformatics/16.4.395.
Rambaut A, Drummond AJ. 2007.Tracer v1.5, Available fromhttp://beast.bio.ed.ac.uk/Tracer. Reed DL, Light JE, Allen JM, Kirchman JJ. 2007.Pair of lice lost or parasites regained: the
evolutionary history of anthropoid primate lice.BMC Biology5:7DOI 10.1186/1741-7007-5-7. Rieux A, Eriksson A, Li M, Sobkowiak B, Weinert LA, Warmuth V, Ruiz-Linares A, Manica A,
Balloux F. 2014.Improved calibration of the human mitochondrial clock using ancient genomes.Molecular Biology and Evolution31:2780–2792DOI 10.1093/molbev/msu222. Roach JC, Glusman G, Smit AFA, HuffCD, Hubley R, Shannon PT, Rowen L, Pant KP,
Goodman N, Bamshad M, Shendure J, Drmanac R, Jorde LB, Hood L, Galas DJ. 2010. Analysis of genetic inheritance in a family quartet by whole-genome sequencing.Science 328:636–639DOI 10.1126/science.1186802.
Rohland N, Reich D, Mallick S, Meyer M, Green RE, Georgiadis NJ, Roca AL, Hofreiter M. 2010. Genomic DNA sequences from mastodon and woolly mammoth reveal deep speciation of forest and savanna elephants.PLoS Biology8:e1000564DOI 10.1371/journal.pbio.1000564.
Scally A, Durbin R. 2012.Revising the human mutation rate: implications for understanding human evolution.Nature Reviews Genetics13:745–753DOI 10.1038/nrg3295.
Sheets HD, Mitchell CE. 2001.Uncorrelated change produces the apparent dependence of evolutionary rate on interval.Paleobiology27:429–445
DOI 10.1666/0094-8373(2001)027<0429:UCPTAD>2.0.CO;2.
Shields GF, Wilson AC. 1987.Calibration of mitochondrial DNA evolution in geese.Journal of Molecular Evolution24:212–217DOI 10.1007/BF02111234.
Soares P, Abrantes D, Rito T, Thomson N, Radivojac P, Li B, Macaulay V, Samuels DC, Pereira L. 2013.Evaluating purifying selection in the mitochondrial DNA of various mammalian species.PLoS ONE8:e58993DOI 10.1371/journal.pone.0058993.
Soares P, Ermini L, Thomson N, Mormina M, Rito T, Rohl A, Salas A, Oppenheimer S, Macaulay V, Richards MB. 2009. Correcting for purifying selection: an improved human mitochondrial molecular clock.American Journal of Human Genetics84:740–759
DOI 10.1016/j.ajhg.2009.05.001.
Soubrier J, Steel M, Lee MSY, Sarkissian CD, Guindon S, Ho SYW, Cooper A. 2012.The influence of rate heterogeneity among sites on the time dependence of molecular rates. Molecular Biology and Evolution29:3345–3358DOI 10.1093/molbev/mss140.
Subramanian S, Denver DR, Millar CD, Heupink T, Aschrafi A, Emslie SD, Baroni C, Lambert DM. 2009.High mitogenomic evolutionary rates and time dependency.Trends in Genetics25:482–486DOI 10.1016/j.tig.2009.09.005.
Weir JT, Schluter D. 2008.Calibrating the avian molecular clock.Molecular Ecology17:2321–2328
DOI 10.1111/j.1365-294X.2008.03742.x.
Woodhams M. 2006.Can deleterious mutations explain the time dependency of molecular rate estimates?Molecular Biology and Evolution23:2271–2273DOI 10.1093/molbev/msl107. Xue Y, Wang Q, Long Q, Ng BL, Swerdlow H, Burton J, Skuce C, Taylor R, Abdellah Z, Zhao Y,
Asan, MacArthur DG, Quail MA, Carter NP, Yang H, Tyler-Smith C. 2009.Human Y
chromosome base-substitution mutation rate measured by direct sequencing in a deep-rooting pedigree.Current Biology19:1453–1457DOI 10.1016/j.cub.2009.07.032.