2School of Environmental Sciences, University of East Anglia, Norwich, UK
3National Centre for Atmospheric Science, University of Manchester, Manchester, UK 4Department of Chemistry, The University of York, York, UK
5National Centre for Atmospheric Science, University of York, York, UK
6Facility for Groundbased Atmospheric Measurements, University of Manchester, UK Received: 4 May 2011 – Published in Atmos. Chem. Phys. Discuss.: 18 May 2011
Revised: 5 September 2011 – Accepted: 13 September 2011 – Published: 16 September 2011
Abstract. Atmospheric composition affects the radiative balance of the Earth through the creation of greenhouse gases and the formation of aerosols. The latter interact with in-coming solar radiation, both directly and indirectly through their effects on cloud formation and lifetime. The tropics have a major influence on incoming sunlight however the tropical atmosphere is poorly characterised, especially out-side Amazonia. The origins of air masses influencing a mea-surement site in a protected rainforest in Borneo, South East Asia, were assessed and the likely sources of a range of trace gases and particles were determined. This was con-ducted by interpreting in situ measurements made at the site in the context of ECMWF backwards air mass trajectories. Two different but complementary methods were employed to interpret the data: comparison of periods classified by cluster analysis of trajectories, and inspection of the depen-dence of mean measured values on geographical history of trajectories. Sources of aerosol particles, carbon monoxide and halocarbons were assessed. The likely source influences include: terrestrial organic biogenic emissions; long range transport of anthropogenic emissions; biomass burning; sul-phurous emissions from marine phytoplankton, with a pos-sible contribution from volcanoes; marine production of in-organic mineral aerosol; and marine production of halocar-bons. Aerosol sub- and super-saturated water affinity was found to be dependent on source (and therefore composi-tion), with more hygroscopic aerosol and higher numbers of
Correspondence to:H. Coe ([email protected])
cloud condensation nuclei measured in air masses of marine origin. The prevailing sector during the majority of mea-surements was south-easterly, which is from the direction of the coast closest to the site, with a significant influence inland from the south-west. This analysis shows that ma-rine and terrestrial air masses have different dominant chem-ical sources. Comparison with the AMAZE-08 project in the Amazon basin shows Bornean composition to arise from a different, more complex mixture of sources. In particular sulphate loadings are much greater than in Amazonia which is likely to mainly be the result of the marine influence on the site. This suggests that the significant region of the tropics made up of island networks is not well represented by extrap-olation from measurements made in the Amazon. In addi-tion, it is likely that there were no periods where the site was influenced only by the rainforest, with even the most pris-tine inland periods showing some evidence of non-rainforest aerosol. This is in contrast to Amazonia which experienced periods dominated by rainforest emissions.
1 Introduction
The tropics have a large influence on global climate due to the high surface flux of solar radiation, however to date the comprehensive data needed to fully characterise the gas and aerosol composition in these environments has been scarce. The tropics contain about half the World’s forests (Food and Agriculture Organisation, 2010), playing a major role in the global biosphere. This natural background is being affected by anthropogenic activity such as deforestation and land use changes. It is important to assess the extent to which an-thropogenic activities are affecting tropical aerosol, and their subsequent effects on climate.
Intensive field studies have been performed in Amazonia (ACP special issue OP3/ACES: Oxidant and particle pho-tochemical processes above a south-east Asian tropical rain forest), Martin et al., 2010; JGR special issue 107, Avissar et al., 2002) and West Africa (ACPD special issue AMMA Tropospheric Chemistry and Aerosols; Lebel et al., 2010) but until now data from South East Asia has been limited. Specifically, the AMAZE-08 project in Amazonia found that sub-micron aerosol was dominated by biogenic secondary organic aerosol (BSOA) with elevated levels of oxidised or-ganic aerosol (OOA) and sulphate during periods influenced by out-of-basin sources, which were attributed to biomass burning transport from Africa or a marine influence (Chen et al., 2009). The major source of submicron aerosol in West Africa is from biomass burning during the dry season and BSOA during the monsoon season (Capes et al., 2009, 2008). It also experiences high sulphate loadings which may be due to the influence of the Atlantic Ocean, although data cover-age and quality did not allow this to be drawn as a conclusion. Borneo is home to one of the largest expanses of rainfor-est in the world making it an important part of the biosphere and a potentially large source of volatile organic compounds (VOC) and associated BSOA. There is widespread defor-estation on Borneo where land is being given over to log-ging and, particularly, palm oil production (McMorrow and Talip, 2001), meaning the role of the biosphere in the region is changing. Global palm oil production grew by 8 % per year between 1976 and 2006, with the majority of production in Malaysia and Indonesia (Carter et al., 2007). It has been shown that oil palms are a large source of isoprene in Bor-neo (five times more than the rainforest; Hewitt et al., 2009). Isoprene has previously been found to produce secondary or-ganic aerosol (SOA) in chambers and field studies (Claeys et al., 2004; Surratt et al., 2006, 2008; Paulot et al., 2009; Kleindienst et al., 2009; Surratt et al., 2010; Chan et al., 2010) and is thought to produce a substantial fraction of the SOA in Borneo (Robinson et al., 2011). As Borneo is an island, marine influences could be much larger than that in Amazonia and Africa. The oceans are a source of dimethyl sulphide (DMS) produced by phytoplankton (Kloster et al., 2006), minerals contained in sea water (Millero, 1974), halo-carbons (Butler et al., 2007) and OA (O’Dowd et al., 2004; Novakov et al., 1997; Facchini et al., 2008). Borneo has a population of around 16 million people, mostly inhabiting
regions around the coast, so there is potential for influence of anthropogenic pollution in the form of combustion related emissions from transport, power stations or biomass burning. There is an abundance of volcanoes near Borneo which are a known source of sulphurous gases that are processed in the atmosphere to form aerosol (Pandis et al., 1995; Allen et al., 2002), which may contrast to other tropical studies that have not reported a volcanic influence (Chen et al., 2009; Capes et al., 2008).
Measurements were made as part of the Oxidant and Par-ticulate Photochemical Processes Above a South East Asian Rainforest (OP3) project in protected rainforest in Sabah, Borneo (Hewitt et al., 2010). This region extends from around 4◦N to the north coast of the island. Investigating the relationship between composition and synoptic flow can provide insight into significant regional sources. Two differ-ent but complemdiffer-entary methods employing back trajectories are used to attribute geographical sources, which can then be linked to likely emission sources. The focus of the pa-per is on species with a long enough atmospheric lifetime (hours or more) to be suitable for the analyses; mainly sub-micron aerosol composition and physical property measure-ments, but also long lived trace gases such as CO and halo-carbons. Specifically the issues dealt with are the separation of atmospheric species originating on- and off-island and the attribution of likely sources.
2 Methods
2.1 Instrumentation
Measurements were performed at the Bukit Atur site (4◦58′49.33′′N, 117◦50′39.05′′E, 426 m a.s.l.) during two periods: 7 April–4 May I) and 23 June–23 July (OP3-III). Measurements from the intervening period (OP3-II) were made from a different measurement site and are not detailed here. An overview of measurement techniques and a description of the measurement site can be found in the OP3 overview paper, Hewitt et al. (2010). There was poor data coverage during OP3-I and, though air mass characteri-sations of both periods are presented in Sect. 2 for reference, results presented here focus on OP3-III.
7
Jimenez et al., 2009; Morgan et al., 2010). Organic spectra with a lowf44 and highf43 (wherefx denotes the fraction
of the organic mass at m/z =x) are less oxidised and can be thought of as semi-volatile aerosol (SV-OOA) which ex-ist in an equilibrium between the gas and condensed phases. Aerosol with highf44 and lowf43 are more oxidised and can be thought of as low volatility aerosol (LV-OOA) which exists mainly in the condensed phase.
In reality organic aerosol exist in a continuum between these two endpoints that can be expressed by points on a 2-D
f44vs.f43space. The peak atm/z60 can be used as a marker for fresh biomass burning (Alfarra et al., 2007; Capes et al., 2008), being a peak associated with levoglucosan and other anhydrous sugars which are compounds widely reported to be emitted during biomass burning (Simoneit et al., 1999; Jordan et al., 2006). It has been shown that as organic aerosol ages (with increasingf44and decreasingf43) its mass spec-tral signature becomes similar and dominated bym/z44 re-gardless of source (McFiggans et al., 2005; Ng et al., 2010; Morgan et al., 2010).
The unit mass resolution organic aerosol data from the AMS were analysed using positive matrix factorisation (PMF). This is a multivariate technique that endeavours to explain the bulk organic AMS mass spectral time series in terms of time series of differing amounts of static “factor” spectra which can then be linked to distinct components of the ensemble organic aerosol mass (Paatero and Tapper, 1994; Paatero, 1997; Ulbrich et al., 2009). The details of the PMF analysis of the OP3 data were originally published in Robinson et al. (2011). The dependence of the solution on starting parameters (seeds) and rotational ambiguity (fpeak) was explored. In short, the most satisfactory solution was found to be the four factor solution. The results of the PMF analysis are discussed in more detail in Sect. 2.3. The high mass resolution of the AMS also enables the separation of ions at the same unit mass resolution by resolving the ion mass defects.
Subsaturated aerosol water affinity was measured as a function of size using a single column Hygroscopicity Tandem Differential Mobility Analyser (HTDMA; Cubison
RH) aerosol size, selected using Vienna style differential mo-bility analysers (DMA; Winklmayr et al., 1991). The HT-DMA measured at six sizes between 32 and 258 nm and the CCNc measured at 11 diameters between 57 and 224 nm. Aerosol optical absorption was measured with a Thermo Scientific model 5012 Multi Angle Absorption Photometer (MAAP; Petzold and Schonlinner, 2004) which reports in black carbon equivalent loading.
The halocarbon measurements were made using gas chromatography-mass spectrometry (GC-MS). The analysis was conducted on-site at Bukit Atur. Whole air samples were dried using a Nafion contra-flow drier and were pre-concentrated using a Markes International UNITY and On-line Air Server with a Carbograph B and Carboxen 1000 trap. The UNITY was coupled to the Agilent 6890 GC and the MS5973 N mass spectrometer. The results presented here are from analysis on this GC-MS system in negative ion chemi-cal ionization (NICI) mode (Worton et al., 2008). Litre sam-ples were taken hourly (collected over a period of 40 min) from a position 30 m up the GAW tower (Hewitt et al., 2010) and separated on a Restek RTX-502.2 column. Calibrations were performed every 8 samples using the UEA 2006 Stan-dard reference gas which is calibrated against the “NOAA 2003” scale for CHBr3, CH2Br and CH3Br and the “NOAA 2004” scale for CH3I (Laboratory Earth Systems Research Global Monitoring Division, 2008). Gas phase CO measure-ments were made using an Aerolaser AL5002 fluorescence instrument (Gerbig et al., 1999).
2.2 Analysis of back trajectories
of the ground measurement site and a pressure altitude of 950 hPa, and were calculated backwards for the preceding seven days with a 30 min time resolution. No trajectories im-pacted the surface during the time-scales investigated.
Two distinct but complementary methods were used to in-terpret back trajectories: construction of a map showing the dependence of the mean value of the studied quantity mea-sured at the site on air mass residence time in specific re-gions; and a comparison of periods classified by cluster anal-ysis of trajectories. These methods provide a means of sepa-rating influences of different geographical locations on mea-surements made from the ground site. Elevated measurement values associated with regions can in turn be attributed to likely sources. Similar approaches have been used in the past to assess sources: for example, in Mace Head, West-ern Ireland, Cape et al. (2000) used trajectory cluster anal-ysis to interpret trace gas measurements and Bassford et al. (1999) used a residence time analysis to separate two discrete sources of methyl iodide – a coastal source and a sub-tropical Atlantic ocean source. The trajectory residence time analy-sis was pioneered by Ashbaugh (1985) who used it to at-tribute measurements of sulphate aerosols made in the Grand Canyon National Park to source regions. These methods are particularly useful in analysing the OP3 data as the complex local topography at the measurement site means local wind vector data are likely not to be representative of the direction of air mass origin. While ECMWF trajectories do not explic-itly represent complex terrain and boundary layer processes, they should still be a good indicator of regional synoptic transport over the time scales presented here. The analyses presented are suited to analysis of species with a long atmo-spheric lifetime compared to the trajectory durations used, i.e. for species such as aerosol particles, carbon monoxide and halocarbons which are the focus of this paper.
Typically, of the seven day trajectories, only the 36 h clos-est to the measurement site were used, although the seven day trajectories are discussed for context in Sect. 3.1. Many of the species studied here have atmospheric lifetimes longer than this and it is possible that more insight into far field sources could be gained from their use, however we focus on shorter trajectories to minimise the introduction of erroneous analysis. This is caused by: the “shadowing” effect demon-strated in Sect. 2.2.1 below; the dependence of the density of trajectory data points on proximity to the receptor site which is inherent in the polar geometry; and the increase in the er-ror of modelled trajectories with increased time calculated backwards.
2.2.1 Residence time analysis of back trajectories
The statistical method first described by Ashbaugh (1985) was extended to give an indication of geographical origins of measurements made at the ground site. For a given measure-ment, a geographical grid is constructed – all grids presented here used a cell size of 0.1◦×0.1◦. Maps of trajectory
res-idence time are shown in Fig. 1 for 36 h back trajectories during OP3-I and OP3-III. These are calculated by counting the number of trajectory data points in each cell for all tra-jectories and normalising to the probability density function inherent in the polar geometry. The polar probability density function can be calculated using
fij(r)=
1
2π Rr (1)
whereR is the limit of the radial distance from the origin of the trajectories andr is the mean distance of each cell from origin of the trajectories (Ashbaugh, 1985). To assess the dependence of a measured quantity on air mass history, the value at the observing site at the time of arrival of a given tra-jectory is added to the grid cell that contains each tratra-jectory point. Doing this for all trajectories and dividing by the total number of trajectory points in each cell gives the mean value measured at the ground site for an air mass that has passed over that cell. These plots are henceforth referred to as mean value maps.
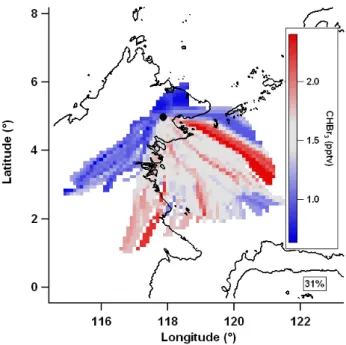
Figure 2 shows an example mean value map of bromo-form (CHBr3) during OP3-III. Measurement techniques are detailed in Sect. 2.1. In interpreting mean value maps it is im-portant to remember that air mass trajectories that regularly travel through a non-source region before travelling through a source region will show artificially elevated levels in the non-source region, henceforth called “shadowing”. For ex-ample, in Fig. 2 there appears to be bromoform south of the site in the region around 1.5◦N, 117◦E, however this may be artificial if the east coast is a source region. A similar ar-gument can be made if trajectories regularly travel through a source region before travelling through a removal region (for example a region of elevated levels of precipitation act-ing to remove aerosol) resultact-ing in the source region not be-ing resolved. As a wider range of conditions are sampled, these artificial data would be expected to be of less impor-tance with unaffected data dominating. It is also the case in general that increasing data coverage will tend to resolve sources more accurately as the influence of isolated events is outweighed by representative conditions. In order to as-sess the potential extent of these effects, the percentage of the entire set of calculated back trajectories that was used in the construction of each mean value map is displayed. It is also important to be able to quantify the degree of similarity between different mean value maps. This is done by calcu-lating the Pearson’s r of a scatter plot of the intensities of corresponding grid points.
2.2.2 Agglomerative hierarchical cluster analysis of back trajectories
(a) (b)
Fig. 1.Residence time of air masses in previous 36 h for all trajectories during(a)OP3-I and(b)OP3-III. Colour is number of trajectory data points (normalised to geometric probability density function), expressed in the resulting procedure defined units (p.d.u.). Trajectory receptor site (the measurement site) marked with a black dot.
Fig. 2. Example mean value map of bromoform (CHBr3) during
OP3-III using 36 h trajectories. Grey is median value, red is greater than median, blue is less than median and white denotes no data coverage. Percentage of trajectories used denoted below key.
average linkage method was used based on calculating the squared distance between trajectories at each time step using
d(xi,xj)=
X
k
n
(xki−xkj)2+(yki−ykj)2+(pki−pkj)2
o (2)
wherexk, yk and pk are the coordinates of xi or xj. At
each step in the analysis the two clusters with the lowest
squared distance are agglomerated. This continues until all trajectories are in one cluster. The optimum number of clus-ters may then be chosen, so as to maximize between cluster variance and minimize within cluster variance (Cape et al., 2000). The choice of the optimum number of clusters is subjective, however this has been shown to be the most ap-propriate technique for analysing meteorological trajectories (Kalkstein et al., 1987). The suitability of a solution of N
clusters can be assessed using several scores. An increase in the root mean squared (RMS) distance between clusters in-dicates that two dissimilar clusters have been agglomerated (Cape et al., 2000). A sharp decrease of the coefficient of determinationR2, defined as
R2=1−X N
(within cluster variance)
(variance of all trajectories) (3)
is a subjective indicator of the number of clusters to retain (Kalkstein et al., 1987). Similarly to Morgan et al. (2009) and Cape et al. (2000), an indication of the number of major clusters is defined as the number of clusters containing more than 3 % of the total number of trajectories.
(a) (b)
Fig. 3.R2, RMS and number of major clusters (containing>3 % of trajectories) as a function of number of clusters in solution for(a)OP3-I and(b)OP3-III. Solid lines are for one subset of trajectories and dashed lines are for the other.
averages are discussed in Sect. 3 and presented in full in Ta-ble 4.
In order to establish the robustness of the solution, the tra-jectories were split into two subsets: two day back trajec-tories of one hour time resolution released every two hours were used, with the alternate set similar but using trajecto-ries from the intervening hours. The reduction in trajectory time resolution was necessary to improve computational ef-ficiency. For both OP3-I and OP3-III, cluster scores (Fig. 3) and means (Figs. 4 and 5) show little difference between tra-jectory subset showing the cluster analysis solutions to be stable to perturbations, and are combined for classification and all subsequent analysis.
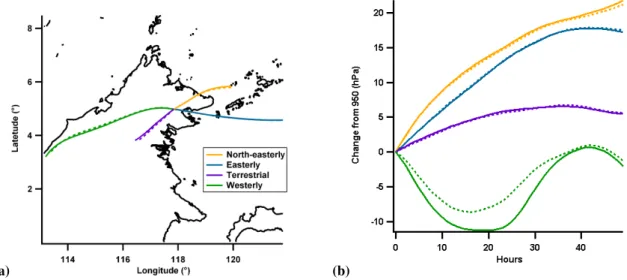
The scores for OP3-I (Fig. 3a) show the first major step change at the four cluster solution which is summarised in Fig. 4 and Table 1. Italics will be used for clarity when re-ferring to cluster names, which are defined in Figs. 4 and 5. The main influence on the site is split evenly between the North-easterly,EasterlyandTerrestrialclusters. Air masses associated with theWesterlycluster. Air masses associated with theWesterlycluster are of minor influence, making up only 3 % of the classified periods, and can generally be dis-regarded.
The scores from OP3-III (Fig. 3b) show the first major step change at the five cluster solution which is summarised in Fig. 5 and Table 2. The major influence on the site was from the south-westerly Marine cluster. The Coastal cluster from the south and the Terrestrial cluster from the south-west also had significant influence. There were two more clusters; the North-easterlyandWesterlybut both are of minor influence (consisting of 3 % and 5 % of classified periods, respectively) and can generally be disregarded. Figure 10, Sect. 3.1, shows the clusters influencing the measurement site during OP3-III (displayed as a coloured bar) for comparison to the aerosol composition data.
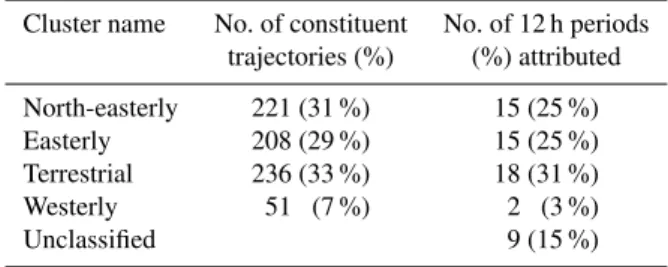
Table 1.Details of four cluster solution and resultant period classi-fication for OP3-I.
Cluster name No. of constituent No. of 12 h periods trajectories (%) (%) attributed
North-easterly 221 (31 %) 15 (25 %) Easterly 208 (29 %) 15 (25 %) Terrestrial 236 (33 %) 18 (31 %) Westerly 51 (7 %) 2 (3 %)
Unclassified 9 (15 %)
Table 2.Details of five cluster solution and resultant period classi-fication for OP3-III.
Cluster name No. of constituent No. of 12 h periods trajectories (%) (%) attributed
North-easterly 41 (5 %) 2 (3 %) Marine 460 (58 %) 33 (50 %) Coastal 107 (14 %) 5 (8 %) Terrestrial 141 (18 %) 10 (15 %) Westerly 41 (5 %) 3 (5 %)
Unclassified 13 (20 %)
2.3 Positive matrix factorisation of organic aerosol mass spectra
(a) (b)
Fig. 4. OP3-I cluster mean(a)latitude and longitude and(b)pressure altitude in units of hPa different from starting altitude of 950 hPa. Colours are consistent between plots. Solid and dashed lines show solutions from each subset.
(a) (b)
Fig. 5. OP3-III cluster mean(a)latitude and longitude and(b)pressure altitude in units of hPa different from starting altitude of 950 hPa. Colours are consistent between plots. Solid and dashed lines show solutions from each subset.
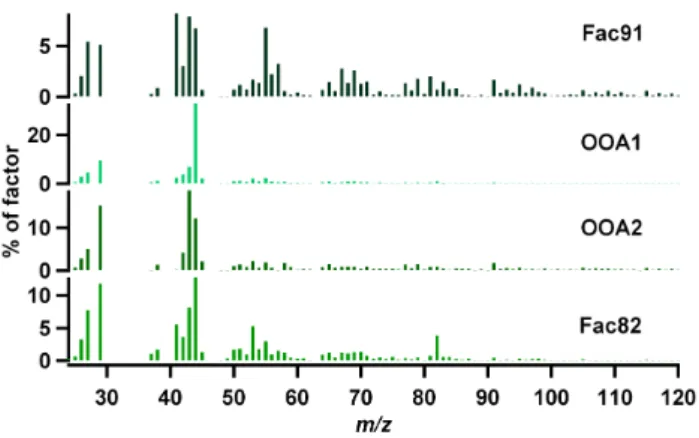
The four factors can be attributed sources from inspection of the mass spectral signature as follows. The first factor, named 91Fac, shows some similarities to previously pub-lished mass spectra of biomass burning emissions (Alfarra et al., 2007; Allan et al., 2010) for instance a prominentm/z 91 peak, which can be indicative of aromatic species. It does not show them/z60 and 73 peaks normally associated with levoglucosan, an established biomass burning marker in AMS measurements (Alfarra et al., 2007). However these levoglucosan peaks have been shown to reduce with ageing of biomass burning aerosol (Capes et al., 2008), implying the 91Fac may be from far field biomass burning emissions.
The second and third factors are named OOA1 and OOA2 respectively because of their similarity to previously
Fig. 6. Factor spectra for the four factor, fpeak= −1 solution of PMF analysis of organic mass spectra. From top to bottom, spectra are 91Fac, OOA1, OOA2 and 82Fac.
The last factor, named 82fac because of its prominentm/z 82 peak, is not similar to any mass spectra widely reported in the literature. Its measurement during the OP3 project was reported in Robinson et al. (2011) who provide evidence that it is associated that it is the product of isoprene oxida-tion. A similar factor has since been reported in rural North America where it was also associated with isoprene oxida-tion (Slowik et al., 2011). Further investigaoxida-tion into the likely sources linked to these factors will be made through the anal-ysis presented in this paper.
3 Results
3.1 Overview of measurements and their regional setting
The major cities in Borneo are all located on the coast, with the biggest settlements on the south west of the is-land. The interior of Borneo is a mountainous unsettled and undeveloped region of rainforest. Average daily large scale precipitation from the ECMWF Integrated Forecasting Sys-tem model reanalysis shows increased precipitation in the interior of Borneo (Fig. 7; BADC, 2006b). It is likely that this increased precipitation is due to the orography inland. Precipitation inhibits long range transport of aerosol. This means air masses from the southwest of the site will tend to have reduced concentrations of background aerosol. These air masses will have relatively greater amounts of locally pro-duced aerosol.
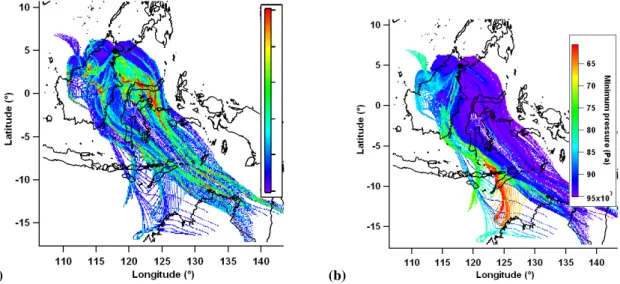
Figure 8 shows a trajectory residence time plot, and the av-erage minimum pressure (maximum altitude) of the trajecto-ries passing through each cell, both using seven day back tra-jectories. These provide context for the more detailed anal-yses presented herein which use shorter (36 h) trajectories. This means the more detailed analyses only use trajectory data from relatively close to the receptor site where they are
Fig. 7. Average daily large scale precipitation (m) from the European Centre for Medium-Range Weather Forecast Integrated Forecasting System model reanalysis (BADC, 2006b) at 1.125◦× 1.125◦resolution during OP3-III. Values below 2×10⁻³m are not shown for clarity.
most accurate and their density is highest. The residence time plot shows that the site is mostly influenced by air masses from the south east. There is no influence from the major ur-banised regional areas in mainland Malaysia (around Kuala Lumpur, east of Borneo), Singapore (south west of Borneo) and Indonesia (around Jakarta, south west of Borneo). Many air masses travel over Sulawesi (around 2◦S, 121◦E). The majority of the 16 million people inhabiting Sulawesi live at the far south. The plot showing the average minimum pres-sure of trajectories passing over each cell shows trajectories travelling over the island to generally be from a greater maxi-mum altitude than trajectories transported from the east coast of Borneo. The distribution of trajectory minimum pressures has a mean of 909 hPa, median of 938 hPa and a tenth centile value of 821 hPa. This corresponds to a ninetieth per-centile maximum altitude of approximately 1.8 km a.s.l. with the majority of trajectories having a maximum altitude close to that of the receptor site.
(a) (b)
Fig. 8. (a)Residence time of air masses in previous 7 d for all trajectories during OP3-III. Colour is number of trajectory data points (normalised to geometric probability density function). (b)mean minimum pressure of trajectories passing through that cell in in previous 7 d. Trajectory receptor site (the measurement site) marked with a black dot.
15
10
5
0
-5
-10
Latitude (°)
130 120
110 100
Longitude (°)
350
340
330
320
310
Brightness temp (K)
Fig. 9. MODIS hotspot/active fires coloured by temperature of event during OP3-III. Site marked with green star.
to have the most biomass burning influence due to on-island fires, and perhaps fires further afield on the Lesser Sunda Is-lands in South East Indonesia (around 7◦S by 125◦E).
Aerosol measurements made in Borneo show a contrasting situation to Amazonia with much higher sulphate and ammo-nium loadings, much more similar to those measured in West Africa (Table 3). The time series of aerosol composition is shown in Fig. 10 with a bar indicating the classification of the air mass (see Sect. 2.2.2) influencing the measurement site.
3.2 Halocarbons
21/06/2008 01/07/2008 11/07/2008 21/07/2008 Date and time (local)
3.0
2.0
1.0
0.0 2.5
2.0
1.5
1.0
0.5
0.0
Aerosol Loading (µg m
-3 )
1.0
0.5
0.0
POI 1 POI 2
Inorganics Sulphate Ammonium Nitrate Chloride
Organics OOA1 82Fac 91Fac OOA2
equiv. black carbon W Coastal Marine NE Terrestrial Class
Mean
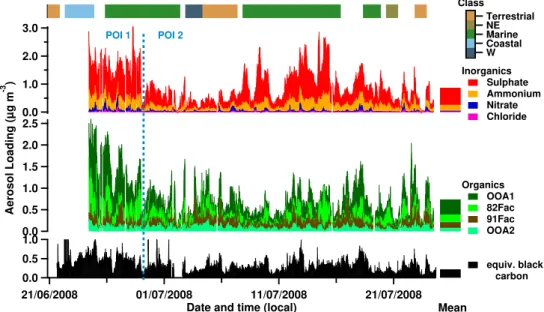
Fig. 10.Stacked time series of total sub-micron non-refractory aerosol split by composition (see Sect. 2.1) for OP3-III. The inorganics and organics are shown on separate axes, with the organics split into their constituent PMF factors. The split point between Period Of Interest (POI) One and Two is marked with a dashed blue line (see Sect. 3.6). The campaign mean aerosol loadings are shown as stacked bars to the right of the time series. Colour of bar at top indicates class of air mass influencing site (see Sect. 2). No bar indicates unclassified (changeable) air mass.
value maps. In particular the methyl iodide and polybromi-nated mean value maps all show a region of high values off the coast to the immediate east of Bukit Atur which extends east (to around 4◦N, 120◦E). This shared feature suggests a co-located source of methyl iodide and the polybromi-nated compounds; possibly it is even the same source, po-tentially macro algae, which have been shown to produce all three of these compounds (Carpenter and Liss, 2000; Manley et al., 1992). Other studies have observed correlations be-tween methyl iodide and these polybrominated compounds, but noted the inconsistency of their correlation, suggesting different production mechanisms for the methyl iodide and polybrominated compounds (Butler et al., 2007). Methyl iodide shows less separation between terrestrial and marine air masses than the polybrominated compounds. This con-sistent with previous studies, which have shown methyl io-dide to have a mixture of marine and terrestrial sources (Bell et al., 2002; Smythe-Wright et al., 2006; Sive et al., 2007) and be emitted during biomass burning (Cox et al., 2005; Mead et al., 2008).
In stark contrast to the other three halocarbons presented here the waters immediately east of Bukit Atur around 4◦N, 120◦E do not appear to be a productive region for methyl bromide (Fig. 11b). There is some marine contribution, pre-dominantly from the coastal zone south of Sabah included in the extent of these maps, which is consistent with known ma-rine sources of methyl bromide such as macro algae (Baker, 2001; Cox et al., 2005). Higher values (8–9 pptv) are seen over an area to the north of Bukit Atur (5.4–6◦N) covering
Table 3.Comparison of sub-micron non-refractory aerosol loadings (µg m−3) from different tropical campaigns. Bornean and
Amazo-nian (Chen et al., 2009) measurements are campaign averages of ground site intensives. West African measurements are averages of low altitude data over several flights, screened to remove (local) biomass burning and anthropogenic influence (Capes et al., 2008, 2009).
Borneo Amazonia West Africa
Organic 0.74 0.64 1.01 Sulphate 0.61 0.15 0.82 Ammonium 0.21 0.02 0.36
Total 1.6 0.82 2.26
(a) (b)
Fig. 11.Mean value maps for(a)methyl iodide, CH3I and(b)methyl bromide CH3Br. Grey is median value, red is greater than median, blue is less than median and white denotes no data coverage. 36 h trajectories used.
in a similar location to that seen in the methyl iodide map though the exact grid boxes differ. As discussed earlier small scale biomass burning may be a contributing factor to this feature, in addition tropical vegetation has been suggested as a weak source of methyl bromide (Blei et al., 2010).
3.3 Nitrate and chloride aerosol
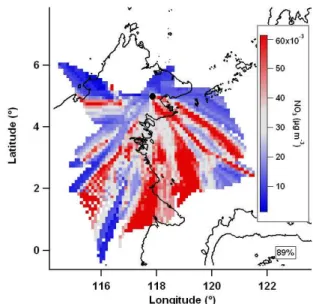
The nitrate (Fig. 12) and chloride (not shown) mean value maps and time series are similar (r=0.76) suggesting the two species may be components of the same aerosol. The greatest aerosol loadings are mostly associated with ma-rine air from the south-east. Elevated loadings shown to the far south over the Sangkulirang Peninsula (around 1◦N, 117.5◦E) may be artificial, caused by the preceding or sub-sequent transit of the air mass over the sea. Cluster aver-ages show nitrate and chloride to be associated with air of marine origin, with greater loadings in theMarine cluster than the Terrestrial. Campaign average loadings of nitrate (0.03 µg m−3) and chloride (0.01 µg m−3) are very low how-ever they are high when compared to Amazonia (0.01 µg m−3 and 0.00 µg m−3, respectively). The diurnal profile of nitrate and chloride loadings shows them to be strongly elevated around midnight with low levels throughout the day.
Nitrate (NO−3) is produced in the atmosphere by oxidation of NOxon the time-scale of hours. Hewitt et al. (2009) found that NOxlevels in Borneo, while typically lower than those found in more developed countries such as USA and Europe, were highest over the oil palm plantations where the sources were vehicle emissions, combustion and crop fertilisation. The AMS nitrate loading is derived from two fragments (NO+and NO+
2 atm/z30 and 46) and during OP3 these var-ied, indicating that the nitrate that is detected is unlikely to be purely in the form ammonium nitrate (NH4NO3), as this is
Fig. 12. Mean value map for nitrate. Grey is median value, red is greater than median, blue is less than median and white denotes no data coverage. 36 h trajectories are used.
known to fragment consistently. The ratio of the mean ambi-ent NO+and NO+
2 signals is significantly greater than during calibrations using ammonium nitrate (5.4 vs. 2.6). The AMS has been shown to be poor at measuring organic nitrates di-rectly as CxHyN+or CxHyOzN+(Farmer et al., 2010), with significant mass (30 %) detected at the NO+
and NO+2 (r=0.29), implying any role of organic nitrates to be low.
A likely source of chloride containing aerosol is sodium chloride particles from sea water, however the AMS cannot measure sea salt particles well as they are usually too large to be successfully sampled and they vapourise slowly (Al-lan et al., 2004). There is no excess ammonium (NH4) de-tected after the neutralisation of sulphate in Borneo, mean-ing nitric acid will not readily be neutralised. The introduc-tion of nitric acid (HNO3) to aqueous sodium chloride par-ticles would force the chloride to partition to the gas phase in the form of hydrogen chloride (HCl). This leads to aque-ous sodium nitrate particles that are more easily volatilised by the AMS. The liberated hydrogen chloride can then react to form aerosol which is detected by the AMS. While there are no direct measurements of the composition of the chlo-ride containing aerosol, it is likely that they are in the form ammonium chloride.
The nitrate and chloride diurnal profiles show a very strong increase at night, which may be driven by partitioning of vapours as the temperature reduces. A dense layer of fog formed across the forest every night which may have facili-tated nitrate and chloride aerosol reformation occurring in the aqueous phase. Furthermore, the measurement site, located on a ridge top, protruded above the planetary boundary layer top every night (Pearson et al., 2010) which may have intro-duced more marine influenced aerosol that would be typical of the regional background.
3.4 Organic aerosol
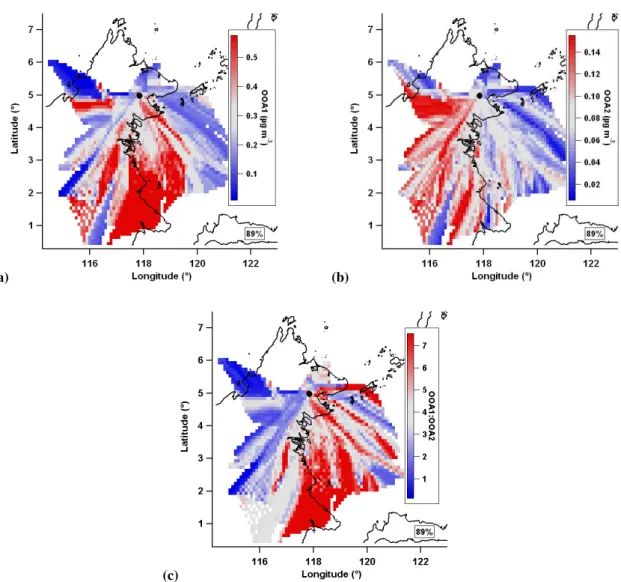
The OOA1 mean value map shows both off-island and on-island sources (Fig. 13a). TheMarineandTerrestrialperiod averages (0.33 and 0.29 µg m−3, respectively) show, while both sources are significant, the off island source is larger. The greatest concentrations of OOA1 are in marine/coastal air masses. These are likely to be the result of long range transport of highly oxidised regional emissions with a possi-ble contribution from processed biomass burning at the start of the measurement period (see Sect. 3.6). It is likely that the on island source of OOA1 represents the aged component of BSOA from the rainforest and the components of regional long range transport aerosol that is not removed through wet deposition during transit across the island. The inland OOA1 is changeable, showing both high and low loadings, and it is conceivable that the amount of inland OOA1 is driven by the level of precipitation inland.
The OOA2 mean value map (Fig. 13b) shows a strongly terrestrial source of aerosol, withMarineandTerrestrial pe-riod loadings of 0.11 and 0.07 µg m−3, respectively. It shows elevated loadings across much of the island with the ex-ception of the known oil palms to the immediate north and south of the measurement site. This suggests the rainfor-est is a source of freshly produced BSOA from the oxida-tion of rainforest VOC emissions which are represented by
the OOA2 factor. OOA2 is a relatively minor fraction of the total organic aerosol, making up only 11 % compared to OOA1 which makes up 47 %. This is expected in an en-vironment such as Borneo where there are influences from far field sources such as off-island anthropogenic sources and OA from oceanic emissions, meaning more aged organic aerosol could dominate.
The ratio of mean value maps of OOA1 to OOA2 (ex-tent of oxidation; Fig. 13) shows the oxidised aerosol to be originating externally to the island compared to the less ox-idised aerosol which originates in the island interior. This implies the highly oxidised OA is from long range transport of aerosols that are emitted from sources external to the is-land, either biogenic or anthropogenic. Figure 13 shows low OA oxidation in air masses travelling across the centre of the island, a region of enhanced precipitation (Fig. 7). Wet re-moval of aerosol is likely to lead to depleted concentrations of regional aerosol (highly aged OA) and relatively increased concentrations of more locally produced aerosol. This local aerosol is likely to be BSOA generated from rainforest pro-duced precursors as there were not any other major sources known to be nearby (e.g. biomass burning, large settlements), especially in the inland region.
(a) (b)
(c)
Fig. 13. (a)OOA1,(b)OOA2 and(c)the ratio of the OOA1 and OOA2 mean value maps, equivalent to OA oxidation. Grey is median value, red is greater than median, blue is less than median and white denotes no data coverage. 36 h trajectories are used.
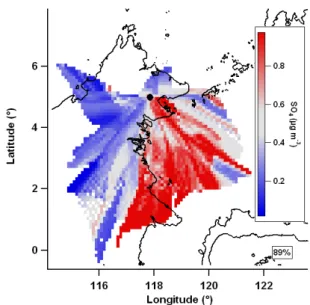
heterogeneous reactive uptake of 1,4-hydroxycarbonyls (es-tablished isoprene oxidation products) to condensed phase species likely to yield them/z82 peak (Lim and Ziemann, 2009). The mean value map of excess sulphate (Fig. 14) shows the main source to the south-east of the site, in one of the regions associated with isoprene SOA. It should be noted that sulphate aerosol that is neutralised by the time of arrival at the measurement may be acidic closer to the coast where it has had less time to be neutralised by terrestrial ammonium sources.
3.5 Sulphate aerosol
The mean value map correlation (r=0.93) suggests that sul-phate (Fig. 15) and ammonium are components of the same aerosol, with the ion balance indicating this is likely in the form of ammonium sulphate. Cluster averages of ammonium
and sulphate show greater loadings in theMarinecluster than in the Terrestrial cluster (0.25 vs. 0.09 µg m−3 for ammo-nium and 0.75 vs. 0.25 µg m−3 for sulphate, respectively), which is consistent with the mean value maps.
(a) (b)
Fig. 14. Mean value maps of(a)82Fac and(b)excess sulphate (defined as moles of charge of sulphate greater than moles of charge of ammonium plus 3×10⁻⁹to account for spread of neutral values). Grey is median value, red is greater than median, blue is less than median
and white denotes no data coverage. 36 h trajectories are used.
acid peak (MSA; CH3SO3H) of the high resolution AMS mass spectrum as a marker for DMS derived sulphate aerosol (Zorn et al., 2008). The yield of MSA relative to sulphate from atmospheric DMS oxidation has been shown to be much lower in tropical conditions (Bates et al., 1992; Allan et al., 2009) and no MSA signal was apparent in the Borneo dataset.
Volcanic activity was reported around the time of the OP3 project from Ruang (735 m), an island north of Sulawesi, In-donesia, East of Borneo and Mount Papandayan (2665 m) on Java, Indonesia, to the South of Borneo (Venzke et al., 2010), and could be responsible for some of the sulphate aerosol de-tected. However, if the back trajectories are assumed to be reliable when extended to the seven day limit (Fig. 8), these regions did not influence the site.
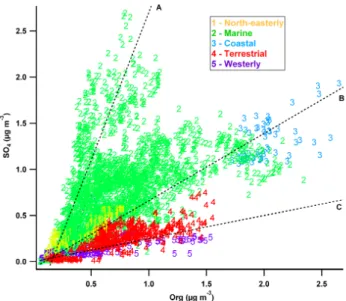
A scatter plot of sulphate loading vs. OA loading, coloured by cluster, is shown in Fig. 16, similar to the method used in Chen et al. (2009) when analysing aerosol composition in Amazonia. Figure S1 of the Supplement shows the same scatter plot coloured bym/z44:43 (OA oxidation). Lines in-dicate the modal centres of the histogram of values of the sulphate to OA ratio. It should be noted that some level of correlation is to be expected between aerosol loadings due to shared removal processes, hence points at all three lines show a degree of correlation. Line A indicates points of high sulphate concentration with little dependence on OA loading, which are characteristically associated with theMarine clus-ter. They also show a varied level of OA oxidation. They are consistent with sources of sulphate external to Borneo that are not necessarily associated with production of OA – such as marine DMS production or volcanic emissions.
Line B indicates points of correlated high sulphate and OA concentration which are characteristically associated with
Fig. 15. Sulphate mean value map. Grey is median value, red is greater than median, blue is less than median and white denotes no data coverage. 36 h trajectories are used.
Fig. 16. SO4 loading vs. OA loading coloured and numbered by
cluster. Lines, labelled with letters, indicate different proposed de-pendencies. Lines represent modes of the SO4:org ratio histogram
of values.
the aerosol whose sulphate and organic mass correlate along line B result from long range transport, which may well be a combination of anthropogenic and biogenic sources. Bio-genic sources of organic matter are most likely to be of ter-restrial origin and those of sulphate are likely to be marine in nature.
Line C indicates points of high OA loading with a weaker dependence on sulphate loading, which are characteristically associated with theTerrestrial andWesterlyclusters. They show a range of levels of OA oxidation. This is consistent with biogenic production of SOA, providing a mixture of more and less aged OA.
For the region including the measurement site and the sea to the south-east, where the majority of sulphate containing air masses came from: DMS emissions from phytoplank-ton are predicted to contribute around 30–40 % of total col-umn sulphate (Gondwe, 2003; Kloster et al., 2006); around 40–50 % of surface sulphate is predicted to be from anthro-pogenic emissions (Tsai et al., 2010) with<10 % of surface sulphate concentrations predicted to be from shipping emis-sions (Capaldo et al., 1999); and around 30 % of surface sul-phate predicted from volcanic emissions (Graf et al., 1997).
It is likely that the apparent elevated sulphate loadings over the oil palms to the south-east of the site are mainly due to the preceding transport of the air across marine source regions. There may also be elevated sulphate loadings due to the prox-imity of marine sources such as DMS production and ship-ping as well as an increased anthropogenic influence. The fact that sulphate and ammonium loadings are depleted in-land is probably due to the wet removal of the aerosols as
vs. 0.27 µg m−3), CO (177 vs. 98 ppb; Fig. 17), BC (0.36 vs. 0.18 µg m−3; Fig. 18) and 91Fac (0.15 vs. 0.12 µg m−3; Fig. 19) than POI2. These quantities are all indicative of pollution. The 91Fac factor may suggesting biomass burn-ing specifically due to its resemblance to previously reported biomass burning spectra (Alfarra et al., 2007; Allan et al., 2010), although it is a minor factor making up only 18 % of total OA mass over the whole project. Trajectories also tended to be influenced by air masses that have higher max-imum altitudes during POI1 compared to POI2, with me-dian minimum trajectory pressures of 880 hPa vs. 946 hPa and tenth percentile pressures of 653 hPa vs. 886 hPa, respec-tively.
During POI2, CO and 91Fac show strongly on-island sources implying that biomass burning still influences the site, albeit to a lesser extent. It is less evident that an on-island source of BC dominates during POI2, with elevated amounts to the south, both on and off-island. There is a disparity between inland BC and CO measurements dur-ing POI2, with the dominant CO source bedur-ing inland and the dominant BC source being more coastal and marine. This would be explained if the BC and CO were emitted from biomass burning on the south coast of Borneo (or even fur-ther upwind) and then transported across the island. The BC would be depleted inland through wet removal but the CO concentrations would be largely unaffected. Any BC from shipping off the east coast that was insignificant compared to biomass burning emissions in POI1 would then be apparent in POI2. Modelled loadings of BC (0.2–0.5 µg m−3for the region; Koch et al., 2009) are consistent with the BC equiva-lent loadings for POI1 and POI2.
(a) (b)
Fig. 17.Mean value maps of CO during(a)POI 1 and(b)POI 2. Colour scale is centred round the median value of the CO mean value map for the whole campaign.
(a) (b)
Fig. 18.Mean value maps of aerosol absorbance (expressed as black carbon equivalent loading) during(a)POI 1 and(b)POI 2. The colour scale is centred round the median value of the BC mean value map for the whole campaign.
or more local on-island biomass burning emissions. It is also the case that air masses during POI1 descended from higher altitudes than POI2, with mean minimum pressures of 838 hPa and 931 hPa and tenth percentile values of 652 hPa and 886 hPa, respectively. The introduction of free tropo-spheric air may increase the dominance of biomass burning species which are likely to be transported from their source to the upper troposphere by pyroconvection.
It is possible that there is an oxidised aerosol influence from the south eastern coast of the island, particularly during POI1. The enhanced OOA1 loadings during POI1 may be due to processed emissions from biomass burning. In POI2 the majority of oxidised aerosol is in air masses external to the island, implying long range transport of OA. Taking this
into consideration, it is likely that the OOA1 in POI1 is from a combination of long range transport of OA and on-island production and ageing of biomass burning OA. Further sepa-ration of these sources during POI1 is not possible given the short time scale and small range of trajectories sampled.
(a) (b)
Fig. 19.Mean value maps of 91Fac during(a)POI 1 and(b)POI 2. Colour scale is the consistent between plots and is centred round the median value of the 91Fac mean value map for the whole campaign.
these aerosols are thought to be marine in origin (sulphate and chloride) or formed by reaction with marine aerosol (am-monium and nitrate). While 82Fac is not thought to be ma-rine in origin, it is associated with mama-rine air masses as these pass over the oil palm plantation to the south east of the site. It can also be speculated that some other controlling factor involved in the 82Fac OA was increased during POI1 (e.g. sulphate aerosol acidity or oxidation rates). Acidic sulphate has previously been shown to affect isoprene SOA formation and (Slowik et al., 2011) also showed theirm/z82 containing PMF factor may be associated with elevated sulphate concen-trations. However, it appears that 82Fac shows little relation to the biomass burning markers throughout the project, sug-gesting that the increase during POI1 is unrelated to biomass burning. OOA2 showed a very slight decrease in loadings be-tween POI1 and POI2 (0.09 vs. 0.08 µg m−3), however this change is so small as to be within the uncertainty of the in-strument and analysis methods.
3.7 Dependence of hygroscopicity on regional source
Figure 20 shows mean value maps of hygroscopicity mea-surements for two given aerosol sizes. These are represen-tative of other measured sizes, with an averager=0.9 for six sizes between 32 and 258 nm for the GF90 mean value maps and an averager=0.7 for ten sizes between 57 and 202 nm for the SScrit mean value map. A complete discus-sion of aerosol hygroscopicity and its relation to composi-tion and size is detailed in Irwin et al. (2010). The subsat-urated growth factor (between 0 and 90 % relative humid-ity; GF90) shows good separation between terrestrial and marine air masses for both sizes, with higher aerosol GF90 measured in air of marine origin. Critical supersaturation (SScrit) shows highest values from the south-west and east
(a) (b)
(c) (d)
Fig. 20.Mean value maps of: sub-saturated growth factor for(a)53 nm particles and(b)155 nm particles; and critical supersaturation for
(c)63 nm particles and(d)149 nm particles. Grey is median value, red is greater than median, blue is less than median and white denotes no data coverage. 36 h trajectories are used.
4 Summary
In general, many species demonstrated an association with either terrestrial or marine air masses. These are represented by data from theTerrestrialandMarineclusters which are displayed in Table 4. The analysis of halocarbons shows bromoform and dibromomethane to be strongly associated with coastal and marine air mass. These species are estab-lished marine tracers and this result provides validation for the back trajectory analysis presented here. Particularly high mixing ratios were observed in air masses associated with an area of seaweed cultivation directly east of the site. Methyl iodide was associated with similar air masses as the poly-brominated compounds but it is unclear if it is produced from similar sources or by a different mechanism. It shows some departure from the polybrominated compounds, with inland levels not as uniformly low. Elevated inland values are also present in the methyl bromide mean value map. Methyl
91Fac* (µg m−3) 0.16(0.1500..2109) 0.12(0.0900..1505) 0.13(0.1000..1705) Sulphate* (µg m−3) 0.27(0.260.35
0.19) 0.75(0.7100..9940) 0.61(0.5000..8928) 0.04 0.30 0.15
Ammonium* (µg m−3) 0.09(0.0900..1205) 0.25(0.2400..3513) 0.21(0.1900..3109) 0.02 Nitrate* (µg m−3) 0.03(0.0200..0401) 0.04(0.0300..0502) 0.04(0.0200..0501) 0.01 Chloride* (µg m−3) 0.01(0.000.01
0.00) 0.01(0.0100..0100) 0.01(0.0100..0100) 0.00
Absorbance* (µg m−3) 0.19(0.1600..2809) 0.21(0.1700..2909) 0.22(0.1800..3109) Hygroscopicity
GF90* [53 nm] 1.30(1.2911..3427) 1.42(1.4111..4536) 1.38(1.3811..4332)
GF90* [155 nm] 1.46(1.4911..5241) 1.58(1.5811..6253) 1.53(1.5411..6046)
SScrit* [63 nm] 0.63(0.6300..6761) 0.48(0.4700..5541) 0.53(0.5400..6345)
SScrit* [149 nm] 0.26(0.2500..3118) 0.20(0.1700..2315) 0.22(0.2000..2716) Gas composition
CO* (ppbv) 111(110116105) 98.4(94.310886.8) 101(10011089.4) CHBr3* (pptv) 1.10(1.1301..2896) 1.61(1.5611..7938) 1.48(1.4511..7517)
CH2Br2* (pptv) 0.81(0.8300..8580) 0.95(0.9500..9991) 0.91(0.9300..9885)
CH3I* (pptv) 1.03(1.0801..1297) 1.09(1.0810..1899) 1.08(1.0810..1899)
CH3Br (pptv) 6.73(6.6867..3923) 6.92(6.9076..2335) 6.80(6.697.21 6.16)
Particulate nitrate and chloride show very similar time se-ries trends and their mean value maps show their association with marine air. They exhibit a consistent diurnal profile with sharply elevated levels around midnight. Inspection of the AMS mass spectral information shows that the nitrate is un-likely to be present as ammonium nitrate or organic nitrates. The sea is an established source of sodium chloride aerosol, however this is not generally detected due to its slow vapouri-sation time in the AMS. Nitric acid may be produced by pro-cessing of biogenic NOxfrom soil (particularly from the fer-tilised oil palms plantations) and anthropogenic NOx emis-sions from settlements on the coast. This nitric acid could displace chloride from marine sodium chloride particles to give aqueous sodium nitrate aerosol that is more efficiently vapourised by the AMS than sodium chloride. It is likely that the liberated chloride is detected in the form of ammo-nium chloride although it is unclear if this is the case. The
little sulphate influence (0.04 µg m−3). These were deemed to be influenced mainly by BSOA freshly produced from rainforest VOC emissions. The out-of-basin periods, com-prising 30 % of the project, were less dominated by OA (0.8 µg m−3), which was more oxidised, with more sulphate influence (0.3 µg m−3). During these periods the measure-ment site was more influenced by long range transport of emissions from a variety of sources, probably processed DMS emissions from the Atlantic and biomass burning from West Africa. This is in contrast to Borneo which experienced much higher sulphate loadings (0.61 µg m−3). A study in West Africa measured similarly high levels of sulphate as were observed during OP3, which may be due to the marine influences during the West African monsoon phase.
Organic aerosol is most oxidised in marine air masses. Sulphate was associated with marine air masses and showed varying levels of correlation with organic aerosol. Sul-phate unassociated with organic aerosol showed an off-island source and is likely to be mainly from the processing of ma-rine DMS emissions. Air masses travelling over the moun-tainous interior of Borneo show depressed levels of regional background aerosol which is probably due to greater wet re-moval by orographically induced convective precipitation. These air masses are also associated with less oxygenated OA, presumably because the removal of regional aerosol in-creases the relative dominance of BSOA produced close to the measurement site. It should be noted that the sulphate loading inTerrestrialair masses (which are most representa-tive of rainforest conditions) is even greater than the out-of-basin classified data from Amazonia. This implies that, while regional aerosol is probably being depleted inland through wet deposition, a significant amount of aerosol is transported across the length of the island. Emissions from agriculture seemed to influence the site with isoprenoid BSOA show-ing elevated levels over the major oil palm plantations to the north and south of the site, which is consistent with measure-ments showing oil palm to emit five times as much isoprene as the natural rainforest (Hewitt et al., 2009).
OA associated with sulphate also showed an off-island source and an increased level of oxidation. This is likely to be long range transport of internally mixed aerosol. The sources are likely to be a combination of both anthropogenic and biogenic sources of both OA and sulphate but the OA has aged considerable during transport. It is unclear how much of this background signal is biogenic, anthropogenic or pyrogenic. It is also possible that the organic background may be wholly or in part due to marine biological sources (O’Dowd et al., 2004). A fraction of the OA showed only a weak association with sulphate. This predominantly arose during air periods influenced by on-island air masses and is likely to be biogenic aerosol from processing of VOCs emitted by the rainforest. Emissions from the rainforest in Borneo are likely to be measured at Bukit Atur as relatively fresh aerosol and so would be expected to be represented by OOA2 and 82Fac, plus some fraction of OOA1. Considering
only periods influenced byTerrestrialair masses, this gives an estimated loading of between 0.23 and 0.52 µg m−3, com-pared to 0.5 µg m−3of OA seen in-basin in Amazonia. This lower contribution from the Bornean rainforest is likely to be mainly due to the difference in the size of the source regions. The beginning of the campaign was dominated by high aerosol loadings, due in particular to sulphate and the organic OOA1 and 82Fac PMF factors. This period was also associ-ated with increased CO, BC, 91Fac and all inorganic species. The MODIS satellite shows this to be a period of enhanced fire activity around the coast of Borneo, particularly on the southwest of the island. The beginning of the measurement period is influenced by coastal air running up the east coast of Borneo. It is likely that the increased biomass burning ac-tivity caused the increased CO, BC and 91Fac loadings. It is also likely that processed organic biomass burning emis-sions contributed to the increased OOA1 loadings. It is pos-sible that some of the sulphate aerosol is from condensation of gases emitted from biomass burning. However, the cor-relation is not high (r=0.45) between the OOA1 and sul-phate time series during POI1 suggesting that, if this is oc-curring, it is a relatively small contribution. In addition to aerosol emissions from biomass burning, the enhanced inor-ganic and OOA1 aerosol loadings during POI1 could be due to the dominance of coastal air, a reduction in precipitation causing less wet removal, or an increase in oxidation rates. The latter two could themselves be consequences of biomass burning emissions.
Aerosol hygroscopicity showed marked differences be-tween terrestrial and marine air masses, however the data coverage does not include the period of more intense biomass burning. The most hygroscopic aerosol associated with the same air masses as high ammonium sulphate concentrations. As sulphate aerosol is more hygroscopic than (even highly oxidised) organic aerosol, the sulphate to organic mass ra-tio would be expected to be the driving factor in the aerosol hygroscopicity.
5 Conclusions
The results are consistent with a regional background of sul-phate and aged organic aerosol that is removed by wet de-position in the interior of Borneo. This may be expected on an island, where off-island sources are likely to be distant enough to contribute to an aged background. Seven day air mass trajectories show the site was influenced by the least populated areas with the least amount of detected fires, when compared to the wider region. Given this it is likely that bio-logical sources dominated the regional background.
the regional background, however inspection of seven day back trajectories were not associated with areas of particu-larly high fire activity in the region. There also appears to be a minor influence at night from marine chloride reacting with terrestrial nitrate.
In general Borneo shows a wider range of influences than Amazonia. Despite data coverage lower than other compara-ble analyses the methods proved useful in assessing the ori-gin of species measured. This study shows that the Amazon, whilst clearly an important part of the biosphere, is not repre-sentative of the tropics as a whole. The “maritime continent” region needs to be considered separately from the Amazon, as being a heterogeneous and complex mixture of biogenic, marine and anthropogenic influence.
Supplementary material related to this article is available online at:
http://www.atmos-chem-phys.net/11/9605/2011/ acp-11-9605-2011-supplement.pdf.
Acknowledgements. Thanks to Gavin McMeeking (Colorado State
University) and Mathew Evans (The University of Leeds) for useful conversations in the preparation of this manuscript. Thanks also to Minnie Wong (Fire Information and Resource Management System) for providing archived MODIS fire data. The OP3 project was funded by the UK Natural Environment Research Council [grant number NE/D002117/1]. We thank the Malaysian and Sabah Governments for their permission to conduct research in Malaysia; the Malaysian Meteorological Department (MMD) for access to the Bukit Atur Global Atmosphere Watch station and their long term ozone record; Leong Chow Peng (formerly of MMD) for her support in the early stages of the project; Waidi Sinun of Yayasan Sabah and his staff and Glen Reynolds of the Royal Society’s South East Asian Rain Forest Research Programme and his staff for logistical support at the Danum Valley Field Centre; the NERC Facility for Ground-based Atmospheric Measurements and Halo Photonics for support with the LIDAR deployment; Phua Mui How of the University Malaysia Sabah for his help with the land cover map; and the rest of the OP3 project team for their individual and collective efforts. This is paper number 525 of the Royal Society’s South East Asian Rainforest Research Programme.
Edited by: R. MacKenzie
Williams, P. I., Coe, H., Baker, A. R., Martino, M., Nieder-meier, N., Wiedensohler, A., Lehmann, S., M¨uller, K., Her-rmann, H., and McFiggans, G.: Composition and properties of atmospheric particles in the eastern Atlantic and impacts on gas phase uptake rates, Atmos. Chem. Phys., 9, 9299–9314, doi:10.5194/acp-9-9299-2009, 2009.
Allan, J. D., Williams, P. I., Morgan, W. T., Martin, C. L., Flynn, M. J., Lee, J., Nemitz, E., Phillips, G. J., Gallagher, M. W., and Coe, H.: Contributions from transport, solid fuel burning and cooking to primary organic aerosols in two UK cities, Atmos. Chem. Phys., 10, 647–668, doi:10.5194/acp-10-647-2010, 2010. Allen, A. G., Oppenheimer, M. F., Baxter, P. J., Hor-rocks, L. A., Galle, B., McGonigle, A. J. S., and Duf-fell, H. J.: Primary sulfate aerosol and associated emissions from Masaya Volcano, Nicaragua, J. Geophys. Res., 107, 4682, doi:10.1029/2002JD002120, 2002.
Andreae, M. O., Berresheiem, H., Bingemer, H., Jacob, D. J., Lewis, B. L., Li, S.-M., and Talbot, R. W.: The atmospheric sul-fur cycle over the Amazon Basin. II. Wet season, J. Geophys. Res., 95, 16813–16824, doi:10.1029/JD095iD10p16813, 1990. Ashbaugh, L.: A residence time probability analysis of sulfur
con-centrations at grand Canyon National Park, Atmos. Environ., 19, 1263–1270, doi:10.1016/0004-6981(85)90256-2, 1985. Avissar, R., Silva Dias, P., Silva Dias, M., and Nobre, C. A.:
The Large-Scale Biosphere-Atmosphere Experiment in Amazo-nia (LBA): insights and future research needs, J. Geophys. Res., 107, 8086, doi:10.1029/2002JD002704, 2002.
British Atmospheric Data Centre: European Centre for Medium-Range Weather Forecasts back trajectories, http://badc.nerc.ac. uk/data/ecmwf-op/ (last access: January 2010), 2006a.
British Atmospheric Data Centre: European Centre for Medium-Range Weather Forecasts. ECMWF Operational Analysis data, http://badc.nerc.ac.uk/view/badc.nerc.ac. uk ATOM dataent ECMWF-OP (last access: October 2010), 2006b.
Baker, J.: Emissions of CH3Br, organochlorines, and organoiodines from temperate macroalgae, Glob. Change Sci., 3, 93–106, doi:10.1016/S1465-9972(00)00021-0, 2001.
Bassford, M. R., Nickless, G., Simmonds, P. G., Lewis, A. C., Pilling, M. J., and Evans, M. J.: The concurrent observation of methyl iodide and dimethyl sulphide in marine air; implications for sources of atmospheric methyl iodide, Atmos. Environ., 33, 2373–2383, doi:10.1016/S1352-2310(98)00403-8, 1999. Bates, T. S., Calhoun, J. A., and Quinn, P. K.: Variations in the
aerosol particles over the South Pacific Ocean, J. Geophys. Res., 95, 813–816, 1992.
Bell, N., Hsu, L., Jacob, M., Schultz, M. G., Blake, D. R., But-ler, J. H., King, D. B., Lobert, J. M., and Maier-Reimer, E.: Methyl iodide: atmospheric budget and use as a tracer of ma-rine convection in global models, J. Geophys. Res., 107, 4340, doi:10.1029/2001JD001151, 2002.
Blei, E., Hardacre, C. J., Mills, G. P., Heal, K. V., and Heal, M. R.: Identification and quantification of methyl halide sources in a lowland tropical rainforest, Atmos. Environ., 44, 1005–1010, doi:10.1016/j.atmosenv.2009.12.023, 2010.
Butler, J. H., King, D. B., Lobert, J. M., Montzka, S. A., Yvon-Lewis, S. A., Hall, B. D., Warwick, N. J., Mondeel, D. J., Ay-din, M., and Elkins, J. W.: Oceanic distributions and emissions of short-lived halocarbons, Global Biogeochem. Cy., 21, GB1023, doi:10.1029/2006GB002732, 2007.
Canagaratna, M. R., Jayne, J. T., Jimenez, J. L., Allan, J. D., Al-farra, M. R., Zhang, Q., Onasch, T. B., Drewnick, F., Coe, H., Middlebrook, A., Delia, A., Williams, L. R., Trimborn, A. M., Northway, M. J., DeCarlo, P. F., Kolb, C. E., Davidovits, P., and Worsnop, D. R.: Chemical and microphysical characterization of ambient aerosols with the aerodyne aerosol mass spectrome-ter., Mass Spectrom. Rev., 26, 185–222, doi:10.1002/mas.20115, 2007.
Capaldo, K., Corbett, J. J., Kasibhatla, P., Fischbeck, P., and Pan-dis, S. N.: Effects of ship emissions on sulphur cycling and ra-diative climate forcing over the ocean, Nature, 400, 743–746, doi:10.1038/23438, 1999.
Cape, J. N., Methven, J., and Hudson, L. E.: The use of tra-jectory cluster analysis to interpret trace gas measurements at Mace Head, Ireland, Atmos. Environ., 34, 3651–3663, doi:10.1016/S1352-2310(00)00098-4, 2000.
Capes, G., Johnson, B., McFiggans, G., Williams, P. I., Hay-wood, J., and Coe, H.: Aging of biomass burning aerosols over West Africa: aircraft measurements of chemical composition, microphysical properties, and emission ratios, J. Geophys. Res., 113, D00C15, doi:10.1029/2008JD009845, 2008.
Capes, G., Murphy, J. G., Reeves, C. E., McQuaid, J. B., Hamil-ton, J. F., Hopkins, J. R., Crosier, J., Williams, P. I., and Coe, H.: Secondary organic aerosol from biogenic VOCs over West Africa during AMMA, Atmos. Chem. Phys., 9, 3841–3850, doi:10.5194/acp-9-3841-2009, 2009.
Carpenter, L. J. and Liss, P. S.: On temperate sources of bromoform and other reactive organic bromine gases, J. Geophys. Res., 105, 20539–20547, doi:10.1029/2000JD900242, 2000.
Carter, C., Finley, W., Fry, J., Jackson, D., and Willis, L.: Palm oil markets and future supply, Eur. J. Lipid Science Technol., 109, 307–314, doi:10.1002/ejlt.200600256, 2007.
Chan, M. N., Surratt, J. D., Claeys, M., Edgerton, E. S., Tan-ner, R. L., Shaw, S. L., Zheng, M., Knipping, E. M., Ed-dingsaas, N. C., Wennberg, P. O., and Seinfeld, J. H.: Charac-terization and quantification of isoprene-derived epoxydiols in ambient aerosol in the Southeastern United States, Environ. Sci. Technol., 44, 4590–4596, 2010.
Chen, Q., Farmer, D. K., Schneider, J., Zorn, S. R., Heald, C. L., Karl, T. G., Guenther, A., Allan, J. D., Robinson, N., Coe, H., Kimmel, J. R., Pauliquevis, T., Borrmann, S., P¨oschl, U., An-dreae, M. O., Artaxo, P., Jimenez, J. L., and Martin, S. T.: Mass spectral characterization of submicron biogenic organic
parti-cles in the Amazon Basin, Geophys. Res. Lett., 36, L20806, doi:10.1029/2009GL039880, 2009.
Cheung, Y. K., and Klot, J. H.: The Mann Whitney Wilcoxon Distribution Using Linked Lists, Statistica Sinica, 7, 805-813, , 1997.
Claeys, M., Graham, B., Vas, G., Wang, W., Vermeylen, R., Pashyn-ska, V., Cafmeyer, J., Guyon, P., Andreae, M. O., Artaxo, P., and Maenhaut, W.: Formation of secondary organic aerosols through photooxidation of isoprene, Science, 303(5661), 1173– 1176, doi:10.1126/science.1092805, 2004.
Cox, M. L., Sturrock, G. A., Fraser, P. J., Siems, S. T., and Krum-mel, P. B.: Identification of regional sources of methyl bromide and methyl iodide from AGAGE observations at Cape Grim, Tas-mania, J. Atmos. Chem., 50, 59–77, doi:10.1007/s10874-005-2434-5, 2005.
Cross, E., Slowik, J., Davidovits, P., Allan, J., Worsnop, D., Jayne, J., Lewis, D., Canagaratna, M., and Onasch, T.: Labora-tory and ambient particle density determinations using light scat-tering in conjunction with aerosol mass spectrometry, Aerosol Sci. Technol., 41, 343–359, doi:10.1080/02786820701199736, 2007.
Cubison, M., Coe, H., and Gysel, M.: A modified hygro-scopic tandem DMA and a data retrieval method based on optimal estimation, J. Aerosol Sci., 36, 846–865, doi:10.1016/j.jaerosci.2004.11.009, 2005.
Davies, D. K., Ilavajhala, S., Wong, M. M., and Justice, C. O.: Fire information for resource management system: archiving and dis-tributing MODIS active fire data, IEEE Trans. Geosci. Remote S., 47, 72–79, doi:10.1109/TGRS.2008.2002076, 2009. DeCarlo, P. F., Kimmel, J. R., Trimborn, A., Northway, M. J.,
Jayne, J. T., Aiken, A. C., Gonin, M., Fuhrer, K., Horvath, T., Docherty, K. S., Worsnop, D. R., and Jimenez, J. L.: Field-deployable, high-resolution, time-of-flight aerosol mass spec-trometer, Anal. Chem., 78, 8281–8289, 2006.
Denman, K., Brasseur, G., Chidthaisong, A., Ciais, P., Cox, P., Dickinson, R., Hauglustaine, D., Heinze, C., Holland, E., Ja-cob, D., Lohmann, U., Ramachandran, S., Dias, P. D. S., Wofsy, S., and Zhang, X.: Couplings Between Changes in the Climate System and Biogeochemistry, Chap. Couplings, Cam-bridge University Press, CamCam-bridge, UK and New York, NY, USA, 2007.
Facchini, M. C., Decesari, S., Rinaldi, M., Carbone, C., Finessi, E., Mircea, M., Fuzzi, S., Moretti, F., Tagliavini, E., Ceburnis, D., and O’Dowd, C. D.: Important source of marine secondary or-ganic aerosol from biogenic amines, Environ. Sci. Technol., 42, 9116–9121, doi:10.1021/es8018385, 2008.
Farmer, D. K., Matsunaga, A., Docherty, K. S., Surratt, J. D., Se-infeld, J. H., Ziemann, P. J., and Jimenez, J. L.: Response of an aerosol mass spectrometer to organonitrates and organosulfates and implications for atmospheric chemistry, P. Natl. Acad. Sci. USA, 107, 6670–6675, doi:10.1073/pnas.0912340107, 2010. Food and Agriculture Organisation: Global Forest Resources
As-sessment 2010: Main Report, Bernan Assoc, Rome, http://books. google.com/books?id=vEcJTwEACAAJ\&pgis=1 (last access: January 2011), 2010.