ACPD
14, 13021–13058, 2014Tropospheric ozone variability over the
Mediterranean
C. Doche et al.
Title Page
Abstract Introduction
Conclusions References
Tables Figures
◭ ◮
◭ ◮
Back Close
Full Screen / Esc
Printer-friendly Version Interactive Discussion
Discussion
P
a
per
|
Discus
sion
P
a
per
|
Discussion
P
a
per
|
Discussion
P
a
per
|
Atmos. Chem. Phys. Discuss., 14, 13021–13058, 2014 www.atmos-chem-phys-discuss.net/14/13021/2014/ doi:10.5194/acpd-14-13021-2014
© Author(s) 2014. CC Attribution 3.0 License.
This discussion paper is/has been under review for the journal Atmospheric Chemistry and Physics (ACP). Please refer to the corresponding final paper in ACP if available.
Summertime tropospheric ozone
variability over the Mediterranean basin
observed with IASI
C. Doche1,*, G. Dufour1, G. Foret1, M. Eremenko1, J. Cuesta1, M. Beekmann1, and P. Kalabokas2,3
1
Laboratoire Inter-universitaire des Systèmes Atmosphériques (LISA), Universités Paris-Est Créteil et Paris Diderot, CNRS, Créteil, France
2
Academy of Athens, Research Center for Atmospheric Physics and Climatology, Athens, Greece
3
European Commission, JRC, Institute for Environment and Sustainability, Air and Climate Unit, Ispra, Italy
*
now at: Météo France, Direction Inter-Régionale Sud-Ouest, Division Etudes et Climatologie, Mérignac, France
Received: 28 February 2014 – Accepted: 9 May 2014 – Published: 21 May 2014
Correspondence to: C. Doche ([email protected])
ACPD
14, 13021–13058, 2014Tropospheric ozone variability over the
Mediterranean
C. Doche et al.
Title Page
Abstract Introduction
Conclusions References
Tables Figures
◭ ◮
◭ ◮
Back Close
Full Screen / Esc
Printer-friendly Version Interactive Discussion
Discussion
P
a
per
|
Discus
sion
P
a
per
|
Discussion
P
a
per
|
Discussion
P
a
per
|
Abstract
The Mediterranean basin is one of the most sensitive regions of the world regarding climate change and air quality. This is partly due to the singular dynamical situation of the Mediterranean basin that leads to among the highest tropospheric ozone concen-trations over the Northern Hemisphere. Six years of summertime tropospheric ozone
5
observed by the IASI instrument from 2007 to 2012 have been analysed to document the variability of ozone over this region. The satellite observations have been also ex-amined in parallel with meteorological analyses (from ECMWF) to understand the pro-cesses that drive this variability. This work confirmed the presence of a steep west–east ozone gradient in the lower troposphere with the highest concentrations observed over
10
the eastern part of the Mediterranean basin. This gradient is mainly explained by the diabatic convection over the Persian Gulf during the Indian Monsoon, which induces an important subsidence of ozone rich air masses from the upper to the lower tro-posphere over the central and the eastern Mediterranean basin: IASI observations of ozone concentrations at 3 km height show a clear summertime maximum in July that is
15
well correlated to the maximum of downward transport of rich-ozone air masses from the upper troposphere. Even if this feature is robust over the six analyzed years, we have also investigated monthly ozone anomalies, one positive (June 2008) and one negative (June and July 2009) using daily observations of IASI. We show that the rel-ative position and the strength of the meteorological systems (Azores anticyclone and
20
Middle eastern depression) present over the Mediterranean are key factors to explain both the variability and the anomalies of ozone in the lower troposphere in this region.
1 Context and problematic
Lower tropospheric ozone (O3) is a harmful pollutant for both human health and vegeta-tion (Levy et al., 2001; Fuhrer, 2009). In the higher troposphere, ozone acts as a
power-25
ACPD
14, 13021–13058, 2014Tropospheric ozone variability over the
Mediterranean
C. Doche et al.
Title Page
Abstract Introduction
Conclusions References
Tables Figures
◭ ◮
◭ ◮
Back Close
Full Screen / Esc
Printer-friendly Version Interactive Discussion
Discussion
P
a
per
|
Discus
sion
P
a
per
|
Discussion
P
a
per
|
Discussion
P
a
per
|
depends on the meteorological conditions driving vertical and horizontal transport and on the production of ozone by the photo-oxidation of its precursors (mainly nitrogen ox-ides NOx and volatile organic compounds VOCs; Delmas et al., 2005; Camredon and Aumont, 2007; Jacob, 2000). Studying ozone variability concerns both climate change and air quality (Volz-Thomas et al., 2003).
5
The Mediterranean basin is sensitive to both climate change and atmospheric pollu-tion, mainly during summer. Indeed, climate change experts expect an intensification of the summertime dryness (IPCC, 2007) which is typical for this region. The combination of the specific meteorological conditions prevailing during summer and the regional air pollution emissions produce an enhancement of lower tropospheric ozone
concentra-10
tions over this area (Nolle et al., 2001; Lelieveld et al., 2002; Kalabokas and Repapis, 2004; Velchev et al., 2011). These summertime meteorological conditions are char-acterised by a high pressure ridge over the western Mediterranean basin and a deep trough extending from the Persian Gulf to the eastern Mediterranean basin (Fig. 1a). The western ridge results from the spreading of the Azores anticyclone, which leads
15
to low winds, persistent clear sky conditions, and high solar irradiation. The eastern trough is associated to the strong convection from the summertime Indian monsoon (Fig. 1b; for further information see also Alpert et al., 2005). Indeed, the ascending motion induced by the Indian monsoon produces a cellular circulation, which leads to strong descending winds just over the Central and eastern Mediterranean. This
cor-20
responds to one of the strongest occurrences of subsidence over the entire Northern Hemisphere (about 0.15 Pa s−1in the south of Greece, see Fig. 1b and also Ziv et al., 2004). In addition, a lower tropospheric north–south circulation, referred as Etesian winds, occurs over the Central Mediterranean basin between these two meteorologi-cal systems (eastward of Greece on Fig. 1c; Ziv et al., 2004). These meteorologimeteorologi-cal
25
ACPD
14, 13021–13058, 2014Tropospheric ozone variability over the
Mediterranean
C. Doche et al.
Title Page
Abstract Introduction
Conclusions References
Tables Figures
◭ ◮
◭ ◮
Back Close
Full Screen / Esc
Printer-friendly Version Interactive Discussion
Discussion
P
a
per
|
Discus
sion
P
a
per
|
Discussion
P
a
per
|
Discussion
P
a
per
|
Moreover, the persistence of anticyclonic conditions, associated with high solar irra-diation and low winds, can induce photochemical ozone production in the plume of the densely urbanized areas located along the Mediterranean coasts, although the re-gional background ozone levels are generally more important (Kalabokas and Repapis, 2004).
5
Over the eastern Mediterranean basin, the presence of an ozone pool in the middle troposphere has been made evident by several observational and modeling studies (e.g., Marenco et al., 1998; Stohl et al., 2001; Jonson et al., 2001; Li et al., 2001; Roelofs et al., 2003; Liu et al., 2009; Zanis et al., 2014). Most of these studies sug-gest that this ozone pool is likely produced by downward transport from the upper
10
troposphere and lower stratosphere. Also, the impact of European emissions on ozone concentrations over the eastern basin within the boundary layer has been underline by Richards et al. (2013) even if this contribution remains limited. Kalabokas et al. (2013) show that high ozone concentrations in the lower troposphere are related to an-ticyclonic events, which reinforce subsidence and the Etesian advection of potentially
15
ozone-enriched air masses coming from Europe. On the other hand, they show that low ozone concentrations in the lower troposphere are related to cyclonic conditions, characterized by advection of oceanic air masses poor in ozone from the Atlantic to the Mediterranean. These studies are mainly based on in-situ observations (Kalabokas et al., 2013, 2008) that are accurate (vertical profiles and surface stations) but cannot
20
provide a complete description of the spatial and temporal ozone variability in the lower troposphere over the entire basin. Model simulations have been used by Richards et al. (2013) and Zanis et al. (2014) to describe the tropospheric ozone distribution, although their coarse resolution may induce potentially large uncertainties.
To complement these model and in situ measurements approaches, satellite
obser-25
com-ACPD
14, 13021–13058, 2014Tropospheric ozone variability over the
Mediterranean
C. Doche et al.
Title Page
Abstract Introduction
Conclusions References
Tables Figures
◭ ◮
◭ ◮
Back Close
Full Screen / Esc
Printer-friendly Version Interactive Discussion
Discussion
P
a
per
|
Discus
sion
P
a
per
|
Discussion
P
a
per
|
Discussion
P
a
per
|
plement in situ observations with their large spatial coverage and good horizontal res-olution. Thermal infrared nadir sounders like the Tropospheric Emission Spectrometer (TES) instrument (Beer et al., 2001) aboard EOS-AURA and the Infrared Atmospheric Sounding Interferometer (IASI) instrument aboard MetOp (Clerbaux et al., 2009) offer a maximum of sensitivity in the mid-troposphere with an effective vertical resolution of
5
about 6–7 km and have been used to study atmospheric composition and transport, climate and air quality (e.g., Worden et al., 2008; Jones et al., 2008; Eremenko et al., 2008; Boynard et al., 2009; Dufour et al., 2010; Safieddine et al., 2013). Richards et al. (2013) and Zanis et al. (2014) have used ozone observations derived from TES and/or GOME-2 to confirm the presence of the ozone pool over the eastern Mediterranean
10
basin. In the present study, ozone observations derived with the approach developed by Eremenko et al. (2008) from IASI measurements are used to document the spa-tiotemporal variability of lower and upper tropospheric ozone over the Mediterranean basin during summertime. One advantage of IASI with respect to TES is that IASI’s scanning capacity offers a quasi-global coverage twice a day with dense horizontal
15
sampling (pixels spaced by 25 km at nadir). Moreover, compared to UV sounders, IASI measurements exhibit much better sensitivity to lower tropospheric ozone concentra-tions (Cuesta et al., 2013; Foret et al., 2014). In the present study, six years of IASI ob-servations are analysed and compared to meteorological reanalyses from the ECMWF ERA-Interim model in order to make evident the role of the atmospheric dynamical
pro-20
cesses on the tropospheric ozone distribution and its variability over the Mediterranean basin. This study complements previous studies adding a new independent set of ob-servations with relatively fine horizontal resolution and good sensitivity for the lower tropospheric ozone. Due to the very large number of individual measurements, using IASI observations allow us to conduct month-to-month analyses (for summer periods)
25
ACPD
14, 13021–13058, 2014Tropospheric ozone variability over the
Mediterranean
C. Doche et al.
Title Page
Abstract Introduction
Conclusions References
Tables Figures
◭ ◮
◭ ◮
Back Close
Full Screen / Esc
Printer-friendly Version Interactive Discussion
Discussion
P
a
per
|
Discus
sion
P
a
per
|
Discussion
P
a
per
|
Discussion
P
a
per
|
The IASI ozone observations used for the present study are described in Sect. 2 as well as the meteorological data and the analysis method. In Sect. 3, the spatiotem-poral variability of summertime ozone over the Mediterranean basin is analysed in parallel with meteorological conditions for the 2007–2012 period. From this analysis, two anomalies of ozone with respect to the climatological evolution are identified in
5
June 2008 and June/July 2009. They are discussed in Sect. 4 to identify the responsi-ble meteorological forcing. Conclusions are given in Sect. 5.
2 Ozone observations and methodology
2.1 IASI measurements of tropospheric ozone
2.1.1 The IASI instrument
10
The IASI instrument (Clerbaux et al., 2009) on board the MetOp-A platform since 19 October 2006 is a nadir-viewing Fourier transform spectrometer operating in the thermal infrared between 645 and 2760 cm−1 with a (apodized) spectral resolution of 0.5 cm−1. The IASI field of view is composed of a 2
×2 matrix of pixels with a diameter of 12 km each at the nadir. IASI scans the atmosphere with a swath width of 2200 km
15
that allows the atmospheric composition monitoring twice per day at any location. The spectral coverage and the radiometric and spectral performances of IASI allow this instrument to measure the global distribution of several important atmospheric trace gases (e.g., Boynard et al., 2009; George et al., 2009; Clarisse et al., 2011). Concern-ing ozone, the vertical information is sufficient to study separately different atmospheric
20
ACPD
14, 13021–13058, 2014Tropospheric ozone variability over the
Mediterranean
C. Doche et al.
Title Page
Abstract Introduction
Conclusions References
Tables Figures
◭ ◮
◭ ◮
Back Close
Full Screen / Esc
Printer-friendly Version Interactive Discussion
Discussion
P
a
per
|
Discus
sion
P
a
per
|
Discussion
P
a
per
|
Discussion
P
a
per
|
2.1.2 Ozone retrieval
The ozone profiles considered in the present study are retrieved using the method described in Eremenko et al. (2008). These IASI ozone observations within the tropo-sphere are well validated and characterized (Keim et al., 2009; Dufour et al., 2012). Briefly, the retrievals are based on the radiative transfer model KOPRA (Karlsruhe
Op-5
timized and Precise Radiative transfer Algorithm, Stiller et al., 2000) and its inversion module KOPRAFIT (Hopfner et al., 2001). A constrained least squares fit method us-ing an analytical altitude-dependent regularization is used (Kulawik et al., 2006). The applied regularization method is detailed in Eremenko et al. (2008). Compared to pre-vious studies using this algorithm (Eremenko et al., 2008; Dufour et al., 2010, 2012),
10
a selection between two a priori ozone profiles has been added and it is based on the detection of the tropopause height. The tropopause height is calculated from the tem-perature profile retrieved from IASI using the definition based on the lapse rate criterion (WMO, 1957). A threshold (14 km) has been selected for choosing as well the a priori and the regularization matrix. If the tropopause height is lower (higher) than 14 km,
15
a constraint and a priori typical for midlatitudes (tropics) are used. The regularization matrices are those already used in Eremenko et al. (2008) for the midlatitudes and in Dufour et al. (2010, 2012) for the tropics. The a priori profiles used during the retrieval are compiled from the climatology of McPeters et al. (2007). The midlatitude a priori profile is set to the climatological profile of the 30–60◦N latitude band for summer and
20
the tropical a priori profile is set to the climatological profile of the 10–30◦N latitude band for one year. It has been checked that the use of two different a priori and con-straints does not induce discontinuities in the retrieved ozone fields. This reduces the possible oscillations in the ozone profile induced by compensation effects during the retrieval procedure, especially in the tropics.
ACPD
14, 13021–13058, 2014Tropospheric ozone variability over the
Mediterranean
C. Doche et al.
Title Page
Abstract Introduction
Conclusions References
Tables Figures
◭ ◮
◭ ◮
Back Close
Full Screen / Esc
Printer-friendly Version Interactive Discussion
Discussion
P
a
per
|
Discus
sion
P
a
per
|
Discussion
P
a
per
|
Discussion
P
a
per
|
2.1.3 Validation
The IASI ozone product used in this study has been extensively characterized and val-idated using ozonesondes (Keim et al., 2009; Dufour et al., 2012). Dufour et al. (2012) showed that the mean bias in the lower troposphere from the surface to 6 km is−2 % (−0.38 DU) for typical midlatitudes measurements. In the mid-latitudes, the main diff
er-5
ence between IASI and the ozonesondes arises in the UTLS column (between 8 and 16 km) with a bias of 13.2 % (6.3 DU) on average. In the tropics, the biases are larger:
−6.2 % (−1.5 DU) in the lower troposphere (between surface and 8 km) and 23.6 %
(6.1 DU) in the UTLS (between 11 and 20 km). As the present study is focused on the Mediterranean basin during summer and some modifications in the retrieval algorithm
10
have been made, we performed a specific validation restricted to the summer period for the two WOUDC ozonesondes stations the closest to the Mediterranean (Madrid and Ankara). The number of available ozonesondes profiles is 72 over the validation period (summers between 2007 and 2012). The mean bias for the lower tropospheric column is−1.9 % (−0.4 DU), similar to the one from Dufour et al. (2012). The mean bias for the
15
UTLS column (16.5 %, 5.0 DU) is slightly larger than the bias reported by Dufour et al. (2012) for an entire year for all the midlatitudes ozonesonde stations. However, a larger bias for summer season for this part of the atmosphere has already been noticed (see Fig. 12 in Dufour et al., 2012). In the present study, we make the choice to present ozone concentrations rather than columns. We consider ozone concentrations at 3 km
20
(asl) and 10 km (asl). Due to the vertical sensitivity and resolution of IASI, the 10 km level is used to describe the variability of ozone at the upper troposphere and lower stratosphere whereas the 3 km level for the lower to middle troposphere. Ozone con-centrations retrieved at 3 km capture the ozone concentration and variability roughly from 2 to 8 km and retrievals at 10 km are sensitive to ozone changes approximately
25
ACPD
14, 13021–13058, 2014Tropospheric ozone variability over the
Mediterranean
C. Doche et al.
Title Page
Abstract Introduction
Conclusions References
Tables Figures
◭ ◮
◭ ◮
Back Close
Full Screen / Esc
Printer-friendly Version Interactive Discussion
Discussion
P
a
per
|
Discus
sion
P
a
per
|
Discussion
P
a
per
|
Discussion
P
a
per
|
lower tropospheric and UTLS columns as well as with the validation exercise reported in Dufour et al. (2012).
2.2 Methodology to analyse tropospheric ozone over the Mediterranean
Our analyses are based on the morning overpasses of IASI for which the thermal con-ditions are more favorable to retrieve relevant information in the lower troposphere. The
5
monthly and daily variations of ozone at 3 km and 10 km altitude during the summertime period are used. Monthly averages over the considered IASI observation period (2007– 2012) are used as a reference to analyze the ozone variability and anomalies. In the fol-lowing, averages over the 6 years period are named climatology by convenience even if the 6 years period is too short to clearly address a climatological mean. A land/sea
10
mask has been applied to calculate the averages only over the Mediterranean sea. The role of the atmospheric dynamical processes on the tropospheric ozone distribution and its variability over the Mediterranean basin is then assessed comparing ozone ob-servations to meteorological reanalyses. The meteorological data used in this study are taken from the ECMWF ERA-Interim Analysis atmospheric model. It is characterised
15
by a 12 h 4D-Var data assimilation system, a 0.75◦
×0.75◦ horizontal resolution and 91 vertical layers (Dee et al., 2011). To be compared to the IASI late morning observa-tions, the meteorological parameters are taken at 12:00 UTC. The 850 hPa geopotential is used as a proxy for describing the lower tropospheric horizontal transport. It allows the characterisation of the meteorological systems, their relative positions and strength
20
as well as the induced flux direction. The 200 and 300 hPa potential vorticity (PV) fields are used as tracers of the (partial) stratospheric character of air masses and of vertical exchange processes. Indeed, stratospheric ozone rich air masses are characterized by large potential vorticity corresponding to enhanced vertical stability (Holton, 1992). This induces a positive vertical gradient of PV as well as of ozone in the UTLS. A
posi-25
ACPD
14, 13021–13058, 2014Tropospheric ozone variability over the
Mediterranean
C. Doche et al.
Title Page
Abstract Introduction
Conclusions References
Tables Figures
◭ ◮
◭ ◮
Back Close
Full Screen / Esc
Printer-friendly Version Interactive Discussion
Discussion
P
a
per
|
Discus
sion
P
a
per
|
Discussion
P
a
per
|
Discussion
P
a
per
|
character, and due to subsidence of air from the UTLS region down to the middle troposphere (e.g., Beekmann et al., 1994). In this study, the ozone concentrations ob-served by IASI at the 10 km level can be compared to the 200 hPa potential vorticity to infer the dynamic control of the ozone concentration variability. The PV at 300 hPa turned out to best describe vertical transport from the lower stratosphere down to the
5
mid-troposphere, especially when important subsidence is present, largely mixing up-per tropospheric air masses within the free troposphere. Note that potential vorticity at lower altitudes are less reliable for such analysis due to the non-conservative character of PV in the troposphere induced by diabatic processes (Holton, 1992). These contri-butions of ozone at the mid-troposphere are analysed using IASI retrievals at 3 km.
10
3 Ozone spatio-temporal variability measured by IASI during the 2007 to 2012 period
In this section, we analyse the variability of ozone over the Mediterranean basin at the lower (3 km) and the upper (10 km) troposphere using six years of IASI observations. A month-to-month analysis and ozone anomalies analyses with respect to the
climato-15
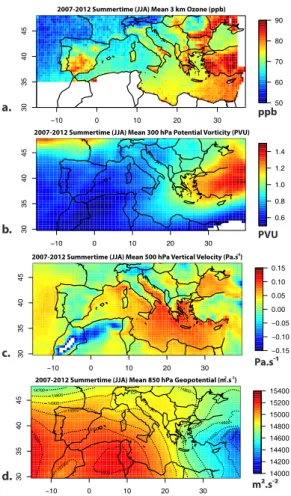
logical evolution on a daily basis are conducted. Results are discussed with respect to the associated meteorological conditions. Figure 2a shows the mean ozone concen-trations retrieved with IASI at 3 km over the Mediterranean basin for the 6 summers (June, July and August) between 2007 and 2012. Larger ozone values are located at the eastern part of the Mediterranean basin. The 3 km ozone concentrations
in-20
ferred from IASI range between 70 and 80 ppbv in this region, in agreement with in situ measurements made during summertime periods (e.g., Kalabokas et al., 2013). At this altitude, a steep horizontal west/east concentration gradient is observed over the basin. The eastern part of the basin (eastward 15◦E) presents larger 3 km ozone con-centrations than the western Mediterranean basin with a difference of about 20 ppbv
25
indi-ACPD
14, 13021–13058, 2014Tropospheric ozone variability over the
Mediterranean
C. Doche et al.
Title Page
Abstract Introduction
Conclusions References
Tables Figures
◭ ◮
◭ ◮
Back Close
Full Screen / Esc
Printer-friendly Version Interactive Discussion
Discussion
P
a
per
|
Discus
sion
P
a
per
|
Discussion
P
a
per
|
Discussion
P
a
per
|
cate an activation of the vertical exchanges due to the presence of the trough in this region. The large vertical downward velocities at 500 hPa eastward of 15◦E (Fig. 2c) suggest that the downward vertical transport of ozone-enriched air masses from the upper troposphere to the lower troposphere can explain the enhancement of ozone over the eastern Mediterranean basin in the lower troposphere. The ozone gradient is
5
then mainly associated to the pronounced subsidence over the Central and eastern Mediterranean basin, arising from the diabatic convection over the Persian Gulf dur-ing the Indian monsoon. These results are in agreement with previous studies based on in situ measurements (Kalabokas et al., 2013) and model analyses (Zanis et al., 2014). In addition, it is worth noting that the western part of the basin is located
down-10
wind of the Atlantic ocean and influenced by advection of more pristine air masses (Fig. 2d). For the western basin, ozone enhancements occur over shorter time periods and are usually local events. They can be explained by local dynamics such as sea breeze that can transport polluted air masses over the sea (Velchev et al., 2011; Millan et al., 2000). The low sensivity of IASI near the surface, where these local processes
15
arise, makes their observation difficult with IASI. Note that the west/east gradient of ozone can be potentially reinforced by the Etesian winds in the lower troposphere, which transport air masses from European continental areas. For comparison, we also analyze the ozone distribution observed by IASI in the upper troposphere (10 km) dur-ing summer (Fig. 3a). This comparison shows that the ozone concentrations retrieved
20
from IASI at 3 km and at 10 km are clearly uncorrelated and that IASI observations provide reliable information on the ozone spatial variability at the lower and the upper troposphere. A north/south horizontal gradient all over Europe is observed in the upper troposphere (Fig. 3a). This gradient is about 400 to 500 ppbv between the north and the south of Europe. A similar north/south gradient is observed for the 200 hPa
poten-25
ACPD
14, 13021–13058, 2014Tropospheric ozone variability over the
Mediterranean
C. Doche et al.
Title Page
Abstract Introduction
Conclusions References
Tables Figures
◭ ◮
◭ ◮
Back Close
Full Screen / Esc
Printer-friendly Version Interactive Discussion
Discussion
P
a
per
|
Discus
sion
P
a
per
|
Discussion
P
a
per
|
Discussion
P
a
per
|
of lower stratospheric ozone values. Southward, the 200 hPa potential vorticity values between 1 and 3 PVU reflect the mixed stratospheric–tropospheric origin of air masses characteristic for the upper troposphere. The analysis of the tropopause height (not shown) also confirms the difference of air masses origin between the north and the south of Europe.
5
A particular interest of our study is to be able to investigate the temporal variability of ozone over the Mediterranean basin at an interannual scale and on a monthly basis, given the large number of profiles available. The monthly variability of ozone at the scale of the basin has been very little investigated and satellite observations have not yet been exploited for this purpose to our knowledge. The temporal variability of lower
10
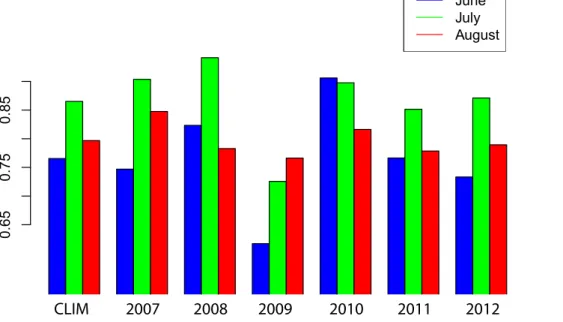
tropospheric ozone is driven by both the vertical and horizontal dynamics of the tropo-sphere. Indeed, our analysis suggests that vertical exchanges between the higher and the lower troposphere lead to a maximum of the monthly mean 3 km ozone concentra-tion in July (Fig. 4). This lower tropospheric maximum is correlated to a 300 hPa po-tential vorticity maximum occurring also in July (Fig. 5). The Pearson correlation
coef-15
ficient between ozone concentrations at 3 km (Fig. 4) and potential vorticity at 300 hPa (Fig. 5), calculated over the 3 summer months of the 6 considered years, is 0.99. The ozone maximum corresponds also to a 850 hPa geopotential maximum in July. Indeed, the North African anticyclone is stronger in July with values larger than 15 300 m2s−2 (Fig. 6b) compared to June (maximum values of 15 100 m2s−2, Fig. 6a) and August
20
(maximum values of 15 200 m2s−2, Fig. 6c). As well, the depression over the eastern basin is deeper in July (14 200 m2s−2, Fig. 6a) than in June (14 400 m2s−2, Fig. 6a) and in August (14 300 m2s−2, Fig. 6c). That also means that the north/south horizontal advection flux located between these two systems, which can also increase ozone con-centrations over the basin by the transport of ozone-enriched air masses from Europe,
25
ACPD
14, 13021–13058, 2014Tropospheric ozone variability over the
Mediterranean
C. Doche et al.
Title Page
Abstract Introduction
Conclusions References
Tables Figures
◭ ◮
◭ ◮
Back Close
Full Screen / Esc
Printer-friendly Version Interactive Discussion
Discussion
P
a
per
|
Discus
sion
P
a
per
|
Discussion
P
a
per
|
Discussion
P
a
per
|
Mediterranean basin is then characterized by a maximum in July. This feature seems fairly stable over years (Fig. 4) nevertheless few anomalies with respect to the average behavior are also present. Especially during summer 2009, the monthly mean of the 3 km ozone concentration increases between June and August, with particularly low values for June and July (about 60 ppbv for June 2009 against about 65 ppbv for the
5
2007–2012 June monthly mean of 3 km ozone). Summer 2008 also shows an anomaly compared to the climatology with a large ozone concentration at 3 km in June (about 69 ppbv against about 65 ppbv for the 2007–2012 June monthly mean of 3 km ozone). A detailed analysis provides a better understanding of how the dynamics controls the ozone concentrations over the Mediterranean basin. A day-to-day analysis of these
10
anomalies is presented in the next section.
By comparison, we also present the interannual variations of summer monthly aver-age concentrations at 10 km, which is different compared to that at 3 km (Fig. 7). The monthly mean ozone in the upper troposphere decreases from June to August with a marked maximum in June (Fig. 7). This ozone decrease is related to the well known
15
annual cycle of ozone that presents mid-latitude spring maximum at these altitudes. The interannual variability of upper tropospheric ozone is weak especially in July and August and the June to August decreases in concentrations persist all over the years.
4 Anomalies analysis: June 2008 and June/July 2009
In the 3 km ozone monthly variations presented in Fig. 4, two years (2008 and 2009)
20
present anomalies compared to the climatological average between 2007 and 2012. During summer 2008, June ozone concentrations at 3 km are significantly larger than for the other years whereas during summer 2009, ozone concentrations increase pro-gressively from June to August with unusual low ozone values in June and July. In this section, we present an analysis of the meteorological situation for the two specific
25
ACPD
14, 13021–13058, 2014Tropospheric ozone variability over the
Mediterranean
C. Doche et al.
Title Page
Abstract Introduction
Conclusions References
Tables Figures
◭ ◮
◭ ◮
Back Close
Full Screen / Esc
Printer-friendly Version Interactive Discussion
Discussion
P
a
per
|
Discus
sion
P
a
per
|
Discussion
P
a
per
|
Discussion
P
a
per
|
4.1 Case of June 2008
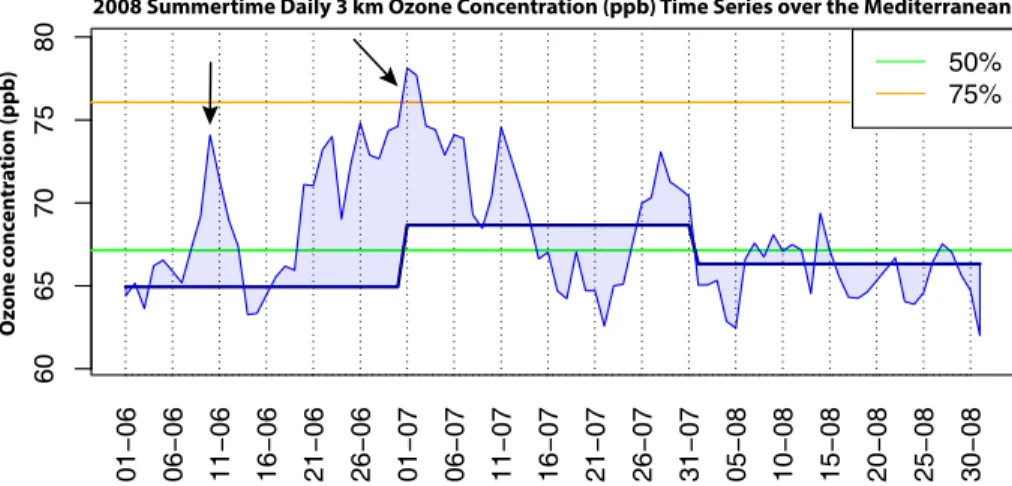
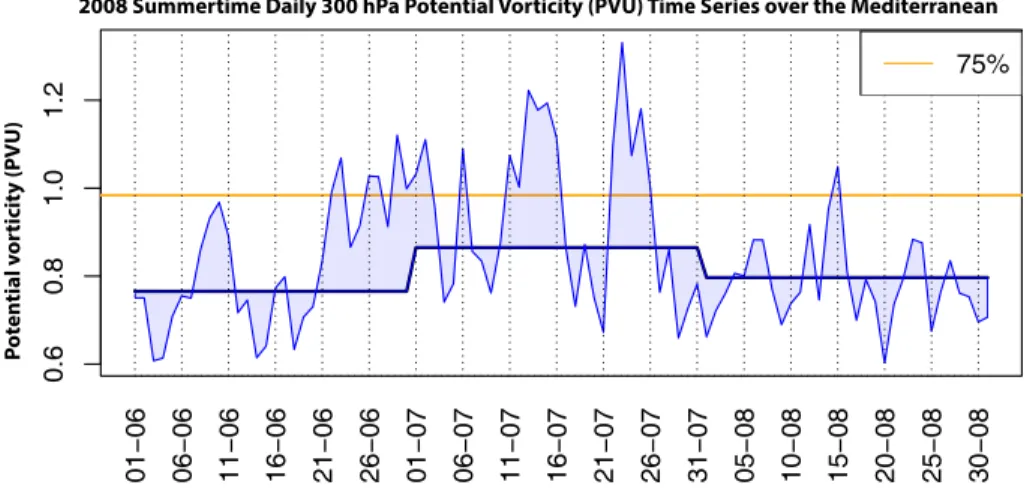
In order to explain the June 2008 positive ozone anomaly, we investigate the link be-tween the synoptic meteorological conditions and the ozone daily variations for this month. Figure 8 shows that two high ozone events are observed by IASI at 3 km altitude: one around 10 June 2008 and another one between 20 June 2008 and 4
5
July 2008 (Fig. 8). The ozone concentrations averaged over the Mediterranean sea reached during these periods are about 72.5 ppbv, much larger than the median value (64 ppbv) calculated over the 6 years period. For two days (1–2 July 2008), the ozone values even exceed the 75 % quartile (76 ppbv) calculated over all the ozone profiles measured over the basin. These two events are well correlated to 300 hPa potential
vor-10
ticity, which also presents two maxima for the same periods with values about 1 PVU over the Mediterranean basin (Fig. 9). The Pearson correlation coefficient between the 300 hPa potential vorticity and the 3 km ozone concentration time series is 0.87 for the month of June 2008. This suggests again that the large ozone amount observed in this case is related to the vertical exchanges with the upper troposphere. In addition, the
15
3 km ozone concentration time series are also correlated with the 850 hPa geopotential time series calculated both over the entire basin. The Pearson correlation coefficient is about 0.85. Figure 10 shows the mean 850 hPa geopotential for the period between 15 June 2008 and 7 July 2008. The Azores Anticyclone was stronger during this period compared to the mean situation between 2007 and 2012 (Fig. 6a). It was also located
20
at higher latitudes. The ridge over the western Mediterranean basin is then strengthen as well as the horizontal Etesian flux over the lower troposphere of the Central and eastern Mediterranean basin. In addition, the low-pressure system located at the east-ern part of the basin was also deeper during this period compared to the mean over the 6 years period, suggesting an intensification of the vertical subsidence of ozone
25
ACPD
14, 13021–13058, 2014Tropospheric ozone variability over the
Mediterranean
C. Doche et al.
Title Page
Abstract Introduction
Conclusions References
Tables Figures
◭ ◮
◭ ◮
Back Close
Full Screen / Esc
Printer-friendly Version Interactive Discussion
Discussion
P
a
per
|
Discus
sion
P
a
per
|
Discussion
P
a
per
|
Discussion
P
a
per
|
4.2 Case of June and July 2009
As previously, we analysed the meteorological conditions and the daily ozone varia-tions for June and July 2009 that present low ozone values in the lower troposphere (Fig. 11). A low ozone episode is observed by IASI between 9 and 25 June 2009 and the first half of July 2009, with 3 km ozone values below the median and even below the
5
first quartile between 11 and 21 June 2009 (Fig. 11). The daily 300 hPa potential vor-ticity over the Mediterranean presents moderate values (0.6 PVU) and indicates a low vertical exchange activity (Fig. 12). The potential vorticity at 300 hPa is not correlated with the 3 km ozone time series for June 2009 (Pearson correlation coefficient of 0.44). This suggests that vertical exchange is not the major driving force for the ozone
vari-10
ability at 3 km. In order to investigate which other dynamical process can play a key role in this low ozone value period, we examine the mean daily 850 hPa geopotential value over the basin (Fig. 13). The Pearson correlation coefficient between the 3 km ozone observed by IASI and the 850 hPa geopotential shows an anti-correlation with a value of−0.79. For this period, the low values of 3 km ozone concentrations are then
associ-15
ated with high values of 850 hPa geopotential (Fig. 13), whereas the high geopotential values was associated to large ozone values for June 2008. The difference between June 2008 and 2009 arises from the fact that the meteorological systems (high/low pressure structures) are not located at the same positions in June 2008 and 2009. In-deed, in 2009, the high pressure levels are positioned on the North Africa and the low
20
pressure levels are located over both the Atlantic and the central Europe (Fig. 14a). These positions lead to a flux in the lower troposphere from the Atlantic Ocean to the Mediterranean Sea inducing horizontal advection of oceanic clean air masses over the Mediterranean, as it has been observed also during low-ozone concentration periods in the area (Kalabokas et al., 2008, 2013). This meteorological situation persists from
25
ACPD
14, 13021–13058, 2014Tropospheric ozone variability over the
Mediterranean
C. Doche et al.
Title Page
Abstract Introduction
Conclusions References
Tables Figures
◭ ◮
◭ ◮
Back Close
Full Screen / Esc
Printer-friendly Version Interactive Discussion
Discussion
P
a
per
|
Discus
sion
P
a
per
|
Discussion
P
a
per
|
Discussion
P
a
per
|
5 Conclusions
Six years (2007–2012) of satellite observations from IASI have been used to analyse the spatial and the temporal variability of ozone over the Mediterranean basin during summertime periods (June, July, August). IASI with more than 200 000 ozone profiles per summer over the Mediterranean basin provides a unique dataset to investigate the
5
intraseasonnal variability of ozone in this region. The availability of the data since 2007 allows also the characterization of the interannual variability of ozone.
IASI ozone observations at 3 km and at 10 km provide reliable information to char-acterize the lower and the upper tropospheric ozone variability, respectively. In the lower troposphere, a steep west/east horizontal gradient over the basin is observed, in
10
agreement with the summertime pool of high ozone concentrations over the eastern Mediterranean, already reported in literature (e.g., Zanis et al., 2014). Vertical veloci-ties at 500 hPa and 300 hPa potential vorticity (from ERA-Interim reanalysis) presents similar pools of high values or gradient over the eastern basin confirming the key role of the vertical exchanges in controlling the ozone concentrations in this region. Indeed,
15
our analysis confirms that upper tropospheric air masses with high ozone concentra-tions are efficiently transported downward into the middle and lower troposphere and largely modify the ozone budget over the Central and eastern Mediterranean basin. In the upper troposphere, the monthly analysis of IASI ozone observations shows a June maximum (with respect to July and August) related to the annual cycle of upper
tro-20
pospheric ozone (spring maximum). In the lower troposphere, ozone concentrations exhibit a July maximum that is related mainly to the relative position and the inten-sification of the Azores anticyclone and the Middle eastern depression associated to Indian summer monsoon in July. Over the six considered years, the temporal evolution of ozone during summer turns out to be fairly stable. Nevertheless, two ozone
anoma-25
ACPD
14, 13021–13058, 2014Tropospheric ozone variability over the
Mediterranean
C. Doche et al.
Title Page
Abstract Introduction
Conclusions References
Tables Figures
◭ ◮
◭ ◮
Back Close
Full Screen / Esc
Printer-friendly Version Interactive Discussion
Discussion
P
a
per
|
Discus
sion
P
a
per
|
Discussion
P
a
per
|
Discussion
P
a
per
|
over the eastern basin associated to stronger anticyclonic conditions than usual over the Mediterranean.
The June and July 2009 anomaly is explained by the position of a strong anticyclone over North Africa and of low pressure systems over the Atlantic and Central Europe that induce a transport of clean oceanic air masses over the Mediterranean. The
rel-5
ative position and the strength of the key meteorological systems (Azores anticyclone and Middle eastern depression) are then determinant factors for the ozone variability observed in the lower troposphere over the Mediterranean. The use of new data sets (i.e IASI tropospheric ozone observations) to analyse the eastern Mediterranean tropo-spheric ozone pool allows one to reinforce the hypothesis of the control by downward
10
transport of upper tropospheric air masses. The possibility of a daily analysis (due to the high sampling capability of IASI) also permits to show how horizontal fluxes (here the import of clean oceanic air masses over the basin) can perturb the mean situation. The impact of European emissions potentially connected to the Etesian winds has not been investigated here. Even if this impact is not dominant (Richards et al., 2013),
15
it probably needs to be quantified more precisely. The joint use of satellite O3, CO and NO2observations as well as of regional chemical transport model simulations with high resolution are probably needed to understand and quantify this impact.
Acknowledgements. This study was supported by the French Space Agency CNES (project “IASI-TOSCA”). The IASI mission is a joint mission of Eumetsat and the Centre National
20
d’Etudes Spatiales (CNES, France). The IASI L1 data are distributed in near real time by Eu-metsat through the Eumetcast system distribution. The authors acknowledge the Ether French atmospheric database (http://ether.ipsl.jussieu.fr) for providing the IASI L1C and L2 data. The authors thank the Institut für Meteorologie und Klimaforschung (IMK), Karlsruhe Institute of Technology (KIT), Germany, for a licence to use the KOPRA radiative transfer model, and
es-25
pecially M. Höpfner for his help to set up the code. The ozonesonde data used in this study were provided by the World Ozone and Ultraviolet Data Centre (WOUDC). The authors thank all those responsible for the WOUDC measurements and archives for making the ozonesonde data available. Clément Doche is grateful to Meteo-France for financial support. ECMWF ERA-Interim data used in this study have been obtained from the ECMWF data server.
ACPD
14, 13021–13058, 2014Tropospheric ozone variability over the
Mediterranean
C. Doche et al.
Title Page
Abstract Introduction
Conclusions References
Tables Figures
◭ ◮
◭ ◮
Back Close
Full Screen / Esc
Printer-friendly Version Interactive Discussion
Discussion
P
a
per
|
Discus
sion
P
a
per
|
Discussion
P
a
per
|
Discussion
P
a
per
|
References
Alpert, P., Price, C., Krichak, S. O., Ziv, B., Saaroni, H., Osetinsky, I., Barkan, J., and Kishcha, P.: Tropical tele-connections to the Mediterranean climate and weather, Adv. Geosci., 2, 157– 160, doi:10.5194/adgeo-2-157-2005, 2005. 13023
Beekmann, M., Ancellet, G., and Mégie, G.: Climatology of tropospheric ozone in southern
Eu-5
rope and its relation to potential vorticity, J. Geophys. Res., 99, 12841–12853, 1994. 13030 Beer, R., Glavich, T. A., and Rider, D. M.: Tropospheric emission spectrometer for the Earth
observing system’s Aura satellite, Appl. Optics, 40, 2356–2367, 2001. 13025
Bethan, S., Vaughan, G., and Reid, S. J.: A comparison of ozone and thermal tropopause heights, and the impact of tropopause definition on quantifying the ozone content of the
10
troposphere, Q. J. Roy. Meteor. Soc., 122, 929–944, 1996. 13031
Boynard, A., Clerbaux, C., Coheur, P.-F., Hurtmans, D., Turquety, S., George, M., Hadji-Lazaro, J., Keim, C., and Meyer-Arnek, J.: Measurements of total and tropospheric ozone from IASI: comparison with correlative satellite, ground-based and ozonesonde observa-tions, Atmos. Chem. Phys., 9, 6255–6271, doi:10.5194/acp-9-6255-2009, 2009. 13025,
15
13026
Camredon, M., and Aumont, B.: "I. L’ozone troposphérique: production/consommation et régimes chimiques", Pollution Atmosphérique, 193, p. 51-60, 2007. 13023
Clarisse, L., R’Honi, Y., Coheur, P.-F., Hurtmans, D., and Clerbaux, C.: Thermal in-frared nadir observations of 24 atmospheric gases, Geophys. Res. Lett., 38, L10802,
20
doi:10.1029/2011GL047271, 2011. 13026
Clerbaux, C., Boynard, A., Clarisse, L., George, M., Hadji-Lazaro, J., Herbin, H., Hurtmans, D., Pommier, M., Razavi, A., Turquety, S., Wespes, C., and Coheur, P.-F.: Monitoring of atmo-spheric composition using the thermal infrared IASI/MetOp sounder, Atmos. Chem. Phys., 9, 6041–6054, doi:10.5194/acp-9-6041-2009, 2009. 13025, 13026
25
Coheur, P.-F., Barret, B., Turquety, S., Hurtmans, D., Hadji-Lazaro, J., and Clerbaux, C.: Re-trieval and characterization of ozone vertical profiles from a thermal infrared nadir sounder, J. Geophys. Res., 110, D24303, doi:10.1029/2005JD005845, 2005. 13024
Cuesta, J., Eremenko, M., Liu, X., Dufour, G., Cai, Z., Höpfner, M., von Clarmann, T., Sellitto, P., Foret, G., Gaubert, B., Beekmann, M., Orphal, J., Chance, K., Spurr, R., and Flaud, J.-M.:
30
ACPD
14, 13021–13058, 2014Tropospheric ozone variability over the
Mediterranean
C. Doche et al.
Title Page
Abstract Introduction
Conclusions References
Tables Figures
◭ ◮
◭ ◮
Back Close
Full Screen / Esc
Printer-friendly Version Interactive Discussion
Discussion
P
a
per
|
Discus
sion
P
a
per
|
Discussion
P
a
per
|
Discussion
P
a
per
|
thermal infrared and GOME-2 ultraviolet measurements over Europe, Atmos. Chem. Phys., 13, 9675–9693, doi:10.5194/acp-13-9675-2013, 2013. 13025
Dee, D. P., Uppala, S. M., Simmons, A. J., Berrisford, P., Poli, P., Kobayashi, S., Andrae, U., Balmaseda, M. A., Balsamo, G., Bauer, P., Bechtold, P., Beljaars, A. C. M., van de Berg, L., Bidlot, J., Bormann, N., Delsol, C., Dragani, R., Fuentes, M., Geer, A. J., Haimberger, L.,
5
Healy, S. B., Hersbach, H., Hólm, E. V., Isaksen, L., Kållberg, P., Köhler, M., Matricardi, M., McNally, A. P., Monge-Sanz, B. M., Morcrette, J.-J., Park, B.-K., Peubey, C., de Rosnay, P., Tavolato, C., Thépaut, J.-N., and Vitart, F.: The ERA-Interim reanalysis: configuration and performance of the data assimilation system, Q. J. Roy. Meteor. Soc., 137, 553–597, doi:10.1002/qj.828, 2011. 13029
10
Delmas, R., Mégie, G., and Peuch, V.-H.: Physique et chimie de l’atmosphère, Belin, 2005. 13023
Dufour, G., Eremenko, M., Orphal, J., and Flaud, J.-M.: IASI observations of seasonal and day-to-day variations of tropospheric ozone over three highly populated areas of China: Beijing, Shanghai, and Hong Kong, Atmos. Chem. Phys., 10, 3787–3801,
doi:10.5194/acp-10-3787-15
2010, 2010. 13025, 13026, 13027, 13028
Dufour, G., Eremenko, M., Griesfeller, A., Barret, B., LeFlochmoën, E., Clerbaux, C., Hadji-Lazaro, J., Coheur, P.-F., and Hurtmans, D.: Validation of three different scientific ozone products retrieved from IASI spectra using ozonesondes, Atmos. Meas. Tech., 5, 611–630, doi:10.5194/amt-5-611-2012, 2012. 13027, 13028, 13029
20
Eremenko, M., Dufour, G., Foret, G., Keim, C., Orphal, J., Beekmann, M., Bergametti, G., and Flaud, J.-M.: Tropospheric ozone distributions over Europe during the heat wave in July 2007 observed from infrared nadir spectra recorded by IASI, Geophys. Res. Lett., 35, L18805, doi:10.1029/2008GL034803, 2008. 13024, 13025, 13027
Fishman, J., Wozniak, A. E., and Creilson, J. K.: Global distribution of tropospheric ozone from
25
satellite measurements using the empirically corrected tropospheric ozone residual tech-nique: Identification of the regional aspects of air pollution, Atmos. Chem. Phys., 3, 893–907, doi:10.5194/acp-3-893-2003, 2003. 13024
Foret, G., Eremenko, M., Cuesta, J., Sellitto, P., Barré, J., Gaubert, B., Coman, A., Dufour, G., Liu, X., Joly, M., Doche, C., and Beekmann, M.: Ozone pollution: what can we see from
30
space? A case study, J. Geophys. Res., submitted. 13025
ACPD
14, 13021–13058, 2014Tropospheric ozone variability over the
Mediterranean
C. Doche et al.
Title Page
Abstract Introduction
Conclusions References
Tables Figures
◭ ◮
◭ ◮
Back Close
Full Screen / Esc
Printer-friendly Version Interactive Discussion
Discussion
P
a
per
|
Discus
sion
P
a
per
|
Discussion
P
a
per
|
Discussion
P
a
per
|
George, M., Clerbaux, C., Hurtmans, D., Turquety, S., Coheur, P.-F., Pommier, M., Hadji-Lazaro, J., Edwards, D. P., Worden, H., Luo, M., Rinsland, C., and McMillan, W.: Carbon monoxide distributions from the IASI/METOP mission: evaluation with other space-borne remote sensors, Atmos. Chem. Phys., 9, 8317–8330, doi:10.5194/acp-9-8317-2009, 2009. 13026
5
Holton, J. R.: An Introduction to Dynamic Meteorology, 3rd edn., Academic Press, Inc., San Diego, California, 1992. 13029, 13030
Hopfner, M., Blom, C. E., Echle, G., Glatthor, N., Hase, F., and Stiller, G.: Retrieval simula-tions for MIPAS-STR measurements, edited by: Smith, W. L., IRS 2000: Current Problems in Atmospheric Radiation, in: Proc. of the Internat. Radiation Symp., St. Petersburg, Russia,
10
24–29 July 2000, DEEPAK Publ., Hampton, Va. : DEEPAK Publ., S.1121-24, 2001. 13027 IPCC: Climate Change 2007: The Physical Science Basis. Contribution of Working Group I to
the Fourth Assessment Report of the Intergovernmental Panel on Climate Change, edited by: Solomon, S., Qin, D., Manning, M., Chen, Z., Marquis, M., Averyt, K. B., Tignor, M., and Miller, H. L., Cambridge University Press, Cambridge, UK, New York, NY, USA, 2007. 13022,
15
13023
Jacob, D. J.: Heterogeneous chemistry and tropospheric ozone, Atmos. Environ., 34, 2131– 2159, 2000. 13023
Jones, D. B. A., Bowman, K. W., Horowitz, L. W., Thompson, A. M., Tarasick, D. W., and Witte, J. C.: Estimating the summertime tropospheric ozone distribution over North
Amer-20
ica through assimilation of observations from the Tropospheric Emission Spectrometer, J. Geophys. Res., 113, D18307, doi:10.1029/2007JD009341, 2008. 13025
Jonson, J. E., Sunder, J. K., and Tarrasón, L.: Model calculations of present and future levels of ozone and ozone precursors with a global and regional model, Atmos. Environ., 35, 525–537, 2001. 13024
25
Kalabokas, P. D. and Repapis, C. C.: A climatological study of rural surface ozone in central Greece, Atmos. Chem. Phys., 4, 1139–1147, doi:10.5194/acp-4-1139-2004, 2004. 13023, 13024
Kalabokas, P. D., Mihalopoulos, N., Ellul, R., Kleanthous, S., and Repapis, C. C.: An investiga-tion of the meteorological and photochemical factors influencing the background rural and
30
ACPD
14, 13021–13058, 2014Tropospheric ozone variability over the
Mediterranean
C. Doche et al.
Title Page
Abstract Introduction
Conclusions References
Tables Figures
◭ ◮
◭ ◮
Back Close
Full Screen / Esc
Printer-friendly Version Interactive Discussion
Discussion
P
a
per
|
Discus
sion
P
a
per
|
Discussion
P
a
per
|
Discussion
P
a
per
|
Kalabokas, P. D., Cammas, J.-P., Thouret, V., Volz-Thomas, A., Boulanger, D., and Repa-pis, C. C.: Examination of the atmospheric conditions associated with high and low summer ozone levels in the lower troposphere over the eastern Mediterranean, Atmos. Chem. Phys., 13, 10339–10352, doi:10.5194/acp-13-10339-2013, 2013. 13024, 13030, 13031, 13035 Keim, C., Eremenko, M., Orphal, J., Dufour, G., Flaud, J.-M., Höpfner, M., Boynard, A.,
Cler-5
baux, C., Payan, S., Coheur, P.-F., Hurtmans, D., Claude, H., Dier, H., Johnson, B., Kelder, H., Kivi, R., Koide, T., López Bartolomé, M., Lambkin, K., Moore, D., Schmidlin, F. J., and Stübi, R.: Tropospheric ozone from IASI: comparison of different inversion algorithms and validation with ozone sondes in the northern middle latitudes, Atmos. Chem. Phys., 9, 9329– 9347, doi:10.5194/acp-9-9329-2009, 2009. 13027, 13028
10
Kulawik, S. S., Osterman, G., Jones, D. B. A., and Bowman, K. W.: Calculation of altitude-dependent Tikhonov constraints for TES nadir retrievals, IEEE T. Geosci. Remote, 44, 1334– 1342, 2006. 13027
Lelieveld, J., Berresheim, H., Borrmann, S., Crutzen, P. J., Dentener, F. J., Fischer, H., de Gouw, J., Feichter, J., Flatau, P., Heland, J., Holzinger, R., Korrmann, R., Lawrence, M.,
15
Levin, Z., Markowicz, K., Mihalopoulos, N., Minikin, A., Ramanathan, V., de Reus, M., Roelofs, G.-J., Scheeren, H. A., Sciare, J., Schlager, H., Schultz, M., Siegmund, P., Steil, B., Stephanou, E., Stier, P., Traub, M., Williams, J., and Ziereis, H.: Global air pollution cross-roads over the Mediterranean, Science, 298, 794–799, 2002. 13023
Levy, J. I., Carrothers, T. J., Tuomisto, J. T., Hammitt, J. K., and Evans, J. S.: Assessing the
20
public health benefits of reduced ozone concentrations, Environ. Health Persp., 109, 1215– 1226, 2001. 13022
Li, Q., Jacob, D. J., Logan, J. A., Bey, I., Yantosca, R. M., Liu, H., Martin, R. V., Fiore, A. M., Field, B. D., Duncan, B. N., and Thouret, V.: A tropospheric ozone maximum over the Middle East, Geophys. Res. Lett., 28, 3235–3238, doi:10.1029/2001GL013134, 2001. 13024
25
Liu, J. J., Jones, D. B. A., Worden, J. R., Noone, D., Parrington, M., and Kar, J.: Analysis of the summertime buildup of tropospheric ozone abundances over the Middle East and North Africa as observed by the Tropospheric Emission Spectrometer intrument, J. Geophys. Res., 114, D05304, doi:10.1029/2008JD010993, 2009. 13024
Liu, X., Chance, K. V., Sioris, C. E., Spurr, R. J. D., Kurosu, T. P., Martin, R. V., and
30
ACPD
14, 13021–13058, 2014Tropospheric ozone variability over the
Mediterranean
C. Doche et al.
Title Page
Abstract Introduction
Conclusions References
Tables Figures
◭ ◮
◭ ◮
Back Close
Full Screen / Esc
Printer-friendly Version Interactive Discussion
Discussion
P
a
per
|
Discus
sion
P
a
per
|
Discussion
P
a
per
|
Discussion
P
a
per
|
Marenco, A., Thouret, V., Nédélec, P., Smit, H., Helten, M., Kley, D., Karcher, F., Simon, P., Law, K., Pyle, J., Poschmann, G., Von Wrede, R., Hume, C., and Cool, T.: Measure-ment of ozone water vapor by Airbus in-service aircraft: the MOZAIC airborne program, an overview, J. Geophys. Res., 103, 25631–25642, doi:10.1029/98JD00977, 1998. 13024 McPeters, R. D., Labow, G. J., and Logan, J. A.: Ozone climatological profiles for satellite
re-5
trieval algorithms, J. Geophys. Res., 112, D05308, doi:10.1029/2005JD006823, 2007. 13027 Millan, M., Mantilla, E., Salvador, R., Carratala, A., Sanz, M. J., Alonso, L., Gangoiti, G., and Navazo, M.: Ozone cycles in the western Mediterranean basin: interpretation of monitoring data in complex coastal terrain, J. Appl. Meteorol., 4, 487–507, 2000. 13031
Nolle, M., Ellul, R., Heinrich, G., and Güsten, H.: A long-term study of background ozone
con-10
centrations in the central Mediterranean – diurnal and seasonal variations on the island of Gozo, Atmos. Environ., 36, 1391–1402, 2001. 13023
Richards, N. A. D., Arnold, S. R., Chipperfield, M. P., Miles, G., Rap, A., Siddans, R., Monks, S. A., and Hollaway, M. J.: The Mediterranean summertime ozone maximum: global emission sensitivities and radiative impacts, Atmos. Chem. Phys., 13, 2331–2345,
15
doi:10.5194/acp-13-2331-2013, 2013. 13023, 13024, 13025, 13037
Roelofs, G. J., Scheeren, H. A., Heland, J., Ziereis, H., and Lelieveld, J.: A model study of ozone in the eastern Mediterranean free troposphere during MINOS (August 2001), Atmos. Chem. Phys., 3, 1199–1210, doi:10.5194/acp-3-1199-2003, 2003. 13024
Safieddine, S., Clerbaux, C., George, M., Hadji-Lazaro, J., Hurtmans, D., Coheur, P.-F.,
We-20
spes, C., Loyola, D., Valks, P., and Hao, N.: Tropospheric ozone and nitrogen dioxide mea-surements in urban and rural regions as seen by IASI and GOME-2, J. Geoph. Res.-Atmos., 118, 10555–10566, 2013. 13025
Stiller, G. P.: The Karlsruhe optimized and precise radiative transfer algorithm (KOPRA), Wiss. Ber. FZKA 6487, Forschungszentrum, Karlsruhe, Germany, 2000. 13027
25
Stohl, A., James, P., Forster, C., Spinchtinger, N., Marenco, A., Thouret, V., and Smit, H. G. J.: An extension of MOZAIC ozone climatologies using trajectory statistics, J. Geophys. Res., 106, 27757–27768, 2001. 13024
Tyrlis, E. and Lelieveld, J.: Climatology and dynamics of the summer Etesian winds over the eastern Mediterranean, J. Atmos. Sci., doi:10.1175/JAS-D-13-035.1, in press, 2013. 13032
30
ACPD
14, 13021–13058, 2014Tropospheric ozone variability over the
Mediterranean
C. Doche et al.
Title Page
Abstract Introduction
Conclusions References
Tables Figures
◭ ◮
◭ ◮
Back Close
Full Screen / Esc
Printer-friendly Version Interactive Discussion
Discussion
P
a
per
|
Discus
sion
P
a
per
|
Discussion
P
a
per
|
Discussion
P
a
per
|
Volz-Thomas, A., Beekmann, M., Derwent, D., Law, K., Lindskog, A., Prévôt, A., Roemer, M., Schultz, M., Schurath, U., Solberg, S., and Stohl, A.: Tropospheric ozone and its control, P. Midgley et al. (tech. eds.) Towards Cleaner Air for Europe - Science, Tools and Application, Part 1: Results from the EUROTRAC-2 Synthesis and Integration Project, Margraf Verlag, Weikersheim, 2003. 13023
5
WMO: International List of Selected and Supplementary Ships, 3rd edn., WMO 47 (WMO/OMM 47, TP. 18), 143 pp., Geneva, Switzerland, 1957. 13027
Worden, H. M., Logan, J. A., Worden, J. R., Beer, R., Bowman, K., Clough, S. A., Eldering, A., Fisher, B. M., Gunson, M. R., Herman, R. L., Kulawik, S. S., Lampel, M. C., Luo, M., Megret-skaia, I. A., Osterman, G. B., and Shephard, M. W.: Comparisons of Tropospheric Emission
10
Spectrometer (TES) ozone profiles to ozonesondes: methods and initial results, J. Geophys. Res., 112, D03309, doi:10.1029/2006JD007258, 2007. 13024
Worden, H. M., Bowman, K. W., Eldering, A., and Beer, R.: Satellite measurements of the clear sky greenhouse effect from tropospheric ozone, Nat. Geosci., 1, 305–308, doi:10.1038/ngeo182, 2008. 13025
15
Zanis, P., Hadjinicolaou, P., Pozzer, A., Tyrlis, E., Dafka, S., Mihalopoulos, N., and Lelieveld, J.: Summertime free-tropospheric ozone pool over the eastern Mediterranean/Middle East, At-mos. Chem. Phys., 14, 115–132, doi:10.5194/acp-14-115-2014, 2014. 13024, 13025, 13031, 13036
Ziv, B., Saaroni, H., and Alpert, P.: The factors governing the summer regime of the eastern
20
ACPD
14, 13021–13058, 2014Tropospheric ozone variability over the
Mediterranean
C. Doche et al.
Title Page
Abstract Introduction
Conclusions References
Tables Figures
◭ ◮
◭ ◮
Back Close
Full Screen / Esc
Printer-friendly Version Interactive Discussion
Discussion
P
a
per
|
Discus
sion
P
a
per
|
Discussion
P
a
per
|
Discussion
P
a
per
|
Table 1.Mean relative bias and Root Mean Square of Errors (RMSE) of IASI ozone
obser-vations at 3 km and 10 km. They are derived from the comparison of IASI obserobser-vations and ozonesonde measurements at Madrid and Ankara over the summertime periods between 2007 and 2012 (see text for more details). Bias and RMSE are given in percent and in ppbv (in paren-thesis).
Bias RMSE
3 km −3.2 (2) 16 (10)
ACPD
14, 13021–13058, 2014Tropospheric ozone variability over the
Mediterranean
C. Doche et al.
Title Page
Abstract Introduction
Conclusions References
Tables Figures
◭ ◮
◭ ◮
Back Close
Full Screen / Esc
Printer-friendly Version Interactive Discussion
Discussion
P
a
per
|
Discus
sion
P
a
per
|
Discussion
P
a
per
|
Discussion
P
a
per
|
0 20 40 60 80
20
30
40
50
60
995 1000 1005 1010 1015 1020
996
998
1000
1000 1000
1002
1006
1008
1008
1008
1008
1010 1012
1012
1014 1016
1018
1979-2012 Summertime (JJ) Mean Sea Level Pressure (hPa)
0 20 40 60 80
20
30
40
50
60
Ŧ Ŧ Ŧ
1979-2012 Summertime (JJ) Mean 500 hPa Vertical Velocity (Pa.s-1)
Ŧ
32
34
36
38
42
44
46
2 4 6
1979-2012 Summertime (JJ) Mean 10 m Horizontal Winds (m.s-1)
a.
b.
c.
hPa
Pa.s-1
m.s-1
ACPD
14, 13021–13058, 2014Tropospheric ozone variability over the
Mediterranean
C. Doche et al.
Title Page Abstract Introduction Conclusions References Tables Figures ◭ ◮ ◭ ◮ Back Close
Full Screen / Esc
Printer-friendly Version Interactive Discussion Discussion P a per | Discus sion P a per | Discussion P a per | Discussion P a per | Ŧ 35 45
2007-2012 Summertime (JJA) Mean 3 km Ozone (ppb)
ï 35 45
2007-2012 Summertime (JJA) Mean 300 hPa Potential Vorticity (PVU)
Ŧ 35 45 Ŧ Ŧ Ŧ
2007-2012 Summertime (JJA) Mean 500 hPa Vertical Velocity (Pa.s )
Ŧ 35 45
2007-2012 Summertime (JJA) Mean 850 hPa Geopotential (m2
.s-2 ) a. b. c. d. ppb PVU Pa.s-1 m2.s-2
Figure 2.2007–2012 summertime (June, July, and August) average of ozone measured by IASI (morning overpasses) and meteorological variables taken from 12 h ERA-Interim Reanalysis:
(a)3 km ozone concentration (ppb);(b)300 hPa potential vorticity (PVU);(c)500 hPa vertical velocity (Pa s−1
);(d)850 hPa geopotential (m2s−2
ACPD
14, 13021–13058, 2014Tropospheric ozone variability over the
Mediterranean
C. Doche et al.
Title Page
Abstract Introduction
Conclusions References
Tables Figures
◭ ◮
◭ ◮
Back Close
Full Screen / Esc
Printer-friendly Version Interactive Discussion
Discussion
P
a
per
|
Discus
sion
P
a
per
|
Discussion
P
a
per
|
Discussion
P
a
per
|
í
2007-2012 Summertime (JJA) Mean 10 km Ozone (ppm)
Ŧ
2 4 6 8
2007-2012 Summertime (JJA) Mean 200 hPa Potential Vorticity (PVU) a.
b.
ppm
PVU
ACPD
14, 13021–13058, 2014Tropospheric ozone variability over the
Mediterranean
C. Doche et al.
Title Page
Abstract Introduction
Conclusions References
Tables Figures
◭ ◮
◭ ◮
Back Close
Full Screen / Esc
Printer-friendly Version Interactive Discussion
Discussion
P
a
per
|
Discus
sion
P
a
per
|
Discussion
P
a
per
|
Discussion
P
a
per
|
62
64
66
68
70
June July August
3 km Ozone Concentration (ppb) Monthly Time Series over the Mediterranean
CLIM 2007 2008 2009 2010 2011 2012
Figure 4.Monthly means of 3 km ozone (ppb) measured by IASI during summertime period
ACPD
14, 13021–13058, 2014Tropospheric ozone variability over the
Mediterranean
C. Doche et al.
Title Page
Abstract Introduction
Conclusions References
Tables Figures
◭ ◮
◭ ◮
Back Close
Full Screen / Esc
Printer-friendly Version Interactive Discussion
Discussion
P
a
per
|
Discus
sion
P
a
per
|
Discussion
P
a
per
|
Discussion
P
a
per
|
0.65
0.75
0.85
June July August
CLIM 2007 2008 2009 2010 2011 2012 300 hPa Potential Vorticity (PVU) Monthly Time Series over the Mediterranean
ACPD
14, 13021–13058, 2014Tropospheric ozone variability over the
Mediterranean
C. Doche et al.
Title Page Abstract Introduction Conclusions References Tables Figures ◭ ◮ ◭ ◮ Back Close
Full Screen / Esc
Printer-friendly Version Interactive Discussion Discussion P a per | Discus sion P a per | Discussion P a per | Discussion P a per | Ŧ 35 45
2007-2012 June Monthly Mean of 850 hPa Geopotential (m2
.s-2 ) Ŧ 35 45
2007-2012 July Monthly Mean of 850 hPa Geopotential (m2.s-2)
a.
b.
c.
Ŧ 35 452007-2012 August Monthly Mean of 850 hPa Geopotential (m2
.s-2
)
m2.s-2
Figure 6.2007–2012 monthly mean of 850 hPa geopotential (m2s−2) taken from 12 h
ACPD
14, 13021–13058, 2014Tropospheric ozone variability over the
Mediterranean
C. Doche et al.
Title Page
Abstract Introduction
Conclusions References
Tables Figures
◭ ◮
◭ ◮
Back Close
Full Screen / Esc
Printer-friendly Version Interactive Discussion
Discussion
P
a
per
|
Discus
sion
P
a
per
|
Discussion
P
a
per
|
Discussion
P
a
per
|
0.14
0.18
0.22
June July August
10 km Ozone Concentration (ppm) Monthly Time Series over the Mediterranean
CLIM 2007 2008 2009 2010 2011 2012
ACPD
14, 13021–13058, 2014Tropospheric ozone variability over the
Mediterranean
C. Doche et al.
Title Page
Abstract Introduction
Conclusions References
Tables Figures
◭ ◮
◭ ◮
Back Close
Full Screen / Esc
Printer-friendly Version Interactive Discussion
Discussion
P
a
per
|
Discus
sion
P
a
per
|
Discussion
P
a
per
|
Discussion
P
a
per
|
60
65
70
75
80
01−06 06−06 11−06 16−06 21−06 26−06 01−07 06−07 11−07 16−07 21−07 26−07 31−07 05−08 10−08 15−08 20−08 25−08 30−08 50% 75% 2008 Summertime Daily 3 km Ozone Concentration (ppb) Time Series over the Mediterranean
O
zone c
onc
en
tr
a
tion (ppb
)
75%
Figure 8.2008 summertime day-to-day mean 3 km ozone (ppb) time series measured with IASI (thin blue curve) over the Mediterranean (IASI morning overpasses). Only the observations over the sea are considered in the averages. 2007–2012 3 km ozone monthly mean are plotted in thick dark-blue curve. Horizontal coloured lines represent the 2007–2012 summertime (JJA) 3 km ozone quantiles for the data set of individual profiles.