www.atmos-chem-phys.net/8/7153/2008/ © Author(s) 2008. This work is distributed under the Creative Commons Attribution 3.0 License.
Chemistry
and Physics
Characteristics of the NO-NO
2
-O
3
system in different chemical
regimes during the MIRAGE-Mex field campaign
Z.-H. Shon1, S. Madronich2, S.-K. Song3, F. M. Flocke2, D. J. Knapp2, R. S. Anderson2, R. E. Shetter2, C. A. Cantrell2,
S. R. Hall2, and X. Tie2
1Department of Environmental Engineering, Dong-Eui University, 995 Eomgwangno, Busan 614-714, Republic of Korea 2Atmospheric Chemistry Division, National Center for Atmospheric Research, P.O. Box 3000 Boulder, CO 80307, USA 3Devision of Earth Environmental System, Pusan National University, 30 Jang Jeon Dong, Geum Jeong Gu, Busan 609-735,
Republic of Korea
Received: 20 December 2007 – Published in Atmos. Chem. Phys. Discuss.: 6 February 2008 Revised: 9 July 2008 – Accepted: 31 October 2008 – Published: 9 December 2008
Abstract. The NO-NO2 system was analyzed in different
chemical regimes/air masses based on observations of reac-tive nitrogen species and peroxy radicals made during the in-tensive field campaign MIRAGE-Mex (4 to 29 March 2006). The air masses were categorized into 5 groups based on com-binations of macroscopic observations, geographical loca-tion, meteorological parameters, models, and observations of trace gases: boundary layer (labeled as “BL”), biomass burning (“BB”), free troposphere (continental, “FTCO” and marine, “FTMA”), and Tula industrial complex (“TIC”). In general, NO2/NO ratios in different air masses are near
pho-tostationary state. Analysis of this ratio can be useful for testing current understanding of tropospheric chemistry. The ozone production efficiency (OPE) for the 5 air mass cate-gories ranged from 4.5 (TIC) to 8.5 (FTMA), consistent with photochemical aging of air masses exiting the Mexico City Metropolitan Area.
1 Introduction
During March of 2006, the Megacities Impact on Regional and Global Environment: Mexico (MIRAGE-Mex) field campaign took place over the Mexico City Metropolitan Area (MCMA) and the surrounding region including the Gulf of Mexico, as part of the MILAGRO Project. This field campaign was designed to examine the chemical and physical transformations of gases and aerosols in the
pol-Correspondence to:Z.-H. Shon (zangho@deu.ac.kr)
luted outflow from MCMA and to assess the current and future impacts of these exported pollutants on regional and global air quality, ecosystems, and climate. MCMA is a megacity of about 20 million people residing in an area of 1500 km2, surrounded by mountains and at an elevation of 2.2 km above sea level (a.s.l.). The air quality in MCMA is affected by strong anthropogenic sources of NOx(NO+NO2)
and volatile organic compounds (VOCs) in conjunction with high solar irradiance facilitating photochemistry (Raga et al., 2001). In the 1990’s, hourly averaged ozone concentra-tions in MCMA exceeded the Mexican national standard of 110 ppbv for much of the year (Raga and Raga, 2000).
As essential ingredients for the formation of O3, the
reac-tive nitrogen species (NOx) are emitted to the atmosphere
mainly in the form of NO from road traffic (Soltic and Weilenmann, 2003). NO and NO2are interconverted rapidly
through the following reactions:
NO+O3→NO2+O2 (R1)
NO2+hν (λ<420 nm) (+O2)→NO+O3 (R2)
NO+HO2→NO2+OH (R3)
NO+RO2→NO2+RO (R4)
NO+XO→NO2+X (R5)
where RO2is any organic peroxy radical including CH3O2,
RO is the corresponding alkoxy radical, and XO is any un-known radical that may convert NO to NO2. The NO2/NO
ratio can be formulated as:
[NO2]
[NO] =
(k1[O3] +k3[HO2] +k4[RO2] +k5[XO]) J2
wherek1,k3,k4, andk5 are reaction rate constants for the
reactions R1, R3, R4, and R5, respectively andJ2is the
pho-tolysis frequency of NO2. Previous studies investigating the
NO-NO2cyclic system were conducted in urban and remote
areas utilizing observations of O3 (R1) and/or peroxy
radi-cals (R3–R4) (Cantrell et al., 1997; Crawford et al., 1996 and references therein). They found that model-predicted peroxy radicals were often less than those required to explain the observed NO2/NO ratio, resulting in model-predicted NO2
levels that were somewhat lower than observations. For ex-ample, comparison between observations and predictions in several field campaigns (CITE-3, ABLE-3B, CITE-2, and TRACE-A) typically showed that [NO2]obs/[NO2]calcranges
from 1.3 to 1.6 with a maximum of up to 3.4 in PEM-West A (Crawford et al., 1996). In contrast, Ridley et al. (1992) found good agreement between model peroxy radicals and those estimated from the NO2/NO ratio. Meanwhile, the
po-tential role of iodine chemistry on the NO2/NO and HO2/OH
ratios has been suggested based on field, model, and kinetic studies (Chameides and Davis, 1980; Davis et al., 1996; Knight and Crowley, 2001; Kanaya et al., 2002, 2007). Since both hydroperoxyl and organic peroxy radicals were mea-sured during the MIRAGE-Mex campaign, the photostation-ary state (PSS) of the NO-NO2system can be assessed based
on field observations in this study without model estimates. To assess the impact of MCMA emissions on O3 and its
precursors on regional and hemispheric scales, it is important to evaluate the loss and transformation processes of reactive nitrogen species (NOxto NOy, which is total reactive
nitro-gen oxides) in the course of transport of urban or industrial plumes. The emitted NOxcan be oxidized in the atmosphere
by OH, forming HNO3which is subject to removal from the
air mass through dry and wet deposition. The average life-time of NOyin urban, industrial (Nunnermacker et al., 2000)
or continental outflow plumes (Takegawa et al., 2004) ranges from 0.25 to several days; whereas that of NOxin each
envi-ronment is slightly shorter (less than 0.25 day in the former environment with longer lifetime in the latter environment e.g., 1–2 days).
In this study, we analyzed the NO-NO2 cyclic system in
different chemical regimes/air masses based on observations of reactive nitrogen species and peroxy radicals. The anal-ysis of PSS allows us to assess the current understanding of tropospheric NOx chemistry including the potential for
yet-unidentified chemical reactions. We also examined the NOx/NOyratios and ozone production efficiencies (OPEs) of
the polluted outflow from MCMA, providing some insight on the photochemical aging processes in various chemical regimes.
2 Observational data
The intensive field campaign of MIRAGE-Mex was car-ried out from 4 March to 29 March 2006, involving the
NSF/NCAR C-130 aircraft, ground-based measurements, and satellite observations. This campaign made numer-ous physico-chemical measurements such as reactive ni-trogen species, oxidized sulfur species, oxygenated VOCs, aerosols, peroxy radicals, and so on. It also included the measurements of actinic flux and atmospheric photolysis fre-quencies such as J(O3), J(NO2), J(HNO2), etc., with
5-s time re5-solution (Shetter et al., 2003). These measure-ments allow for the PSS analysis of the NO-NO2 system
and are also used for air mass classification. The full de-tails of measurements taken from C-130 during the field campaign can be found elsewhere (http://mirage-mex.acd. ucar.edu/Measurements/C130/index.shtml). Reactive nitro-gen species, including NO, NO2, NOy, and O3 were
mea-sured at 1 Hz with a chemiluminescence technique (Wein-heimer et al., 1998). For NO, NO2, and NOy, the
preci-sion of these measurements is near 15 pptv and the overall estimated uncertainties are ±(15+7% of the mixing ratio) pptv for NO,±(15+10% of the mixing ratio) pptv for NO2,
and±(15+15% of mixing ratio) pptv for NOy. As one of
key measurements for the analysis of NO-NO2PSS (Eq. 1),
peroxy radicals (HO2+RO2)were measured with the
four-channel CIMS at 3-s time interval (Cantrell et al., 2003). The overall estimated uncertainty of the peroxy radical mea-surement is±(2.5+17.5% of the mixing ratio) pptv. In this study, 1-min merged data sets were used, which were created to align chemical species measured with varying time res-olution and are available on MILAGRO/INTEX-B/IMPEX archive (ftp://ftp-air.larc.nasa.gov).
Twelve C-130 missions were flown during the campaign, covering the altitude from the surface to about 7 km. Most of the flights sampled air over the MCMA basin and central Mexico, and several of the flights extended over the Gulf of Mexico to sample continental outflow from the MCMA. Fig-ure 1 shows C-130 flight tracks during the field campaign. In the temporal coverage, data sets used in this study were mea-sured predominantly during daytime and (in smaller number) near sunrise and sunset. For this analysis, data were lim-ited to solar zenith angles (SZA) less than 85◦. The data of flight 6 were excluded in the PSS analysis due to malfunction of the ozone instrument.
3 Results and discussion
3.1 Air mass category
In order to analyze the NO-NO2cycling in different
Gulf of Mexico
z Mexico
Mexico City
Pacific Ocean
Texas
1 2 3
Fig. 1
1
Fig. 1.C-130 flight tracks during the MIRAGE-Mex field campaign (March 2006).
Table 1.Criteria for the determination of air mass category.
Altitude Geographical HCN C2Cl4 CO NOx SO2
(km) Location (pptv) (pptv) (ppbv) (ppbv) (ppbv)
BL 0.9 (F4)–1.2 (F1)∗
FTCO >{0.9 (F4)–1.2 (F1)} Continent
FTMA >{0.9 (F4)–1.2 (F1)} Marine
BB ≥189 ≥0.3 ≥81
TIC around Tula ≥67 ≥0.05 ≥0.15
Refinery
∗The number represents the range of minimum and maximum values for median values of BL heights of each flight (F1 to F12).
and Forecasting (WRF) with Chemistry, WRF-Chem, Tie et al., 2007 and references therein), and observations of trace gases (Table 1). For instance, the category for the BL air masses was determined based on meteorological parameters and WRF-Chem and those for FTCO and FTMA were based on geographical locations of airborne sampling. In addition, that for the BB was determined based on macroscopic servation (i.e., fire in nearby mountains) and chemical ob-servations (i.e., significant increase in concentration levels compared to previous flight legs) such as hydrogen cyanide (HCN), perchlorethene (C2Cl4), and CO (Gregory et al.,
1996; Li et al., 2000), while that for TIC was based on the concentration levels of CO, NOx, and SO2. A statistical
sum-mary of the concentrations observed in the different air mass categories is given in Table 2. The mean concentration of HCN for the BB (measured on 4, 22, and 23 March) is fac-tors of 1.5 (TIC), 1.8 (BL), 2.4 (FTMA), and 2.9 (FTCO) higher than those for other air mass categories. The mean
concentration of SO2for the TIC (measured on 10, 19, and
22 March) is higher than those for other air mass categories by factors ranging from 4.7 to 16.
High levels of NOx and NOy within the megacity result
from enhanced local emission sources such as combustion. Thus, NOxcan be a measure of anthropogenic impact at the
sampling position. In addition, the ratio of NOxto NOycan
be valuable for understanding the extent of chemical process-ing and as an indicator for photochemical age (Carroll et al., 1992), in spite of several limitations including the assump-tions of no physicochemical loss (only dilution of NOy), no
chemical transformation from NOyto NOx(e.g., thermal
de-composition of PAN), constant emission sources, and con-stant background concentration. In this field study, the mean NOx/NOyratio varied from 0.15 (FTMA) to 0.38 (BL),
NOy (ppb)
0 5 10 15 20 25 60
NO
x
/N
Oy
(ppb)
0.0 0.2 0.4 0.6 0.8 1.0
4 Mar 12 Mar 16 Mar 22 Mar 23 Mar 26 Mar 28 Mar
NOy (ppb)
0 5 10 15 20 60
NO
x
/N
Oy
(ppb)
0.0 0.2 0.4 0.6 0.8 1.0
8 Mar 10 Mar 12 Mar 19 Mar
NOy (ppb)
0 10 20 30 40 50 60
NO
x
/N
Oy
(ppb)
0.0 0.2 0.4 0.6 0.8 1.0
10 Mar 19 Mar 22 Mar
NOy (ppb)
0 10 20 30 40 50 60
NO
x
/N
Oy
(ppb)
0.0 0.2 0.4 0.6 0.8 1.0
4 Mar 8 Mar 10 Mar 16 Mar 19 Mar 22 Mar 23 Mar 26 Mar 29 Mar
NOy (ppb)
0 10 20 30 40 50 60
NO
x
/N
Oy
(ppb)
0.0 0.2 0.4 0.6 0.8 1.0
4 Mar 22 Mar 23 Mar
(a) BL (b) BB
(c) FTCO (d) FTMA
(e) TIC
1 2 3 4
1
Fig. 2.Relation between NOx/NOyand NOyfor 5 air mass categories (BLa, BBb, FTCOc, FTMAd, and TICe).
(Table 2). The slightly lower ratios for FTCO and FTMA indicated more photochemical aging.
The variation of NOx/NOyratios with concentration level
of NOy for each air mass is shown in Fig. 2, which can
provide information on the characteristics of different air masses. In general, some positive correlation might be ex-pected because high NOymay indicate proximity to sources
and high NOx/NOyratios indicate freshly emitted pollution
before much photochemical processing has occurred. For the BL, the ratios significantly varied from 0.1 to 1 with high NOy concentration, indicating a range of
photochem-ical ages. In contrast, the ratios for the BB were concen-trated at 0.2, with only a few values above 0.4. In general, the air masses for FTCO and FTMA appear to have similar-ity in the ratio patterns, with relatively low ratios (aged air) for NOylevels larger than a few ppbv, indicating that the
pol-luted plumes have aged substantially. However, the ratios for FTCO at low NOylevels (less than a few ppbv) showed larger
variation than the ratios for FTMA and those at high NOy
levels (greater than a few ppbv) were also somewhat lower. Note that the high ratios at low absolute NOywere not
af-fected by the low NOylevels which are significantly higher
than NOydetection limit. The ratios for the TIC correlate
fairly well with NOy, as might be expected from dilution and
aging of the plume from this fairly localized source. The NOx/NOy ratios during MIRAGE-Mex were
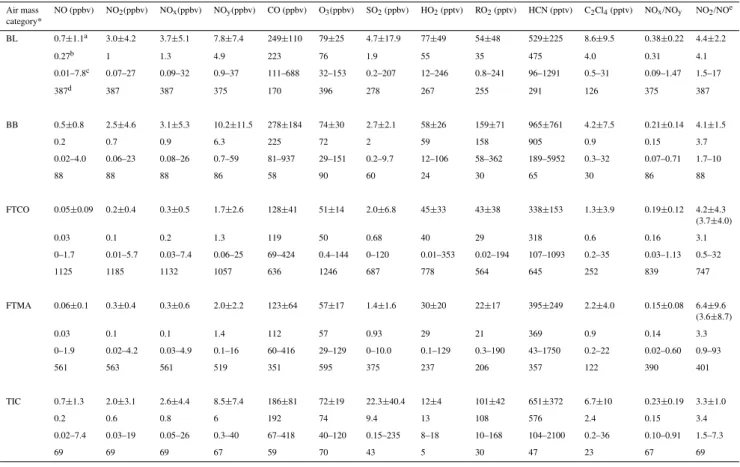
Table 2.A statistical summary of reactive nitrogen compounds, major air pollutants, and peroxy radicals with air mass categories measured during the MIRAGE field campaign.
Air mass NO (ppbv) NO2(ppbv) NOx(ppbv) NOy(ppbv) CO (ppbv) O3(ppbv) SO2(ppbv) HO2(pptv) RO2(pptv) HCN (pptv) C2Cl4(pptv) NOx/NOy NO2/NOe
category*
BL 0.7±1.1a 3.0±4.2 3.7±5.1 7.8±7.4 249±110 79±25 4.7±17.9 77±49 54±48 529±225 8.6±9.5 0.38±0.22 4.4±2.2
0.27b 1 1.3 4.9 223 76 1.9 55 35 475 4.0 0.31 4.1
0.01–7.8c 0.07–27 0.09–32 0.9–37 111–688 32–153 0.2–207 12–246 0.8–241 96–1291 0.5–31 0.09–1.47 1.5–17
387d 387 387 375 170 396 278 267 255 291 126 375 387
BB 0.5±0.8 2.5±4.6 3.1±5.3 10.2±11.5 278±184 74±30 2.7±2.1 58±26 159±71 965±761 4.2±7.5 0.21±0.14 4.1±1.5
0.2 0.7 0.9 6.3 225 72 2 59 158 905 0.9 0.15 3.7
0.02–4.0 0.06–23 0.08–26 0.7–59 81–937 29–151 0.2–9.7 12–106 58–362 189–5952 0.3–32 0.07–0.71 1.7–10
88 88 88 86 58 90 60 24 30 65 30 86 88
FTCO 0.05±0.09 0.2±0.4 0.3±0.5 1.7±2.6 128±41 51±14 2.0±6.8 45±33 43±38 338±153 1.3±3.9 0.19±0.12 4.2±4.3
(3.7±4.0)
0.03 0.1 0.2 1.3 119 50 0.68 40 29 318 0.6 0.16 3.1
0–1.7 0.01–5.7 0.03–7.4 0.06–25 69–424 0.4–144 0–120 0.01–353 0.02–194 107–1093 0.2–35 0.03–1.13 0.5–32
1125 1185 1132 1057 636 1246 687 778 564 645 252 839 747
FTMA 0.06±0.1 0.3±0.4 0.3±0.6 2.0±2.2 123±64 57±17 1.4±1.6 30±20 22±17 395±249 2.2±4.0 0.15±0.08 6.4±9.6
(3.6±8.7)
0.03 0.1 0.1 1.4 112 57 0.93 29 21 369 0.9 0.14 3.3
0–1.9 0.02–4.2 0.03–4.9 0.1–16 60–416 29–129 0–10.0 0.1–129 0.3–190 43–1750 0.2–22 0.02–0.60 0.9–93
561 563 561 519 351 595 375 237 206 357 122 390 401
TIC 0.7±1.3 2.0±3.1 2.6±4.4 8.5±7.4 186±81 72±19 22.3±40.4 12±4 101±42 651±372 6.7±10 0.23±0.19 3.3±1.0
0.2 0.6 0.8 6 192 74 9.4 13 108 576 2.4 0.15 3.4
0.02–7.4 0.03–19 0.05–26 0.3–40 67–418 40–120 0.15–235 8–18 10–168 104–2100 0.2–36 0.10–0.91 1.5–7.3
69 69 69 67 59 70 43 5 30 47 23 67 69
aMean±1σ;bMedian;cMin.-Max.;dNumber of data;eThe numbers in parenthesis are Mean±1σcalculated with the data set
correspond-ing to SZA≤85◦.
∗The category for the BL air masses was determined based on meteorological parameters and WRF-Chem; those for FTCO and FTMA based on geographical locations of airborne sampling; that for the BB based on hydrogen cyanide (HCN), perchlorethene (C2Cl4), and CO;
and that for TIC based on the concentration levels of CO, NOx, and SO2.
the ratios (0.13–0.15) for marine air during PEM-Tropics B (Maloney et al., 2001).
The absolute magnitude of chemical observations was also different with air mass categories. For instance, for the BB, O3and NOxconcentrations were relatively higher with mean
levels of 74 and 3.1 ppbv, respectively, higher than those for TIC, but less than those for the BL (79 and 3.7 ppbv, respec-tively) (Table 2). Mean concentrations of NO and NO2 for
the BB were 0.5 and 2.5 ppbv respectively. Except for the BL, the mean NO2 level for the BB was higher than those
in other air mass categories by at least a factor of 1.3 and as much as a factor of 13 for the FTCO. For FTCO, the mix-ing ratios of air pollutants such as O3and NOxwere low in
comparison to other air mass categories, with mean values of 51 and 0.3 ppbv. The relatively high NOxlevels for the BB
are likely to be affected by outflow from MCMA. NOx
en-richment was also reported in the forest fire emissions near MCMA during the MIRAGE-Mex campaign on a different airborne platform (Twin Otter), ascribed to the deposition of
nitrogen-containing pollutants in the outflow from the MC urban area (Yokelson et al., 2007). The concentrations of per-oxy radicals, HO2and RO2for the BB were 58 and 159 pptv,
respectively, which were factors of 1.3 to 4.8 (except for the BL) and 1.6 to 7.2 higher than those in other air mass cate-gories, respectively. TIC also showed significantly high RO2
concentrations (approximately 100 pptv).
3.2 Photostationary state analysis of NO-NO2system
The PSS of NO-NO2 systems with different air mass
cate-gories is shown in Fig. 3 and Table 3. The former shows the linear regression between NO2/NO and{k1[O3]+k3[HO2]+ k4[RO2]}/J(NO2) and the latter shows the statistical
FTMA
NO2/NO
0 5 10 15 60 80
(k 1 [O 3 ]+k 3 [HO 2 ]+ k4 [RO 2 ])/ J (NO 2 ) 0 5 10 15 60 80 Curve fit 8 Mar 10 Mar 12 Mar
Y = 0.885 X
r2 = 0.81
N = 172 Y = 1.299 X
r2 = 0.81
N = 408
FTCO
NO2/NO
0 5 10 15 60 80
(k1 [O 3 ]+k 3 [H O2 ]+k 4 [RO 2 ])/J(NO 2 ) 0 5 10 15 60 80 Curve fit 12 Mar 16 Mar 22 Mar 23 Mar 26 Mar 28 Mar
Y = 1.299 X
r2 = 0.81
N = 408
All data
NO2/NO
0 20 40 60 80
(k 1 [O 3 ]+ k3 [HO 2 ]+ k4 [RO 2 ]) /J (NO 2 ) 0 20 40 60 80
Y = 1.133 X
r2 = 0.73
N = 779
BL
NO2/NO
0 2 4 6 8 10 70 80
(k 1 [O 3 ]+ k3 [HO 2 ]+k 4 [RO 2 ]) /J (NO 2 ) 0 2 4 6 8 10 70 80 Curve fit 8 Mar 10 Mar 16 Mar 26 Mar 29 Mar
Y = 1.143 X
r2
= 0.80 N = 187
(b)
(c)
(a)
(d)
1 2 3 Fig. 3 1Fig. 3. Photostationary state analysis for the NO-NO2system during the MIRAGE-Mex field campaign (4 March to 29 March 2006) for
different air mass categories (alla, BLb, FTCOc, and FTMAd). The photostationary parameterφis the slope of these plots. The upper and lower (dotted) lines represent prediction intervals in 95% confidence level.
Table 3.Statistical summary of the PSS parameter (φ) and linear regression between NO2/NO and{k1[O3]+k3[HO2]+k4[RO2]}/J(NO2).
Air mass category Slopea Slope SEb Sc T-value P-value 1φ/φ(%) φ(mean±1σ) φ(median)
BL 1.14 0.012 0.75 91.97 0 21 1.19±0.24 1.14
FTCO 1.30 0.029 2.79 45.50 0 22 1.06±0.37 1.04
FTMA 0.89 0.018 1.48 50.18 0 21 0.93±0.27 0.92
All 1.13 0.017 2.42 66.75 0 – 1.08±0.37 1.06
Values were calculated from the data subset with SZA≤85◦.
1 φ
0 1 2 3 4 5 6
Altitude (km)
0 1 2 3 4 5 6
12 Mar 16 Mar 22 Mar 23 Mar 26 Mar 28 Mar
φ
0 1 2 3 4 5 6
Altitude (km)
0 1 2 3 4 5 6
8 Mar 10 Mar 12 Mar φ
0 1 2 3 4 5 6
Alt
itude (km)
0 1 2 3 4 5 6
φ
0 1 2 3 4 5 6
Al
ti
tude (
k
m)
0 1 2 3 4 5 6
8 Mar 10 Mar 16 Mar 26 Mar 29 Mar
(c) FTCO
(d) FTMA
(a) All data
(b) BL
1
Fig. 4
2 7
Fig. 4.Vertical profile of the PSS parameter (φ) for 3 air mass categories (alla, BLb, FTCOc, and FTMAd).
n=4 for TIC). The PSS parameter (φ) is defined as follows:
φ= {k1[O3] +k3[HO2] +k4[RO2]}/J2 [NO2]/[NO]
(2) In Eq. (2), the reaction rate constants (k1, k3, and k4) are
taken from Sander et al. (2002) andk4is the coefficient
cor-responding to the reaction between NO with CH3O2. All
rate coefficients were adjusted for the temperatures measured during the flights. If Reactions (1–4) represent adequately the NO-NO2 partitioning, the calculated value ofφ(or the
slope of Fig. 3) would be expected to be near unity. Note thatφ<1 (orφ>1) indicates that the calculated [NO2] is less
(higher) than observed [NO2] and that concentration levels
of observed peroxy radicals (e.g., [HO2] and [RO2]) are too
low (high) to sustain PSS, implying a large deviation from the PSS. Note that there was no impact of data near sunrise and sunset (SZA>85◦) on theφcalculations and the linear regression due to lack of measurement parameters on a com-mon time base over these periods. The mean PSS parameter
(φ) and the slope of the best-fit line in the Fig. 3 were sim-ilar, except for FTCO (Table 3). The meanφvalues ranged from 0.93 (FTMA) to 1.19 (BL) with the mean value of 1.08 for all data (Fig. 3a). Based on error propagation analysis using measurement uncertainties, the uncertainty (1σ) of the parameterφis estimated to range from 21 to 22%.
In general, NO2/NO ratios are near PSS,
show-ing a strong correlation (r2=0.73) with the value of
{k1[O3]+k3[HO2]+k4[RO2]}/J2. A slightly higher mean φ
value (1.19) for BL was estimated, compared to those (1.06 and 0.93) for FTCO and FTMA. As the key components of NO-NO2partitioning, the concentrations of ozone and
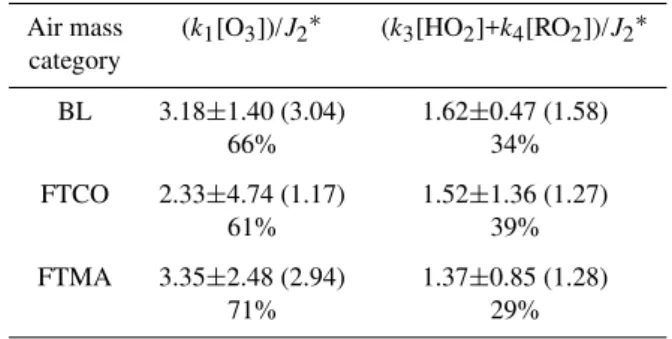
per-oxy radicals for BL were up to a factor of 1.5 and 2.5 higher than those for FTCO and FTMA, respectively. Table 4 shows the contribution of ozone and peroxy radicals to the observed NO2/NO ratio, where the statistical values were calculated
1 φ
0 1 2 3 4 5 6
Sola
r
ze
nit
h
angle (degree)
0 10 20 30 40 50 60 70 80 90
12 Mar 16 Mar 22 Mar 23 Mar 26 Mar 28 Mar
φ
0 1 2 3 4 5 6
Sola
r
ze
nit
h
angle (degree)
0 10 20 30 40 50 60 70 80 90
8 Mar 10 Mar 12 Mar φ
0 1 2 3 4 5 6
Solar
zenith angle
(degr
ee)
0 10 20 30 40 50 60 70 80 90
φ
0 1 2 3 4 5 6
Solar zenith angle (degre
e)
0 10 20 30 40 50 60 70 80 90
8 Mar 10 Mar 16 Mar 26 Mar 29 Mar
(c) FTCO
(d) FTMA
(a) All data
(b) BL
1
Fig. 5 2
7
Fig. 5.Relation between solar zenith angle (SZA) and the PSS parameter (φ) for 3 air mass categories (alla, BLb, FTCOc, and FTMAd).
Table 4. Contribution of O3and peroxy radicals to the NO2/NO ratios.
Air mass (k1[O3])/J2∗ (k3[HO2]+k4[RO2])/J2∗
category
BL 3.18±1.40 (3.04) 1.62±0.47 (1.58)
66% 34%
FTCO 2.33±4.74 (1.17) 1.52±1.36 (1.27)
61% 39%
FTMA 3.35±2.48 (2.94) 1.37±0.85 (1.28)
71% 29%
Values were calculated from the data set with SZA≤85◦. ∗The number in parenthesis represents a median value.
As noted above, the discrepancy between the observed [NO2]/[NO] ratios (denominator in Eq. 2) and calculated
ratios (numerator in Eq. 2) was slightly different with air mass types. For instance, the discrepancy for BL was 12 to 28% higher than that for FTCO (t-test, P-value=1.22×10⁻⁶)
and FTMA (P-value=8.90×10⁻¹⁹). In addition, the PSS value for each air mass is statistically different from unity (t-value=10.83 for BL, 3.28 for FTCO, and−3.40 for FTMA). In other words, the PSS values for the BL and FTCO were higher than unity, whereas that for FTMA was lower than unity. Interestingly, the marine atmosphere only showed value less than unity. As shown in Fig. 3, the PSS values in the lower altitude were somewhat higher than unity, whereas those in the higher altitude were lower than unity. One poten-tial of this can be in part vertical iodine levels, which was in-directly supported by vertical CH3I profile showing slightly
1
NOz (ppb)
0 5 10 15 20 25 30 35
O3 +N O2 (ppb ) 0 20 40 60 80 100 120 140 160 180 10 Mar 19 Mar 22 Mar
Y = 4.5 X + 49 r2 = 0.91 N = 67
NOz (ppb)
0 5 10 15 20 25 30 35
O3 +N O2 (p pb) 0 20 40 60 80 100 120 140 160 180 8 Mar 10 Mar 12 Mar 19 Mar
Y = 8.5 X + 43 r2 = 0.82 N = 518
NOz (ppb)
0 5 10 15 20 25 30 35
O3 +N O2 (ppb ) 0 20 40 60 80 100 120 140 160 180 4 Mar 12 Mar 16 Mar 22 Mar 23 Mar 26 Mar 28 Mar
Y = 5.9 X + 44 r2
= 0.80 N = 1044
NOz (ppb)
0 5 10 15 20 25 30 35
O3 +N O2 (p pb) 0 20 40 60 80 100 120 140 160 180 4 Mar 8 Mar 10 Mar 16 Mar 19 Mar 22 Mar 23 Mar 26 Mar 29 Mar
Y = 5.3 X + 59 r2
= 0.54
N = 367
NOz (ppb)
0 5 10 15 20 25 30 35
O3 +N O2 ( ppb) 0 20 40 60 80 100 120 140 160 180 4 Mar 22 Mar 23 Mar
Y = 4.6 X + 43 r2
= 0.89 N = 86
(a) BL
(b) BB
(c) FTCO (d) FTMA
(e) TIC
1 2 7
Fig. 6.Correlation between O3+NO2and NOzfor 5 air mass categories (BLa, BBb, FTCOc, FTMAd, and TICe).
The discrepancy between the observed and calculated ra-tios can suggest the possibility of lack of current understand-ing of the tropospheric chemistry mechanism. The poten-tial role of iodine chemistry in NO2/NO ratio change has
been suggested based on field, model, and kinetic studies (Chameides and Davis, 1980; Davis et al., 1996; Knight and Crowley, 2001). Recently, significant impact of iodine chem-istry (e.g., reaction of IO with NO producing NO2) on the
observed NO2/NO ratio has been reported for the field study
at Rishiri island, Japan (Kanaya et al., 2002, 2007). For the source of IO radicals, the photolysis of iodocarbons (CH3I,
CH2I2, C2H5I, and CH2ICl), followed by the reaction of O3
and I can produce the IO radical. It has been reported that the source strength for iodocarbons such as CH2I2, C2H5I, and
CH2ICl could possibly exceed that for CH3I (Davis et al.,
1996 and references therein). In high biological productiv-ity regions, CH3I concentration in the coastal air reached as
high as 43 pptv (Oram and Penkett, 1994). When the iodine chemistry scenario is applied to this study, the IO mixing ra-tio required to reproduce the PSS of NO-NO2 system (i.e.,
seawater (Bulgakov et al., 2005). In the tropical region, there is the strong vertical mixing of CH3I from boundary layer to
free troposphere (Davis et al., 1996). Thus, this suggests the potential role of halogen chemistry in NO2/NO ratio shift for
the marine atmosphere.
It appears that there is slight trend in the PSS parameterφ
in terms of altitude (above ground level and a.s.l.) (Fig. 4). With increasing altitudes, the proportion ofφvalues less than 1 generally increases, especially for FTCO and FTMA. In addition, the relation betweenφand SZA is shown in Fig. 5. There was no clear trend between these two parameters. For the BL, theφvalues were almost constant regardless of the SZA. Theφvalues for the FTCO showed large variation both at the ranges from 25 to 30◦SZA and from 70 to 85◦SZA, whereas they were almost uniform in between. However,φ
values for FTMA varied significantly but not systematically with SZA.
According to a previous study of the PSS analysis of NO-NO2system (Crawford et al., 1996), the PSS parameter (φ)
was reported to range from 0.30 to 0.75, estimated for several airborne sampling campaigns such as PEM-West A, CITE-3, ABLE-3B, CITE-2, and TRACE-A. From these campaigns, most φ values were close to 0.71, but that for PEM-West A (0.30) was significantly lower in comparison. The cause for the significantly large deviation from the PSS in PEM-West A was suggested to be interference in the NO2
mea-surement and this possibility stimulated improvements to the measurement technique during PEM-Tropics A (Bradshaw et al., 1999).
3.3 Ozone Production Efficiency (OPE)
Photochemical oxidation of NOx and its oxidation
prod-ucts were interrelated with O3 formation during the
day-time. The OPE, which is the number of O3 molecules
produced per molecule of NOx oxidized (Kleinman et al.,
2002 and references therein), was estimated using the lin-ear regression slope between O3and oxidized NOxproducts
(NOz=NOy−NOx). Figure 6 shows the correlation between
odd oxygen (O3+NO2) and NOz, with OPEs for the 5 air
mass categories in this field campaign ranging from 4.5 (TIC) to 8.5 (FTMA), indicating progressively more photochemi-cally aged air masses. In general, higher efficiencies (5.9– 8.5) were observed in FTCO and FTMA, which can be sup-ported in part by lower NO2/NO ratios, whereas lower OPEs
(4.5–4.6) were found in TIC and BB. To some extent, these lower OPEs in TIC and BB might result from high NO lev-els (0.5–0.7 ppbv) that are enough to cause enhancements in OH levels and thus shorten NOxlifetime, and from higher
or-ganic peroxy radicals leading to additional NOxloss through
organic nitrate formation. The OPEs in this field campaign were within the OPE ranges for the urban and rural atmo-sphere (Rickard et al., 2002 and references therein).
4 Summary and conclusions
Previous studies testing the NO-NO2cyclic system were
con-ducted in urban and remote areas using observations of O3
(R1) and/or peroxy radicals (R3–R4). These earlier studies used the concentrations of model-predicted peroxy radicals test the PSS for NO-NO2cyclic system and indicated that the
peroxy radicals were not sufficient to explain the observed NO2/NO ratio. In addition, the model-predicted NO2levels
in previous studies were reported to be somewhat lower than observations. In this study, we analyzed the NO-NO2system
in different chemical regimes/air masses based on observa-tions of reactive nitrogen species and peroxy radicals mea-sured during the intensive field campaign of MIRAGE-Mex (4 March to 29 March 2006). For the PSS analysis, the air mass was categorized into 5 groups such as BL, BB, FTCO, FTMA, and TIC.
In general, NO2/NO ratios seem to be near PSS. In
addi-tion, the PSS value (φ) for each air mass is statistically dif-ferent from unity. In other words, the PSS values for the BL and FTCO were higher than unity, whereas that for FTMA was lower than unity. Overall, there was no distinct PSS de-pendence on altitude and SZA. The mean NOx/NOy ratios
varied from 0.15 (FTMA) to 0.38 (BL), indicating less pho-tochemically aged air masses of polluted plume exiting Mex-ico City Metropolitan Area. Ozone production efficiencies ranged from 4.5 (TIC) to 8.5 (FTMA). The potential role of halogen chemistry in NO2/NO ratio shift (i.e., lowering the
PSS parameter,φ) in the marine atmosphere (FTMA case) can not be excluded according to our simple estimated IO concentration for the conversion of NO to NO2by IO. Acknowledgements. ZHS was financially supported by the Climate Environment System Research Center sponsored by the SRC program of Korea Science and Engineering Foundation. The authors thank John Holloway for providing SO2data, Don Blake
for C2Cl4data, and Paul Wennberg and John Crounse for providing the HCN data used in this analysis; measurements of HCN supported by NASA (NNG06GB32G). The National Center for Atmospheric Research is operated by the University Corporation for Atmospheric Research under the sponsorship of the National Science Foundation.
Edited by: L. Molina
References
Allan, B., McFiggans, G., and Plane, J.: Observations of iodine monoxide in the remote marine boundary layer, J. Geophys. Res., 105(D11), 14 363–14 369, 2000.
Bulgakow, S. N., Bulgakow, N. P., Mikhailova, E. N., and Shapiro, N. B.: Generation of upwelling near the Pacific coast of Mexico, Phys. Oceanol., 15, 27–36, 2005.
Cantrell, C. A., Edwards, G. D., Stephens, S., Mauldin, L., Kosci-uch, E., Zondlo, M., and Eisele, F.: Peroxy radical observations using chemical ionization mass spectrometry during TOPSE, J. Geophys. Res., 108(D6), 8371, doi:10.1029/2002JD002715, 2003.
Cantrell, C. A., Shetter, R. E., Calvert, J. G., Eisele, F. L., Williams, E., Baumann, K., Brune, W. H., Stevens, P. S., and Mather, J. H.: Peroxy radicals from photostationary state deviations and steady state calculations during the Tropospheric OH Photochemistry Experiment at Idaho Hill, Colorado, 1993, J. Geophys. Res., 102(D5), 6369–6378, doi:10.1029/96JD01703, 1997.
Carroll, M. A., Ridley, B. A., Montzka, D. D., H¨ubler, G., Walega, J. G., Norton, R. B., Huebert, B. J., and Grahek, F. E.: Mea-surements of nitric oxide and nitrogen dioxide during the Mauna Loa Observatory Photochemistry Experiment, J. Geophys. Res., 97(D10), 10 361–10 374, 1992.
Chameides, W. L. and Davis, D. D.: Iodine: its possible role in tro-pospheric chemistry, J. Geophys. Res., 85(12), 7383–7398, 1980. Crawford, J., Davis, D., Chen, G., Bradshaw, J., Sandholm, S., Gre-gory, G., Sachse, G., Anderson, B., Collins, J., Blake, D., Singh, H., Heikes, B., Talbot, R., and Rodriguez, J.: Photostationary state analysis of the NO2-NO system based on airborne
obser-vations from the western and central North Pacific, J. Geophys. Res., 101(D1), 2053–2072, doi:10.1029/95JD02201, 1996. Davis, D., Crawford, J., Liu, S., McKeen, S., Bandy, A., Thornton,
D., Rowland, F., and Blake, D.: Potential impact of iodine on tro-pospheric levels of ozone and other critical oxidants, J. Geophys. Res., 101(D1), 2135–2147, doi:10.1029/95JD02727, 1996. Gregory, G. L., Fuelberg, H. E., Longmore, S. P., Anderson, B. E.,
Collins, J. E., and Blake, D. R.: Chemical characteristics of tro-pospheric air over the tropical South Atlantic Ocean: Relation-ship to trajectory history, J. Geophys. Res., 101(D19), 23 957– 23 972, doi:10.1029/96JD01160, 1996.
Kanaya, Y., Tanimoto, H., Matsumoto, J., Furutani, H., Hashimoto, S., Komazaki, Y., Tanaka, S., Yokouchi, Y., Kato, S., Kajii, Y., and Akimoto, H.: Diurnal variations in H2O2, O3, PAN, HNO3
and aldehyde concentrations and NO/NO2ratios at Rishiri
Is-land, Japan: Potential influence from iodine chemistry, Sci. Total Environ., 376, 185–197, 2007.
Kanaya, Y., Yokouchi, Y., Matsumoto, J., Nakamura, K., Kato, S., Tanimoto, H., Furutani, H., Toyota, K., and Aki-moto, H.: Implications of iodine chemistry for daytime HO2 levels at Rishiri Island, Geophys. Res. Lett., 29, 1212,
doi.:10.1029/2001GL014061, 2002.
Kleinman, L. I., Daum, P. H., Lee, Y. -N., Nunnermacker, L. J., Springston, S. R., Weinstein-Lloyd, J., and Rudolph, J.: Ozone production efficiency in an urban area, J. Geophys. Res., 107(D23), 4733, doi:10.1029/2002JD002529, 2002.
Knight, G. P. and Crowley, J. N.: The reactions of IO with HO2,
NO and CH3SCH3: flow tube studies of kinetics and product
formation, Phys. Chem. Chem. Phys., 3(3) 393–401, 2001. Koike, M., Kondo, Y., Kita, K., et al.: Export of
anthro-pogenic reactive nitrogen and sulfur compounds from the East Asia region in spring, J. Geophys. Res., 108(D20), 8789, doi:10.1029/2002JD003284, 2003.
Li, Q., Jacob, D. J., Bey, I., Yantosca, Y. M., Zhao, Y., Kondo, Y.,
and Notholt, J.: Atmospheric hydrogen cyanide (HCN): biomass burning source, ocean sink?, Geophys. Res. Lett., 27(3), 357– 360, 2000.
Maloney, J. C., Fuelberg, H. E., Avery, M. A., Crawford, J. H., Blake, D. R., Heikes, B. G., Sachse, G. W., Sandholm, S. T., Singh, H., and Talbot, R. W.: Chemical characteristics of air from different source regions during the second Pacific Exploratory Mission in the Tropics (PEM-Tropics B), J. Geophys. Res., 106(D23), 32 609–32 626, doi:10.1029/2001JD900100, 2001. McFiggans, G., Plane, J., Allan, B., and Carpenter, L.: A
model-ing study of iodine chemistry in the marine boundary layer, J. Geophys. Res., 105(D11), 14 371–14385, 2000.
Nunnermacker, L. J., Kleinman, L. I., Imre, D., Daum, P. H., Lee, Y.-N., Lee, J. H., Springston, S. R., Newman, L., and Gillani, N.: NOylifetimes and O3production efficiencies in urban and power
plant plumes: Analysis of field data, J. Geophys. Res., 105(D7), 9165–9176, doi:10.1029/1999JD900753, 2000.
Oram, D. E. and Penkett, S.A.: Observations in eastern England of elevated methyl iodide concentrations in air of Atlantic origin, Atmos. Environ., 28, 1159–1174, 1994.
Raga, G. and Raga, A.: On the formation of an elevated ozone peak in Mexico City, Atmos. Environ., 34, 4097–4102, 2000. Raga, G., Baumgardner, D., Castro, T., Mart´ınez-Arroyo, A., and
Navarro-Gonz´alez, R.: Mexico City air quality: a qualitative re-view of gas and aerosol measurements (1960–2000), Atmos. En-viron., 35, 4041–4058, 2001.
Ridley, B. A., Madronich, S., Chatfield, R. B., Walega, J. G., Shet-ter, R. E., Carroll, M. A., and Montzka, D. D.: Measurements and model simulations of the photostationary state during MLOPEX: Implications for radical concentrations and ozone production and loss rates, J. Geophys. Res., 97, 10 375–10 388, 1992.
Rickard, A. R., Salisbury, G., Monks, P. S., Lewis, A. C., Baugitte, S., Bandy, B. J., Clemitshaw, K. C., and Penkett S. A.: Com-parison of measured ozone production efficiencies in the marine boundary layer at two European coastal sites under different pol-lution regimes, J. Atmos. Chem., 43, 107–134, 2002.
Saiz-Lopez, A. and Plane, J. M. C.: Novel iodine chemistry in the marine boundary layer, Geophys. Res. Lett., 31, L04112, doi:10.1029/2003GL019215, 2004.
Sander, S. P., Friedl, R. R., Golden, D. M., Kurylo, M. J., Moort-gat, G. K., Ravishankara, A. R., Kolb, C. E., Molina, M. J., and Finlayson-Pitts, B. J.: Chemical kinetics and photochemical data for use in stratospheric modeling, Jet Propulsion Laboratory Pub-lication 02–25, Jet Propulsion Laboratory, Pasadena, California, 2002.
Shetter, R. E., Cinquini, L., Lefer, B. L., Hall, S. R., and Madronich, S.: Comparison of airborne measured and calculated spec-tral actinic flux and derived photolysis frequencies during the PEM Tropics B mission, J. Geophys. Res., 108(D2), 8234, doi:10.1029/2001JD001320, 2003.
Soltic, P. and Weilenmann, M.: NO2/NO emissions of gasoline pas-senger cars and light-duty trucks with Euro-2 emission standard, Atmos. Environ., 37, 5207–5216, 2003.
Takegawa, N., Kondo, Y., Koike, M., et al.: Removal of NOxand
NOyin Asian outflow plumes: Aircraft measurements over the
western Pacific in January 2002, J. Geophys. Res., 109, D23S04, doi:10.1029/2004JD004866, 2004.
oxidants in Mexico City: A regional chemical dynamical model (WRF-Chem) study, Atmos. Environ., 41, 1989–2008, 2007. Weinheimer, A. J., Montzka, D. D., Campos, T. L., et al.:
Compar-ison between DC-8 and ER-2 species measurements in the trop-ical middle troposphere: NO, NOy, O3, CO2, CH4, and N2O, J.
Geophys. Res., 103(D17), 22 087–22 096, 1998.
Yokelson, R. J., Urbanski, S. P., Atlas, E. L., Toohey, D. W., Al-varado, E. C., Crounse, J. D., Wennberg, P. O., Fisher, M. E., Wold, C. E., Campos, T. L., Adachi, K., Buseck, P. R., and Hao, W. M.: Emissions from forest fires near Mexico City, Atmos. Chem. Phys., 7, 5569–5584, 2007,