ACPD
12, 22139–22198, 2012A synthesis based on existing literature
and new results
V.-M. Kerminen et al.
Title Page
Abstract Introduction
Conclusions References
Tables Figures
◭ ◮
◭ ◮
Back Close
Full Screen / Esc
Printer-friendly Version Interactive Discussion
Discussion
P
a
per
|
Dis
cussion
P
a
per
|
Discussion
P
a
per
|
Discussio
n
P
a
per
|
Atmos. Chem. Phys. Discuss., 12, 22139–22198, 2012 www.atmos-chem-phys-discuss.net/12/22139/2012/ doi:10.5194/acpd-12-22139-2012
© Author(s) 2012. CC Attribution 3.0 License.
Atmospheric Chemistry and Physics Discussions
This discussion paper is/has been under review for the journal Atmospheric Chemistry and Physics (ACP). Please refer to the corresponding final paper in ACP if available.
Cloud condensation nuclei production
associated with atmospheric nucleation:
a synthesis based on existing literature
and new results
V.-M. Kerminen1, M. Paramonov1, T. Anttila2, I. Riipinen3, C. Fountoukis4, H. Korhonen5, E. Asmi2, L. Laakso2, H. Lihavainen2, E. Swietlicki6,
B. Svenningsson6, A. Asmi1, S. N. Pandis4, M. Kulmala1, and T. Pet ¨aj ¨a1
1
Department of Physics, University of Helsinki, 00014 Helsinki, Finland 2
Finnish Meteorological Institute, Research and Development, 00101 Helsinki, Finland 3
Department of Applied Environmental Science & Bert Bolin Centre for Climate Research, Stockholm University, 11418, Stockholm, Sweden
4
Institute of Chemical Engineering Sciences, Foundation for Research and Technology Hellas (ICEHT/FORTH), Patras, Greece
5
Finnish Meteorological Institute, Kuopio Unit, 70211, Kuopio, Finland 6
ACPD
12, 22139–22198, 2012A synthesis based on existing literature
and new results
V.-M. Kerminen et al.
Title Page
Abstract Introduction
Conclusions References
Tables Figures
◭ ◮
◭ ◮
Back Close
Full Screen / Esc
Printer-friendly Version Interactive Discussion
Discussion
P
a
per
|
Dis
cussion
P
a
per
|
Discussion
P
a
per
|
Discussio
n
P
a
per
|
Received: 14 August 2012 – Accepted: 16 August 2012 – Published: 28 August 2012
Correspondence to: V.-M. Kerminen (veli-matti.kerminen@helsinki.fi) and T. Pet ¨aj ¨a (tuukka.petaja@helsinki.fi)
ACPD
12, 22139–22198, 2012A synthesis based on existing literature
and new results
V.-M. Kerminen et al.
Title Page
Abstract Introduction
Conclusions References
Tables Figures
◭ ◮
◭ ◮
Back Close
Full Screen / Esc
Printer-friendly Version Interactive Discussion
Discussion
P
a
per
|
Dis
cussion
P
a
per
|
Discussion
P
a
per
|
Discussio
n
P
a
per
|
Abstract
This paper synthesizes the available scientific information connecting atmospheric nu-cleation with subsequent Cloud Condensation Nuclei (CCN) formation. We review both observations and model studies related to this topic, and discuss the potential climatic implications. We conclude that CCN production associated with atmospheric nucleation
5
is both frequent and widespread phenomenon in many types of continental boundary layers, and probably also over a large fraction of the free troposphere. The contribu-tion of nucleacontribu-tion to the global CCN budget spans a relatively large uncertainty range, which, together with our poor understanding of aerosol–cloud interactions, results in major uncertainties in the radiative forcing by atmospheric aerosols. In order to
bet-10
ter quantify the role of atmospheric nucleation in CCN formation and Earth System behavior, more information is needed on (i) the factors controlling atmospheric CCN production and (ii) the properties of both primary and secondary CCN and their inter-connections. In future investigations, more emphasis should be put on combining field measurements with regional and large-scale model studies.
15
1 Introduction
Interactions between atmospheric aerosol particles and clouds constitute the largest uncertainty in estimating the current radiative forcing of the Earth’s atmosphere (e.g. Forster et al., 2007; Quaas et al., 2009; Koch and Del Genio, 2010; Penner et al., 2011), making it very difficult to predict the future climate change (Schwartz et al., 2010). In
20
regional scales, aerosol particles are capable of modifying several cloud properties relevant to both climate and our everyday life. These include cloud microphysical prop-erties (e.g. Mccomiskey et al., 2009; Shao and Liu, 2009), cloud cover and lifetime (e.g. Kaufman and Koren, 2006; Small et al., 2009), and the probability of clouds pre-cipitating (Rosenfeld et al., 2008; Khain, 2009; Sorooshian et al., 2009; Stevens and
25
Feingold, 2009).
ACPD
12, 22139–22198, 2012A synthesis based on existing literature
and new results
V.-M. Kerminen et al.
Title Page
Abstract Introduction
Conclusions References
Tables Figures
◭ ◮
◭ ◮
Back Close
Full Screen / Esc
Printer-friendly Version Interactive Discussion
Discussion
P
a
per
|
Dis
cussion
P
a
per
|
Discussion
P
a
per
|
Discussio
n
P
a
per
|
The key aerosol property affecting their interaction with warm clouds is the cloud con-densation nuclei (CCN) spectrum, i.e. the number concentration of CCN as a function of water vapor saturation ratio. During the last few decades, CCN number concentra-tions and spectra have been measured in a large variety of environments (e.g. Twomey, 1959; Squires and Twomey, 1966; Hobbs et al., 1980; Hudson, 1993; Snider and
Bren-5
quier, 2000; Bigg and Leck, 2001; Delene and Deshler, 2001; Hudson and Yum, 2002; Roberts et al., 2006; Detwiler et al., 2010). Such studies have brought us plenty of insight into the spatial and temporal variability of the CCN concentration and its depen-dence on bulk aerosol properties, such as the total particle number concentration and aerosol optical properties (Andreae, 2009; Jefferson, 2010).
10
Recent developments in size resolved chemical measurements have allowed for detailed investigations between the CCN spectrum, aerosol number size distribution, and size-resolved chemical composition of the aerosol. Several investigators have dis-cussed the relative importance of the particle size and chemical composition in de-termining its capability to act as CCN (Dusek et al., 2006; Hudson, 2007; Kuwata and
15
Kondo, 2008; Quinn et al., 2008; Twohy and Anderson, 2008), while others have studied the role of aerosol mixing state in determining its CCN properties (e.g. Ervens et al., 2010; Kammermann et al., 2010; Rose et al., 2010; Wang et al., 2010; Wex et al., 2010). In general, these investigations demonstrate that the particle number size dis-tribution is the most important quantity in determining the CCN number concentration,
20
followed by the aerosol chemical composition. The aerosol mixing state is important close to major anthropogenic source areas.
Understanding the relation between aerosol and their precursor emissions, atmo-spheric aerosol particle populations, clouds and, eventually, climate is not possible without quantification of the sources responsible for atmospheric CCN (Andreae and
25
ACPD
12, 22139–22198, 2012A synthesis based on existing literature
and new results
V.-M. Kerminen et al.
Title Page
Abstract Introduction
Conclusions References
Tables Figures
◭ ◮
◭ ◮
Back Close
Full Screen / Esc
Printer-friendly Version Interactive Discussion
Discussion
P
a
per
|
Dis
cussion
P
a
per
|
Discussion
P
a
per
|
Discussio
n
P
a
per
|
Luo and Yu, 2011a). Field experiments have also shown substantial local enhance-ments in CCN concentrations due to atmospheric nucleation (e.g. Wiedensohler et al., 2009; Sihto et al., 2011; Yue et al., 2011). No analysis combining these two types of investigations has been performed so far, as a result of which we lack a proper view on the role of nucleation in providing new CCN in different atmospheric environments.
5
In this paper, we will synthesize the existing knowledge on CCN production associ-ated with atmospheric nucleation. In addition to reviewing the published literature on this topic, we will present new experimental data and model results. We will start our analysis by looking at the connection between nuclei growth and their ability to act as CCN (Sect. 2). After that we will review the existing observations on CCN production
10
resulting from atmospheric nucleation, and present some new data representing long-term observations at a few measurement locations (Sect. 3). In Sect. 4 we will review the existing model simulations of atmospheric CCN production from nucleation. Con-cluding remarks and outlook for future work will then be presented in Sect. 5. We will constrain our investigation to those CCN that originate from nucleation taking place
15
in the atmosphere. CCN resulting from the atmospheric processing of small primary aerosol particles, while extremely important as well (e.g. Adams and Seinfeld, 2003; Luo and Yu, 2011a), will not be considered here.
2 Connection between nucleation, CCN growth and cloud droplet activation
2.1 Threshold sizes for atmospheric CCN
20
2.1.1 Theory
Cloud Condensation Nuclei (CCN) are defined here as particles that can activate at a given water saturation ratio, Swat. Activation refers to indefinite growth of a particle due to condensation of water vapor at constant Swat. Here we apply the κ-Koehler theory (Petters and Kreidenweis, 2007) to link physico-chemical properties of particles
25
ACPD
12, 22139–22198, 2012A synthesis based on existing literature
and new results
V.-M. Kerminen et al.
Title Page
Abstract Introduction
Conclusions References
Tables Figures
◭ ◮
◭ ◮
Back Close
Full Screen / Esc
Printer-friendly Version Interactive Discussion
Discussion
P
a
per
|
Dis
cussion
P
a
per
|
Discussion
P
a
per
|
Discussio
n
P
a
per
|
to their CCN activation ability. Accordingly, the equilibrium saturation ratio of water vapor above the surface of a particle,Seq, can be expressed as follows:
Seq=
d3−ddry3
d3−d3
dry(1−κ) exp
A d
, whereA=4σs/aMw
RT ρw . (1)
Here d and ddry are the particle wet and dry sizes, respectively, σs/a is the surface tension of the solution/air interface,Mwis the molecular weight of water,R is the
uni-5
versal gas constant,T is temperature, andρwis the density of water. The particle water uptake properties are described by the parameterκ: larger values ofκimply larger hy-groscopicity and vice versa. Despite its simplicity, evidence from field, laboratory and modeling studies show that Eq. (1) provides relatively accurate link between the par-ticle size, its chemical composition and CCN activity (Petters and Kreidenweis, 2007;
10
Pringle et al., 2010 and references therein; Rissler et al., 2010).
The critical saturation ratio Sc, i.e. the saturation ratio of water vapor needed for a particle with a certain dry size,ddry, to act as CCN, can be found by calculatingSeq
as a function of the droplet diameterd and finding the maxima of the resulting curve. Conversely, for a given water supersaturation ratio, Eq. (1) can be solved iteratively to
15
find the corresponding diameterdc, i.e. the minimum dry diameter needed for activa-tion (threshold diameter). When the solute volume can be neglected at the stage of activation, Eq. (1) simplifies to the following form (Rissler et al., 2010):
ln(Sc)= s
4A3 27 d
−3/2 dry κ−
1/2. (2)
The value of the threshold diameter can be found using Eq. 2 by solving the equation
20
with respect toddry.
ACPD
12, 22139–22198, 2012A synthesis based on existing literature
and new results
V.-M. Kerminen et al.
Title Page
Abstract Introduction
Conclusions References
Tables Figures
◭ ◮
◭ ◮
Back Close
Full Screen / Esc
Printer-friendly Version Interactive Discussion
Discussion
P
a
per
|
Dis
cussion
P
a
per
|
Discussion
P
a
per
|
Discussio
n
P
a
per
|
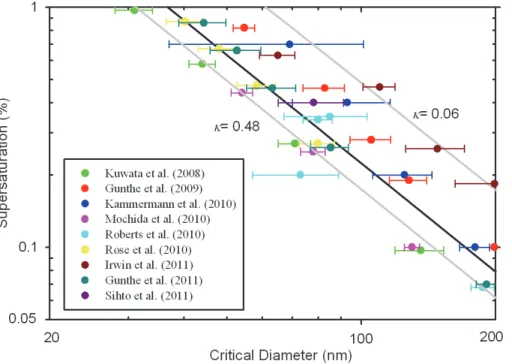
The calculations were performed using Eq. (1), and theκ values were chosen accord-ing to the study of Praccord-ingle et al. (2010), who simulated global distributions ofκ values with a large-scale climate model and reported a global mean value of 0.27±0.21 for continental regions. As can be seen from Fig. 1, the particles need to have a size of a few tens of nanometers at the very least before they can act as CCN under
atmo-5
spheric conditions. The threshold diameter depends strongly on the water vapor su-persaturation, such that the slopes of the curves displayed in Fig. 1 are equal to−3/2. Variations in the particle hygroscopicity are also reflected in the threshold diameter:
dc varies by more than a factor of two between the two extreme values of κ. Despite such large variability, it can be argued that the size is relatively more important in CCN
10
activation on the basis of Eq. (2) asSc is more sensitive toddrythan toκ.
In addition to the hygroscopic properties of particles described by the parame-ter κ in Eq. (1), there are other chemical effects that might affect CCN activation. These include droplet surface tension reduction caused by various surfactants (Fac-chini et al., 1999), associated surface-to-bulk partitioning of surface-active material
15
(Sorjamaa et al., 2004; Prisle et al., 2010), and increases in the amount of the soluble material in humid aerosol particle prior to their activation due to the presence of slightly-soluble compounds in “dry” aerosol particles (Shulman et al., 1996; Abdul-Razzak and Ghan, 2005), or due to the net transfer of semi-volatile, water-soluble compounds from the gas phase to humid aerosol particles (Kulmala et al., 1993; Topping and
McFig-20
gans, 2012). The net effect of these processes is to reduce the value ofdcfrom values obtained directly from Eq. (2).
2.1.2 Experimental findings
Several experimental studies have reported “effective” threshold diameters, dc,eff, for
atmospheric particle populations measured under various tropospheric conditions
25
(Dusek et al., 2006; Hudson et al., 2007; Furutani et al., 2008; Kuwata et al., 2008; Quinn et al., 2008; Gunthe et al., 2009, 2011; Kammermann et al., 2010; Mochida et al., 2010; Roberts et al., 2010; Deng et al., 2011; Irwin et al., 2011; Kim et al., 2011;
ACPD
12, 22139–22198, 2012A synthesis based on existing literature
and new results
V.-M. Kerminen et al.
Title Page
Abstract Introduction
Conclusions References
Tables Figures
◭ ◮
◭ ◮
Back Close
Full Screen / Esc
Printer-friendly Version Interactive Discussion
Discussion
P
a
per
|
Dis
cussion
P
a
per
|
Discussion
P
a
per
|
Discussio
n
P
a
per
|
Sihto et al., 2011). The diametersdc,eff are inferred typically from size-resolved
activa-tion efficiencies or from concurrent CCN and particle size distribution measurements (e.g. Furutani et al., 2008; Rose et al., 2010). In the first type of experiments, CCN and total number concentrations are measured concurrently for a certain set of dry di-ameters. This yields the fraction of CCN active particles as a function of the size, and
5
dc,effcan be determined from the data by estimating the diameter corresponding to the 50 % activation efficiency. It is worth noting thatdc,eff obtained in this way is not a min-imum diameter needed for activation because the activated fraction tends to increase gradually with increasing dry diameter so that a sigmoid function, rather than the step function, gives usually a good fit to the data (Rose et al., 2010). In the second type of
10
experiments,dc,effis defined through a following type of relation:
dmax
R
dc,eff
n(dp)d dp
CNtot =AFtot (3)
Heredmaxis the largest diameter measured with the particle sizing instrument,n(dp) is the size distribution function,CNtot is the total particle concentration (obtained by inte-gratingn(dp) over the particle size range), andAFtot is the fraction of the particles that
15
act as CCN (determined from the CCN measurements). One underlying assumption behind the approach is that particles are internally mixed even though this is rarely the case in the atmosphere (Furutani et al., 2008).
It should be emphasized that dc and dc,eff are not directly comparable with each other. This is because dc is a theoretically-predicted size needed for a particle with
20
a given chemical composition to activate, whereas dc,eff is an estimate of the thresh-old activation diameter for an ambient particle population. In particular, the chemical composition of atmospheric particles tend to vary even among particles having similar sizes, which alone makes direct comparison ofdcanddc,eff problematic. Nevertheless,
dc,eff gives an useful measure for the diameter required for CCN activation in the
at-25
ACPD
12, 22139–22198, 2012A synthesis based on existing literature
and new results
V.-M. Kerminen et al.
Title Page
Abstract Introduction
Conclusions References
Tables Figures
◭ ◮
◭ ◮
Back Close
Full Screen / Esc
Printer-friendly Version Interactive Discussion
Discussion
P
a
per
|
Dis
cussion
P
a
per
|
Discussion
P
a
per
|
Discussio
n
P
a
per
|
illustration. The data points are seen to scatter around the predicted global mean value ofκ=0.27 and fall generally within a standard deviation of the globalκdistribution. It is also seen thatdc,effmay vary quite notably between different measurements conducted at similar supersaturation levels. A plausible explanation is that these differences reflect the variability in the particle chemical composition.
5
The threshold diameter for a particle population depends not only on the aerosol composition and mixing state, but also on the maximum supersaturation reached in clouds. This quantity, in turn, is a function of the aerosol loading and meteorological conditions (McFiggans et al., 2006; Reutter et al., 2009; Ghan et al., 2011). Exclud-ing pristine air masses and clouds formed as a result of a strong convective
activ-10
ity, maximum cloud supersaturations are expected to lie mostly below 0.3 % (Seinfeld and Pandis, 2006: Hegg et al., 2009 and references therein; Hudson et al., 2010). By combining this information with the observed values ofκ between about 0.1 and 0.45 for sub-100 nm particles originating from nucleation (e.g. Dusek et al., 2010; Cerully et al., 2011; Sihto et al., 2011; Levin et al., 2012), we end up with threshold diameters
15
larger than about 70–80 nm in boundary-layer clouds (Fig. 1). Other chemical effects discussed in Sect. 2.1.1 likely decrease the minimum threshold diameter for CCN ac-tivation further. The minimum “dry” sizes of particles observed to participate in droplet formation in real atmospheric clouds are usually in the range 50–150 nm (Henning et al., 2002, and references therein; Komppula et al., 2005; Anttila et al., 2009).
20
2.2 Nuclei growth to CCN sizes
Theκ-Koehler calculations and other findings presented in the previous section imply that nucleated particles need to grow to sizes between about 50 and 100 nm to act as CCN in boundary-layer clouds. The initial size of freshly-nucleated particles, on the other hand, is about 1–2 nm (e.g. Kulmala et al., 2007). This means that nucleated
25
particles need to undergo significant growth before they can contribute to atmospheric CCN populations.
ACPD
12, 22139–22198, 2012A synthesis based on existing literature
and new results
V.-M. Kerminen et al.
Title Page
Abstract Introduction
Conclusions References
Tables Figures
◭ ◮
◭ ◮
Back Close
Full Screen / Esc
Printer-friendly Version Interactive Discussion
Discussion
P
a
per
|
Dis
cussion
P
a
per
|
Discussion
P
a
per
|
Discussio
n
P
a
per
|
Based on particle number size distribution measurements, nuclei growth rates have been determined in a large number of lower-troposphere environments (Kulmala et al., 2004a; Kulmala and Kerminen, 2008, and references therein). The vast majority of the reported growth rates lie in the range 1–10 nm h−1. Lower values have occasion-ally been observed in remote continental sites and, more recently, also in the marine
5
boundary layer (O’Dowd et al., 2010). Growth rates in excess of 10 nm h−1have been
reported in a few polluted environments, as well as in plumes from intense and local-ized sources of aerosol precursor vapors. We may conclude that the growth of nucle-ated particle to CCN sizes takes from a few hours up to about three days in the lower troposphere, with longer growth times more typical for remote locations.
10
The likelihood that nucleated particles will grow to CCN sizes, called also the CCN formation efficiency, depends on the competition between the rates of growth and removal processes (Kerminen et al., 2004; Pierce and Adams, 2007). At the initial stages of their growth, the removal of nuclei is dictated by their coagulation with larger pre-exiting particles and, in case the nuclei number concentration is extremely
15
high, also by their self-coagulation (Lepp ¨a et al., 2011). McMurry et al. (2005) and Kuang et al. (2010) investigated theoretically the competition between the nuclei growth and their scavenging by coagulation. They showed that nucleation is unable to ini-tiate detectable aerosol formation unless the very initial nuclei growth rate exceeds a certain value dictated by the pre-existing aerosol loading. Kerminen and Kulmala
20
(2002) derived a simple analytical formula by which the scavenging of growing nuclei by coagulation can be taken into account in large-scale models or in analyzing field measurements. An updated version of this formula was introduced later by Lehtinen et al. (2007). Anttila et al. (2010) extended it further to take into account nuclei self-coagulation. When nuclei grow further, their scavenging by coagulation slows rapidly
25
ACPD
12, 22139–22198, 2012A synthesis based on existing literature
and new results
V.-M. Kerminen et al.
Title Page
Abstract Introduction
Conclusions References
Tables Figures
◭ ◮
◭ ◮
Back Close
Full Screen / Esc
Printer-friendly Version Interactive Discussion
Discussion
P
a
per
|
Dis
cussion
P
a
per
|
Discussion
P
a
per
|
Discussio
n
P
a
per
|
particles can be estimated. They predicted a large variability for nuclei CCN formation efficiencies between different atmospheric environments. Kuang et al. (2009) applied a slightly modified version of this approach for a field measurement campaign, and found the CCN formation efficiencies to be in a relatively narrow range of 1–20 %.
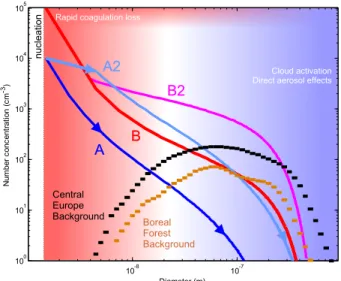
In view of the above, the CCN formation efficiency of nucleation depends on (1)
5
the initial (sub-3 to 10 nm) nuclei growth rate, which dictates whether nucleation can initiate detectable aerosol formation and how big fraction of freshly-nucleated particles survive from coagulation with larger particles, and (2) the average nuclei growth rate, which determines whether growing nuclei reach CCN sizes before being scavenged by dry or wet deposition. The interaction between the nuclei growth and loss rates is
10
schematically shown in Fig. 2. The overall CCN formation efficiency is at least as much controlled by the particle growth/loss dynamics as it is by the initial nucleation rate.
Large uncertainties regarding the growth rate of the smallest nuclei still exist, since this quantity depends in a complicated way on the dynamics and thermodynamics of the condensation process, and possibly also on other growth processes (Anttila et al.,
15
2004; Kulmala et al., 2004b; Nieminen et al., 2010). While in theory these processes could either enhance or suppress the growth of very small nuclei, the few existing field measurements suggest that the sub-3 nm nuclei usually grow somewhat slower than larger nuclei (Hirsikko et al., 2005; Manninen et al., 2010; Kuang et al., 2012).
From a modeling point of view it is critical to know which vapors drive the growth
20
of freshly-formed clusters to CCN-sizes, and how this growth depends on the envi-ronment, atmospheric conditions and particle size. While the exact identities of the condensing vapors and vapor-uptake mechanisms are not fully known, there is a grow-ing number of observational studies directgrow-ing the development of modelgrow-ing approach for ultrafine particle growth. Sulfuric acid, together with water and basic compounds
25
such as ammonia and amines, appear to drive the initial steps of atmospheric particle formation in many environments (Sipil ¨a et al., 2010; Berndt et al., 2010; Kirkby et al., 2011; Zhang et al., 2012). Excluding some sulfur-rich conditions (Jung et al., 2006; Zhang et al., 2009), atmospheric sulfuric acid concentrations are, however, too low to
ACPD
12, 22139–22198, 2012A synthesis based on existing literature
and new results
V.-M. Kerminen et al.
Title Page
Abstract Introduction
Conclusions References
Tables Figures
◭ ◮
◭ ◮
Back Close
Full Screen / Esc
Printer-friendly Version Interactive Discussion
Discussion
P
a
per
|
Dis
cussion
P
a
per
|
Discussion
P
a
per
|
Discussio
n
P
a
per
|
fully explain the growth of the new particles to CCN sizes (Kuang et al., 2010; Riip-inen et al., 2011; Pierce et al., 2011; Riccobono et al., 2012). Kulmala et al. (1998) and Kerminen et al. (2000) suggested that low-volatile organic compounds would be responsible for the majority of the particle growth. The important role of organic com-pounds in growing nucleated particle to CCN sizes has later been confirmed in many
5
environments (e.g. Tunved et al., 2006; Spracklen et al., 2008b; Laaksonen et al., 2008; Smith et al., 2010).
The number of atmospherically relevant organic compounds is very large, and the properties of these molecules are not well known (e.g. Goldstein and Galbally, 2007; Hallquist et al., 2009). This complicates the representation of organic condensation
10
onto freshly-formed particles, and it is likely that no single organic vapor or precursor dominates the growth of nucleated particles to CCN sizes. Model predictions of nu-cleation mode particle growth are very sensitive to the volatility of organic vapors, as well as to the approach with which organic vapors are converted into aerosol loadings and size distributions (Riipinen et al., 2011). The treatment of condensable organics
15
in the current state-of-the-art atmospheric models is essentially two-fold: some mod-els assume that the condensable organics are completely non-volatile (e.g. Spracklen et al., 2008b; Makkonen et al., 2009), while others account for the volatility but assume that the aerosol is in constant thermodynamic equilibrium with the gas phase (e.g. Pye and Seinfeld, 2010). Neither of these approaches adequately describes atmospheric
20
aerosol populations, since the former neglects evaporation of organic aerosol and the latter cannot capture the growth of freshly-formed particles. To improve the estimates of the climate impacts of organics, atmospheric models need approaches that capture nanoparticle growth without compromising the predictions of total aerosol mass bud-gets and properties. First attempts toward this approach have been presented, typically
25
ACPD
12, 22139–22198, 2012A synthesis based on existing literature
and new results
V.-M. Kerminen et al.
Title Page
Abstract Introduction
Conclusions References
Tables Figures
◭ ◮
◭ ◮
Back Close
Full Screen / Esc
Printer-friendly Version Interactive Discussion
Discussion
P
a
per
|
Dis
cussion
P
a
per
|
Discussion
P
a
per
|
Discussio
n
P
a
per
|
3 Observations of atmospheric CCN production
3.1 Overview of existing observations
While the direct measurement of atmospheric nucleation remains a big challenge (Kul-mala et al., 2007, 2012), observation of the subsequent growth of nucleated particles to larger sizes is possible for so-called regional nucleation events (e.g. Kulmala and
5
Kerminen, 2008). In such events, nucleation and growth occur simultaneously and rel-atively homogeneously over large spatial scales, making it possible to monitor the time evolution of a growing particle population at a fixed measurement site. During the last decade or so, regional nucleation events producing particles of several tens of nm in diameter have been found to be frequent in a large variety of lower-troposphere
en-10
vironments, including forested areas, many other remote continental regions, urban areas, and heavily-polluted environments (see Kulmala and Kerminen, 2008, and ref-erences therein). Similar events have also been observed in several high-altitude sites in the mountains (Shaw, 2007; Venzac et al., 2008, 2009; Kivek ¨as et al., 2009; Boulon et al., 2010), whereas in the marine boundary layer they appear to be rare
(Heintzen-15
berg et al., 2004; O’Dowd et al., 2010).
Regional nucleation events are clear indicators of atmospheric CCN production ini-tiated by nucleation, yet only few experimental studies have attempted to quantify the strength of this source. Lihavainen et al. (2003) and later Asmi et al. (2011a) analysed a large number of nucleation events measured at a remote site in Northern Finland,
20
and found that number concentrations of 50, 80 and 100 nm particles were enhanced, on average, by the factors of 2.6, 1.7 and 1.5, respectively, from the beginning of a nu-cleation event to the end of the event. Slightly smaller CCN enhancement factors were reported by Sihto et al. (2011) for the SMEAR II station in Southern Finland. By re-lying on continuous data from three measurement stations, Tunved et al. (2006)
esti-25
mated that nucleation is the dominant source of the aerosol number concentration and a significant contributor to CCN concentrations over the whole Scandinavian boreal forest region during the summer part of the year. Laaksonen et al. (2005) found that
ACPD
12, 22139–22198, 2012A synthesis based on existing literature
and new results
V.-M. Kerminen et al.
Title Page
Abstract Introduction
Conclusions References
Tables Figures
◭ ◮
◭ ◮
Back Close
Full Screen / Esc
Printer-friendly Version Interactive Discussion
Discussion
P
a
per
|
Dis
cussion
P
a
per
|
Discussion
P
a
per
|
Discussio
n
P
a
per
|
nucleation significantly enhances the concentrations of CCN-size particles at a highly-polluted region of Po Valley, Italy, despite strong primary particle emissions there. Yue et al. (2011) reported average CCN enhancement factors between about 1.5 and 2.5 in Beijing, China, with larger values corresponding to nucleation events with higher particle growth rates. Kuang et al. (2009) derived an overall-average CCN
enhance-5
ment factor of 3.8 for nucleation events recorded at three different continental sites, of which two (Boulder, CO and Atlanta, GA) were located in the USA and one in Mexico (Tecamac).
Only few investigators have linked nucleation measurements directly to correspond-ing CCN or cloud droplet number concentration measurements. Kuwata et al. (2008)
10
measured aerosol number size distributions and CCN concentrations at four super-saturations at Jeju Island, Korea. They reported a few events where nucleation was followed by clear increases in CCN number concentrations after a few hours from the beginning of the event. Similar observations were made by Creamean et al. (2011) at a remote rural mountain site in California, USA, by Levin et al. (2012) at a forested site
15
in Colorado, USA, and by Pierce et al. (2012) in a forested mountain valley in West-ern Canada. Wiedensohler et al. (2009) and Yue et al. (2011) found rapid growth of nucleated particles to CCN in a highly-polluted region in Beijing, China, and high CCN concentrations resulting from nucleation. Sihto et al. (2011) analyzed a full year of si-multaneous aerosol number size distribution and CCN concentration measurements
20
at a forested site (SMEAR II station in Hyyti ¨al ¨a) in Southern Finland. They found that nucleation enhanced CCN number concentration by 70 to 110 %, depending on the su-persaturation level. Usually, CCN concentrations at highest susu-persaturations increased after a few hours from the beginning of the nucleation event, whereas CCN concentra-tions measured at low supersaturaconcentra-tions tended to reach their maximum during the
25
ACPD
12, 22139–22198, 2012A synthesis based on existing literature
and new results
V.-M. Kerminen et al.
Title Page
Abstract Introduction
Conclusions References
Tables Figures
◭ ◮
◭ ◮
Back Close
Full Screen / Esc
Printer-friendly Version Interactive Discussion
Discussion
P
a
per
|
Dis
cussion
P
a
per
|
Discussion
P
a
per
|
Discussio
n
P
a
per
|
In addition to regional nucleation events, production of new CCN has been reported in association with more localized sources. These include power plant plumes (e.g. Brock et al., 2002), and some coastal areas where very intense nucleation bursts fol-lowed by rapid growth of nucleated particles to larger sizes have been observed to take place (O’Dowd and de Leeuw, 2007; Whitehead et al., 2010). Convection and related
5
cloud outflow regions in the free troposphere have been identified as active regions for nucleation (Twohy et al., 2002; Hermann et al., 2003; Benson et al., 2008), as was also the upper troposphere (e.g. Clarke, 1993; Singh et al., 2002; Hermann et al., 2003). Due to the lack of continuous measurements, however, practically no experimental ev-idence on associated CCN production in these regions has been obtained so far.
10
In view of the above, CCN production due to atmospheric nucleation appears to be a common phenomenon. Unfortunately, existing observations are too limited for draw-ing any quantitative estimates on how significant this process might be for the tropo-spheric CCN budget. In order to improve this situation, and to provide data for models simulating atmospheric CCN formation, more analyses on long-term measurements in
15
different environments are needed. The analyses should involve particle number size distribution measurements at minimum, preferably including parallel CCN measure-ments. In the following sub-section we will present new experimental data related to this issue.
3.2 Examples of recent long-term observations
20
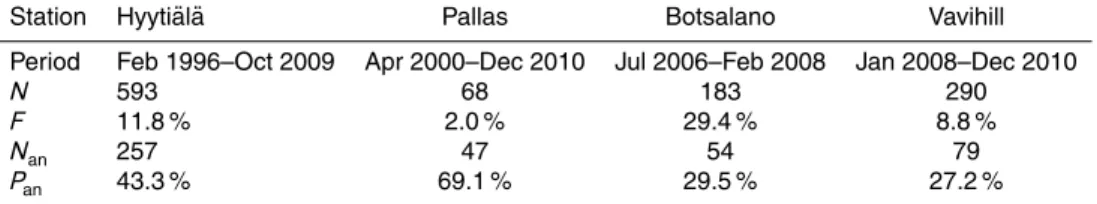
In order to provide insight into how atmospheric nucleation affects CCN concentrations over a full annual cycle, and to illustrate the challenges in quantifying the contribution of nucleation events to the CCN budget, we analyzed four long-term measurement datasets obtained from sites in Hyyti ¨al ¨a, Pallas, Vavihill and Botsalano. The station in Hyyti ¨al ¨a (61◦50′N, 24◦17′E, 181 m a.s.l) is located inside a boreal forests zone
25
in Finland and represents typical regional background conditions for higher latitudes of Europe (Hari and Kulmala, 2005). The Pallas station (67◦58′N, 24◦07′E, 560 m a.s.l)
ACPD
12, 22139–22198, 2012A synthesis based on existing literature
and new results
V.-M. Kerminen et al.
Title Page
Abstract Introduction
Conclusions References
Tables Figures
◭ ◮
◭ ◮
Back Close
Full Screen / Esc
Printer-friendly Version Interactive Discussion
Discussion
P
a
per
|
Dis
cussion
P
a
per
|
Discussion
P
a
per
|
Discussio
n
P
a
per
|
(Hatakka et al., 2003). The Vavihill station (56◦01′N, 13◦09′E, 172 m a.s.l) is located in the southernmost part of Sweden and represents continental background condi-tions (Kristensson et al., 2008). The site in Botsalano, South-Africa (25◦32′S, 25◦45′E,
1424 m a.s.l), is located in dry savannah environment and can be considered as a con-tinental background site (Laakso et al., 2008).
5
At all sites, CCN number concentrations were derived from particle number size dis-tributions measured with a Differential Mobility Particle Sizer (DMPS). In addition to the DMPS data, CCN number concentrations at fixed supersaturations were measured in Hyyti ¨al ¨a and Vavihill using a Cloud Condensation Nuclei Counter (CCNC) over limited time periods. For detailed descriptions of the measurements systems at each location,
10
we refer to Hari and Kulmala (2005), Kristensson et al. (2008), Laakso et al. (2008), Lihavainen et al. (2008), Fors et al. (2011) and Sihto et al. (2011).
In the analyses summarized in Table 1, we considered only such nucleation events for which the particle formation and growth rates could be determined with a good confidence level (Type I events; see Dal Maso et al., 2005). Strict selection criteria were
15
then further applied to determine the most representative and usable events. Days with clear pollution peaks and episodes, as well as days with persistent polluted air (high accumulation mode concentrations) were disregarded due to their possible effects on CCN concentrations. In several instances, a late dilution of the boundary layer and/or change of air mass resulted in higher CCN concentrations prior to the nucleation event
20
– these events were also not used in the analysis. Moreover, we considered only those nucleation events where particles grew to at least 50 nm in diameter. The selection was carried out manually by visually examining each event.
As mentioned previously, supersaturation within the cloud has a direct effect on the critical diameterdc, and, therefore, defining the size range of particles that constitute
25
ACPD
12, 22139–22198, 2012A synthesis based on existing literature
and new results
V.-M. Kerminen et al.
Title Page
Abstract Introduction
Conclusions References
Tables Figures
◭ ◮
◭ ◮
Back Close
Full Screen / Esc
Printer-friendly Version Interactive Discussion
Discussion
P
a
per
|
Dis
cussion
P
a
per
|
Discussion
P
a
per
|
Discussio
n
P
a
per
|
given nucleation event to the CCN concentration was studied on the basis of compar-ison of the CCN concentration NCCNprior prior to and the maximum CCN concentration NCCNmaxduring an event. The NCCNmaxwas chosen as the most straightforward param-eter, which, while may not be the best representation of CCN concentration after the event, gives a rough estimate of the observed maximum number of particles, both new
5
and pre-existing, that are present in the atmosphere during an event. Another reason for selecting NCCNmax is the difficulty in defining the end of a nucleation event. NCCNprior was calculated as a one-hour average concentration immediately prior to the appear-ance of the newly formed nucleation mode particles, whereas NCCNmax was calculated as a maximum one-hour average concentration during an event. The contribution of
10
the nucleation to CCN concentrations during the days fulfilling the above criteria was then examined in both relative and absolute terms.
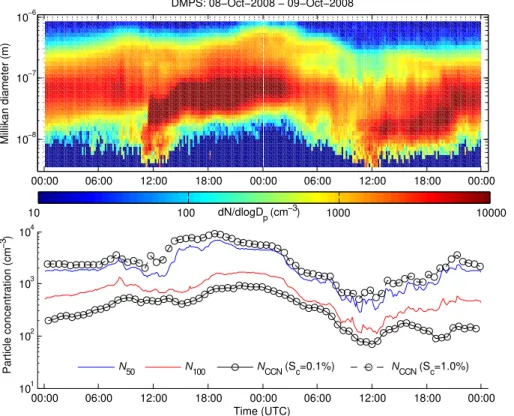
3.2.1 Connection between CCN derived from DMPS and CCNC measurements
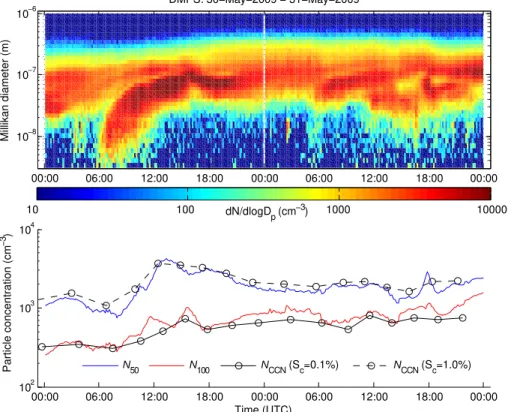
Figures 3 and 4 illustrate an example of a nucleation event in Hyyti ¨al ¨a and Vahivill, respectively, connecting DMPS and Cloud Condensation Nuclei Counter (CCNC)
mea-15
surements. The event in Fig. 3 is a typical spring type I event in Hyyti ¨al ¨a, with the new particle formation starting at 05:30 UTC and the growth continuing until 16:00 UTC. It is visible that N50 and N100 reached their maximum values 8 and 10.5 h after the beginning of the event, respectively, and represent an increase of 317 % and 202 % in corresponding CCN concentrations compared with before the start of the events.
20
Similarly, the event in Fig. 4 is an autumn type I event in Vavihill, with the new particle formation starting at 10:40 UTC and the growth continuing until the early morning hours of the next day. The values of N50 and N100 reached their maximum 8 and 11 h after the beginning of the event, respectively, and represent an increase of 238 % and 86 % in corresponding CCN concentrations compared with before the start of events.
25
Figures 3 and 4 demonstrate that CCN concentrations calculated from the DMPS measurements correspond very well with those measured by the CCNC at two different supersaturation (Sc) levels. Indeed, the peaks in N50 and N100 occur at approximately
ACPD
12, 22139–22198, 2012A synthesis based on existing literature
and new results
V.-M. Kerminen et al.
Title Page
Abstract Introduction
Conclusions References
Tables Figures
◭ ◮
◭ ◮
Back Close
Full Screen / Esc
Printer-friendly Version Interactive Discussion
Discussion
P
a
per
|
Dis
cussion
P
a
per
|
Discussion
P
a
per
|
Discussio
n
P
a
per
|
at the same time as peaks in NCCN for Sc of 1.0 % and 0.1 %, respectively. In both example cases, N50 represents the CCN concentration accurately forScslightly below 1.0 %, and N100 represents the CCN concentration accurately for Sc slightly above 0.1 %. Both these events occurred in air mass with relatively high and persistent particle number concentrations in the accumulation mode. As a result, CCN measured prior,
5
during and after the event included both nucleated and primary aerosol particles.
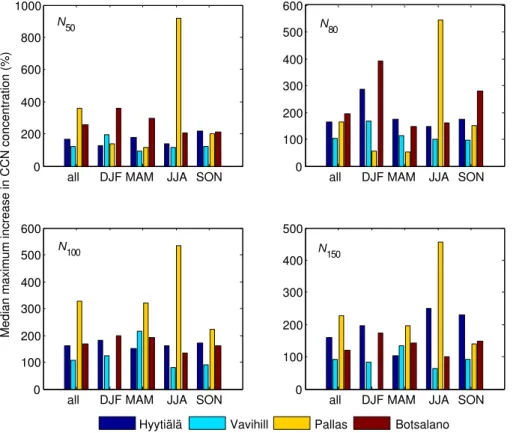
3.2.2 Increases of CCN concentrations during nucleation events
Figure 5 shows relative increases in CCN number concentrations during the selected subset of nucleation event days at the four stations. As expected, nucleation events had a noticeable effect on CCN concentrations in all seasons and locations considered
10
here. The highest relative increase in CCN concentrations was observed in Pallas, with an average increase in the value of N50 of about 360 %. This feature is a direct result of very low absolute particle number concentrations at this remote background boreal station compared with the three other sites (Dal Maso et al., 2007; Kristensson et al., 2008; Laakso et al., 2008; Asmi et al., 2011a). On an annual basis, the relative
in-15
creases in CCN concentrations were highest during the summertime in both Pallas and Botsalano. In Pallas, this is probably due to the highest particle growth rates at this time of the year (Asmi et al., 2011a). In Botsalano, the local summer (December, January and February) is a wet season with frequent nucleation events, precipitation episodes, high relative humidity and low concentrations of atmospheric pollutants (Laakso et al.,
20
2008). A more recent study by Laakso et al. (2012) reported that the observed high-est increase during local summer may be attributed to higher growth rates stemming from higher biogenic emissions, as well as to generally cleaner air masses resulting from a weakened anticyclonic circulation, frequent rainfall and a smaller condensa-tion sink. Over the course of the whole year, the smallest relative increase for all four
25
ACPD
12, 22139–22198, 2012A synthesis based on existing literature
and new results
V.-M. Kerminen et al.
Title Page
Abstract Introduction
Conclusions References
Tables Figures
◭ ◮
◭ ◮
Back Close
Full Screen / Esc
Printer-friendly Version Interactive Discussion
Discussion
P
a
per
|
Dis
cussion
P
a
per
|
Discussion
P
a
per
|
Discussio
n
P
a
per
|
to Central Europe, regional conurbations and intense ship traffic lines in the waters surrounding Southern Sweden. No seasonal pattern in the relative increase in CCN concentrations as a result of nucleation events were observed in Hyyti ¨al ¨a and Vavihill, although in the latter the smallest relative increase was observed during the summer months.
5
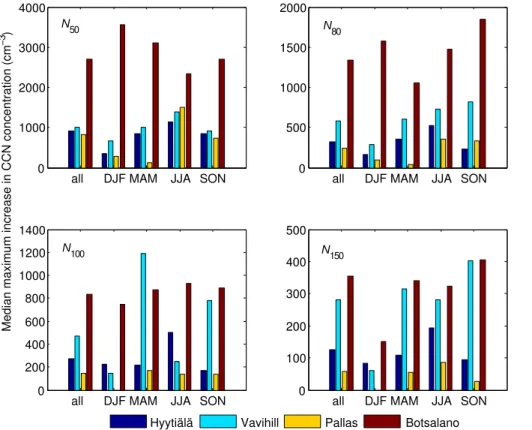
Figure 6 shows the absolute increases in CCN number concentrations at the four stations. With the exception of N100in Vavihill in the spring, for all CCN diameters and during all seasons, the absolute number of newly introduced CCN-size particles was highest in Botsalano. During the local summer N50can increase by as much as∼3500 particles cm−3 as a result of a nucleation event. Considering the fact that background
10
aerosol concentrations in Botsalano are, on average, higher than in Hyyti ¨al ¨a, Vavihill and Pallas (Dal Maso et al., 2007; Laakso et al., 2008), the observed increases in CCN concentrations must be due to fairly intense nucleation events with high particle growth rates. Indeed, average growth rates of nucleated particles in Botsalano (Laakso et al., 2008; Vakkari et al., 2011) are considerably higher than those at the three other sites
15
(Dal Maso et al., 2007; Kristensson et al., 2008; Asmi et al., 2011a). As a result, the average time it takes for particles to grow to 150 nm in diameter during a nucleation event is on the order of 10 h in Botsalano, as compared with 20 h or more in Hyyti ¨al ¨a, Vavihill and Pallas. The overall effect of nucleation events on the atmospheric CCN con-centrations in Botsalano was large, but only when considering the absolute increase
20
in CCN concentrations: high background number concentrations resulted in a smaller relative increase when compared to the other stations (Fig. 5). Vavihill showed fairly large absolute increases in CCN concentrations, especially for N100and N150, indicat-ing also the occurrences of intense nucleation events. For both Hyyti ¨al ¨a and Pallas the largest absolute increase in CCN concentrations was observed during the summer
25
months, which is attributed to higher biogenic emissions and, hence, higher formation and growth rates. The same seems not to be case for Vavihill, where no annual trend in absolute increase was observed, with the exception of a minimum in the winter.
ACPD
12, 22139–22198, 2012A synthesis based on existing literature
and new results
V.-M. Kerminen et al.
Title Page
Abstract Introduction
Conclusions References
Tables Figures
◭ ◮
◭ ◮
Back Close
Full Screen / Esc
Printer-friendly Version Interactive Discussion
Discussion
P
a
per
|
Dis
cussion
P
a
per
|
Discussion
P
a
per
|
Discussio
n
P
a
per
|
3.2.3 Discussion
The approach applied here can be compared with two other ones applied recently. Asmi et al. (2011a) analyzed nucleation events in Pallas and investigated their con-tribution to the CCN budget (N80) by defining the end of an event and the time when nucleation mode particles reached the size defining the lower limit of CCN.
Compar-5
ing our results for Pallas with those by Asmi et al. (2011a) revealed clear differences in both absolute and relative increases in CCN concentrations caused by nucleation, and in the seasonal patterns of these increases. The apparent reason for these dif-ferences is the different method used to determine the contribution of nucleation to CCN, as the considered time period was the same in this study and the one by Asmi
10
et al. (2011a). The method described by Laakso et al. (2012) for nucleation events in Botsalano was similar to the one used here, except that Laakso et al. (2012) defined the end of each event and used the CCN concentration measured at that time instead of the maximum CCN concentration when calculating changes in CCN concentrations caused by nucleation. Our results for the Botsalano station agree quite well with those
15
by Laakso et al. (2012), with the difference being the weaker seasonal variability of CCN increases in our analysis.
The examples presented above raise several important issues that need to be kept in mind in future analyses. To start with, when discussing the importance of atmo-spheric nucleation to CCN formation in different locations, it is important to distinguish
20
between (i) the absolute increase in CCN concentrations associated with individual nu-cleation events, (ii) the corresponding relative increase, and (iii) the overall contribution of nucleation to the CCN budget. The absolute CCN increase depends mainly on par-ticle formation and growth rates, whereas the relative CCN increase is affected also by primary aerosol particle number concentrations. When looking at the CCN budget,
25
ACPD
12, 22139–22198, 2012A synthesis based on existing literature
and new results
V.-M. Kerminen et al.
Title Page
Abstract Introduction
Conclusions References
Tables Figures
◭ ◮
◭ ◮
Back Close
Full Screen / Esc
Printer-friendly Version Interactive Discussion
Discussion
P
a
per
|
Dis
cussion
P
a
per
|
Discussion
P
a
per
|
Discussio
n
P
a
per
|
differences in event frequencies and fraction of events used in our analysis). This form of analysis cannot easily quantify the fraction of the CCN that existed before nucleation started that were due to nucleation events in previous days in other locations. Addi-tional challenges include the quantification of growth of addiAddi-tional particles created by nucleation to the CCN range during the days following nucleation, the lifetimes of these
5
particles etc.
The differences in the methods used by various investigators and, more importantly, the differences in results indicate a clear need for standardized procedures and ro-bust algorithms when studying and quantifying the contribution of nucleation events to the atmospheric CCN concentrations based on measurement data. A big challenge in
10
any approach used is to distinguish between primary particles and particles formed originally by atmospheric nucleation. In order to comprehensively investigate the at-mospheric CCN budget and the contribution of nucleation events to it, the analysis should include not only the nucleation event days, but also non-events days and unde-fined days (Buenrostro Mazon et al., 2009). Supplementing the analysis with the model
15
simulations would probably be beneficial, as demonstrated by Laakso et al. (2012). In summary, measurement data can provide a useful insight into the CCN concentrations during nucleation events, but a more rigorous analysis is required to quantify the con-tribution of nucleation events to atmospheric CCN budget.
4 Model investigations
20
4.1 Overview of existing model studies
The first model simulations on atmospheric CCN formation concentrated on the marine boundary layer (MBL), in which CCN were thought to mainly originate from the sulfur chemistry associated with marine dimethyl sulphide (DMS) emissions (Lin et al., 1992; Raes et al., 1992; Pandis et al., 1994; Russell et al., 1994; Kerminen and Wexler, 1995).
25
While varying in detail by which aerosol microphysical processes were treated, all of
ACPD
12, 22139–22198, 2012A synthesis based on existing literature
and new results
V.-M. Kerminen et al.
Title Page
Abstract Introduction
Conclusions References
Tables Figures
◭ ◮
◭ ◮
Back Close
Full Screen / Esc
Printer-friendly Version Interactive Discussion
Discussion
P
a
per
|
Dis
cussion
P
a
per
|
Discussion
P
a
per
|
Discussio
n
P
a
per
|
these models described the MBL with a zero-dimensional box, in which new aerosol particles were formed by classical binary H2SO4−H2O or ternary H2SO4−H2O−NH3 nucleation, and the particle growth was driven by gaseous H2SO4 condensation. The models were able to explain some of the observed features related to the marine aerosol budget, but their real evaluation was hampered by the lack of gaseous
sul-5
furic acid measurements.
Raes (1995) proposed that most CCN present in the MBL are due to the entrainment of particles nucleated in the free troposphere to the MBL and subsequent processing of the entrained particles by non-precipitating MBL clouds. Support for the important role of entrainment was obtained from several model investigations that relied on either
10
zero- or one-dimensional description of the MBL aerosol dynamics (Fizgerald et al., 1998; Capaldo et al., 1999; Katoshevski et al., 1999; Yoon and Brimblecombe, 2002). These and more recent model simulations showed further that the marine CCN pro-duction associated with the DMS chemistry is tied to primary sea-spray emissions in a complicated manner (e.g. Korhonen et al., 2008: M ˚artenson et al., 2010). The effect
15
of low-volatile vapors other than sulfuric acid on marine CCN production, including or-ganic compounds resulting from oceanic isoprene emissions and iodine compounds released by algae, have also been investigated with models of different complexity (O’Dowd and de Leeuw, 2007; Arnold et al., 2009, and references therein). Such va-pors have been demonstrated to be able to affect local CCN concentrations, yet their
20
influence on global CCN production remains uncertain.
After realizing the importance of free-troposphere nucleation for marine CCN pro-duction and, even more so, the high frequency of new particle formation in continen-tal boundary layers (e.g. Kulmala et al., 2004a), a clear need for large-scale model simulations emerged. Pioneering studies in this regard were those by Lucas and
Ari-25
ACPD
12, 22139–22198, 2012A synthesis based on existing literature
and new results
V.-M. Kerminen et al.
Title Page
Abstract Introduction
Conclusions References
Tables Figures
◭ ◮
◭ ◮
Back Close
Full Screen / Esc
Printer-friendly Version Interactive Discussion
Discussion
P
a
per
|
Dis
cussion
P
a
per
|
Discussion
P
a
per
|
Discussio
n
P
a
per
|
on different nucleation mechanisms were conducted. Some of these studies focused solely on CCN number concentrations in the global atmosphere (Spracklen et al., 2008a; Merikanto et al., 2009, Pierce and Adams, 2009; Yu and Luo, 2009; Luo and Yu, 2011a), while others examined also changes in cloud droplet number concentrations and resulting climatic variables (Makkonen et al., 2009; Wang and Penner, 2009; Kazil
5
et al., 2010; Merikanto et al., 2010). Evaluation of these models was mainly based on comparing modeled total particle number concentrations, and in some cases size dis-tributions, with those measured at surface monitoring sites and by ships or aircraft (e.g. Spracklen et al., 2010; Yu, 2011).
Although the models simulating the production of CCN in the global atmosphere
dif-10
fer considerably in terms of how nucleation and other aerosol processes are treated, the results from the conducted model investigations share a number of common fea-tures. First, nucleation taking place in the upper free troposphere appears to be a major source of CCN in the global troposphere. After transport and growth, these particles dominate frequently CCN number concentrations in the remote marine boundary layer
15
and contribute to CCN present in continental background areas. Second, boundary-layer nucleation enhances CCN number concentrations almost everywhere over the continents. The resulting enhancement, while rather small over areas with substantial primary particle emissions, may be several-fold in environments such as the summer-time boreal forest. Third, organic compounds play a crucial role in the CCN production
20
in continental boundary layers and, possibly, elsewhere due to their ability to grow nu-cleated particles effectively into larger sizes. Finally, the contribution of nucleation to the total CCN budget in the troposphere is definitely non-negligible, and it might be even larger than 50 % at water vapor supersaturations approaching 1 %.
Model simulations have pointed out that atmospheric CCN production due to
nucle-25
ation depends in a non-linear way on the nucleation rate, subsequent growth of nucle-ated particles to larger sizes, and the presence of primary aerosol particles. Both nu-cleation and growth are very challenging processes to be simulated in large-scale mod-eling frameworks. In case of nucleation, this is due to our incomplete understanding of
ACPD
12, 22139–22198, 2012A synthesis based on existing literature
and new results
V.-M. Kerminen et al.
Title Page
Abstract Introduction
Conclusions References
Tables Figures
◭ ◮
◭ ◮
Back Close
Full Screen / Esc
Printer-friendly Version Interactive Discussion
Discussion
P
a
per
|
Dis
cussion
P
a
per
|
Discussion
P
a
per
|
Discussio
n
P
a
per
|
the atmospheric nucleation mechanisms (e.g. Kerminen et al., 2010) and due to nucle-ation taking place in sub-grid scale plumes from sources such as major SO2emitters (e.g. Junkermann et al., 2011; Luo and Yu, 2011a; Stevens et al., 2012). In the case of nuclei growth, the main challenge is the proper treatment of the chemistry and gas-particle partitioning of organic compounds (Riipinen et al., 2011; Yu, 2011). Primary
5
particles complicate the issue further by acting as a sink for low-volatile vapors and freshly-nucleated particles, and by providing additional CCN as a result of their aging during atmospheric transportation.
In order to produce more quantitative estimates on the role of nucleation on at-mospheric CCN populations, more detailed model evaluations relying on atat-mospheric
10
measurements are necessary. Current observations are representative of regional nu-cleation events that usually take place over tens to hundreds of kilometers. From the model evaluation point of view, such observations would fit much better to regional or continental-scale models than to global models. Unfortunately, few model simulations of atmospheric CCN production over regional scales have been conducted so far. In
15
the following subsection we will discuss briefly the latest results in this regard and draw some conclusions based on these.
4.2 Regional model simulations
Regional-scale simulations of the contribution of nucleation to CCN number concentra-tions are scarce, but some pioneering studies have been conducted during the recent
20
years. The first paper simulating both nucleation and CCN production over a regional domain was that by Sotiroupoulou et al. (2006), who investigated this phenomenon over two regions in Europe. Jung et al. (2008, 2010) developed a regional 3-D chem-ical transport model PMCAMx-UF, which simulates the aerosol number (from 1 nm to 10 µm) and mass distributions for a variety of chemical components, with a
user-25
ACPD
12, 22139–22198, 2012A synthesis based on existing literature
and new results
V.-M. Kerminen et al.
Title Page
Abstract Introduction
Conclusions References
Tables Figures
◭ ◮
◭ ◮
Back Close
Full Screen / Esc
Printer-friendly Version Interactive Discussion
Discussion
P
a
per
|
Dis
cussion
P
a
per
|
Discussion
P
a
per
|
Discussio
n
P
a
per
|
The model allows the user to select among several different nucleation parametrisa-tions (see, e.g. Kerminen et al., 2010, and references therein). In a later study, Jung et al. (2010) simulated the evolution of aerosol size distributions in the Eastern United States, testing the sensitivity of aerosol number concentrations to regional nucleation events. Regional nucleation events were predicted to increase the total particle
num-5
ber concentrations by a factor of 2.5 in the modeling domain, and regional variations in the sensitivity to nucleation were found to be considerable. The corresponding in-creases for particles larger than 10 nm (N10) and 100 nm (N100) were 75 % and 15 %, respectively. Interestingly, the increases of N100took place often in areas different than those of the nucleation events. These results suggest that nucleation in the boundary
10
layer and in the lower free troposphere increases CCN concentrations over the Eastern United States by some tens of percent, as 100 nm can be thought of as a very conser-vative upper limit for the smallest CCN size. Luo and Yu (2011b) applied a modeling framework that was very different from that by Jung et al. (2010), but they came to a qualitatively similar conclusion with regard of the importance of nucleation in CCN
15
production over the Eastern United States. Matsui et al. (2011) simulated CCN produc-tion around Beijing, China, and found significant enhancements due to nucleaproduc-tion at supersaturations larger than about 0.2 %.
A version of PMCAMx-UF simulating the European domain was developed within the European integrated project EUCAARI (Kulmala et al., 2011b; Fountoukis et al.,
20
2012). Fountoukis et al. (2012) used three different nucleation parameterizations and newly developed primary particle number emission inventories to test the sensitivity of particle concentrations in the European boundary layer to nucleation and emissions of SO2 (as nucleation precursor) and primary particle emissions. They found a con-siderable contribution (roughly a factor of 3) of regional nucleation to>3 nm number
25
concentrations. For larger particles, considerable regional differences were found de-pending on the availability of condensable vapors. Nucleation in the boundary layer and in the lower free troposphere was found to have a significant effect (increase of up to a factor of two) on the concentrations of particles larger than 50 nm in diameter in
ACPD
12, 22139–22198, 2012A synthesis based on existing literature
and new results
V.-M. Kerminen et al.
Title Page
Abstract Introduction
Conclusions References
Tables Figures
◭ ◮
◭ ◮
Back Close
Full Screen / Esc
Printer-friendly Version Interactive Discussion
Discussion
P
a
per
|
Dis
cussion
P
a
per
|
Discussion
P
a
per
|
Discussio
n
P
a
per
|
areas where vapors were available to grow the nucleated particles. For particles larger than 100 nm the effect of nucleation varied spatially from a 20 % increase in the east-ern Mediterranean to 20 % decrease in Southeast-ern Spain and Portugal, resulting in only a modest average contribution of about 1 % over the whole European domain. How-ever, the model could not capture well the contribution of organics to the early growth
5
of fresh nuclei. These results highlight the need for accurately representing the growth of the nucleation mode particles in order to capture the secondary contribution to CCN number concentrations.
4.3 Climatic implications
The observations and modeling work presented in previous sections have clearly
10
demonstrated that nucleation contributes to the concentration of CCN sized particles in the atmosphere. Despite this, its effects on atmospheric radiation fluxes and thus on climate remain poorly constrained. Global estimates based on observations are ex-tremely challenging, since satellites and other remote sensing instruments detect only particles larger than ∼100 nm, and cannot differentiate the fractional contribution of 15
nucleation in this size range (e.g. Kulmala et al., 2011a). On the other hand, only a few global model studies have thus far investigated the topic (Wang and Penner, 2009; Kazil et al., 2010; Fatima et al., 2011; Makkonen et al., 2012a, 2012b).
Kazil et al. (2010) estimated that the total contribution of nucleation (including direct, semidirect and indirect effects) to the present-day net short-wave radiation at the top
20
of the atmosphere (TOASW) is about 1 % (–2.55 W m−2). This is a significant contribu-tion, and it is likely to have changed since the preindustrial times because emissions of gas-phase compounds responsible for nucleation and subsequent growth, as well as of primary particles acting as a sink for nucleated particles, have changed due to e.g. industrialization and land use changes. It is, therefore, probable that the
nu-25