ACPD
13, 17087–17121, 2013Response of Arctic CCN to sea-ice
retreat
J. Browse et al.
Title Page
Abstract Introduction
Conclusions References
Tables Figures
◭ ◮
◭ ◮
Back Close
Full Screen / Esc
Printer-friendly Version Interactive Discussion
Discussion
P
a
per
|
D
iscussion
P
a
per
|
Discussion
P
a
per
|
Discuss
ion
P
a
per
|
Atmos. Chem. Phys. Discuss., 13, 17087–17121, 2013 www.atmos-chem-phys-discuss.net/13/17087/2013/ doi:10.5194/acpd-13-17087-2013
© Author(s) 2013. CC Attribution 3.0 License.
Atmospheric Chemistry and Physics
Open Access
Discussions
Geoscientiic Geoscientiic
Geoscientiic Geoscientiic
This discussion paper is/has been under review for the journal Atmospheric Chemistry and Physics (ACP). Please refer to the corresponding final paper in ACP if available.
The complex response of Arctic cloud
condensation nuclei to sea-ice retreat
J. Browse1, K. S. Carslaw1, G. W. Mann1, C. E. Birch1, S. R. Arnold1, and C. Leck2
1
School of Earth and Environment, University of Leeds, Leeds, UK
2
Department of Meteorology, Stockholm University, 10691, Stockholm, Sweden Received: 31 May 2013 – Accepted: 13 June 2013 – Published: 27 June 2013 Correspondence to: J. Browse ([email protected])
ACPD
13, 17087–17121, 2013Response of Arctic CCN to sea-ice
retreat
J. Browse et al.
Title Page
Abstract Introduction
Conclusions References
Tables Figures
◭ ◮
◭ ◮
Back Close
Full Screen / Esc
Printer-friendly Version Interactive Discussion
Discussion
P
a
per
|
D
iscussion
P
a
per
|
Discussion
P
a
per
|
Discuss
ion
P
a
per
Abstract
Loss of summertime Arctic sea ice will lead to a large increase in the emission of aerosols and precursor gases from the ocean surface. It has been suggested that these enhanced emissions will exert substantial aerosol radiative forcings, dominated by the indirect effect of aerosol on clouds. Here, we investigate the potential for these indirect
5
forcings using a global aerosol microphysics model evaluated against aerosol observa-tions from the ASCOS campaign to examine the response of Arctic cloud condensation nuclei (CCN) to sea-ice retreat. In response to a complete loss of summer ice, we find that north of 70◦N emission fluxes of sea-salt, marine primary organic aerosol (OA) and dimethyl sulphide increase by a factor of∼10, ∼4 and ∼15, respectively. How-10
ever, the CCN response is weak, with negative changes over the central Arctic ocean. The weak response is due to the efficient scavenging of aerosol by extensive drizzling stratocumulus clouds. In the scavenging-dominated Arctic environment, the produc-tion of condensable vapour from oxidaproduc-tion of dimethyl sulphide grows particles to sizes where they can be scavenged. This loss is not sufficiently compensated by new
par-15
ticle formation, due to the suppression of nucleation by the large condensation sink resulting from sea-salt and primary OA emissions. Thus, our results suggest that in-creased aerosol emissions will not cause a climate feedback through changes in cloud microphysical and radiative properties.
1 Introduction
20
Arctic warming has already caused a decline in sea ice extent over the past quarter century, which has accelerated over the past decade (Comiso, 2002; Boé et al., 2009). Current climate models predict that the late summer Arctic could be near ice free in less than 50 yr (Holland et al., 2006) and is likely to be by 2100 (Boé et al., 2009). The rapidity of Arctic climate change compared to lower latitudes has been attributed to
25
ACPD
13, 17087–17121, 2013Response of Arctic CCN to sea-ice
retreat
J. Browse et al.
Title Page
Abstract Introduction
Conclusions References
Tables Figures
◭ ◮
◭ ◮
Back Close
Full Screen / Esc
Printer-friendly Version Interactive Discussion
Discussion
P
a
per
|
D
iscussion
P
a
per
|
Discussion
P
a
per
|
Discuss
ion
P
a
per
|
et al., 2011). However, recent observations by Liu et al. (2012) suggest that sea-ice loss has also increased Arctic cloudiness by 0.3–0.5 % between 2000 and 2010.
The ice-albedo feedback can be separated into two aspects described by Curry et al. (1995) as; (1) the sea-ice edge albedo feedback (albedo decrease associated with re-ductions in horizontal sea-ice extent), and (2) the sea-pack ice albedo feedback (albedo
5
decrease associated with internal changes occurring in the multi-year pack-ice). Between 1979 and 2007 the surface global radiative forcing from observed sea-ice retreat (aspect 1) was calculated as 0.1 W m−2 (Hudson, 2011; Flanner et al., 2011). This forcing was predicted by Hudson (2011) to increase to 0.3 W m−2 assuming zero sea-ice extent in the Arctic for 1 month per year (and diminished extent for the rest
10
of year). However, in combination with a 15 % increase in Arctic cloudiness the net surface forcing was estimated as −0.3 W m−2. Thus, the significance of the
sea-ice-albedo feedback is predicated on the response of Arctic clouds to sea-ice loss and increasing SST.
An aerosol-cloud feedback mechanism has been proposed in which a large increase
15
in sea salt aerosol from an exposed Arctic ocean increases the atmospheric aerosol op-tical depth (AOD) and cloud albedo, thereby mitigating the decrease in surface albedo due to sea-ice retreat (Struthers et al., 2010). However, the loss of Arctic sea ice may also increase the source strength of primary biological particles (Bigg and Leck, 2001; Leck and Bigg, 2005; Orellana et al., 2011; Heintzenberg and Leck, 2012) and the
20
aerosol precursor gas dimethyl sulfide (DMS) (Leck and Persson, 1996; Gabric et al., 2005). Intuitively, an increase in the emission of primary aerosol and DMS emission in the Arctic summer should cause an increase in aerosol abundance, AOD and cloud condensation nuclei (CCN) concentrations, with associated negative surface radiative forcings (Hu et al., 2005). Indeed, Struthers et al. (2010) showed that an increase in
25
sea-salt emission in an ice-free Arctic would increase natural aerosol optical depth by 23 %, causing a regional direct surface forcing of−0.3±0.1 W m−2and a much larger
first indirect forcing of−3±1 W m−2. However, the response of Arctic aerosol to
ACPD
13, 17087–17121, 2013Response of Arctic CCN to sea-ice
retreat
J. Browse et al.
Title Page
Abstract Introduction
Conclusions References
Tables Figures
◭ ◮
◭ ◮
Back Close
Full Screen / Esc
Printer-friendly Version Interactive Discussion
Discussion
P
a
per
|
D
iscussion
P
a
per
|
Discussion
P
a
per
|
Discuss
ion
P
a
per
(Heintzenberg and Leck, 2012) and sinks (Browse et al., 2012) and an inadequate de-scription of these processes in models (Shindell et al., 2008; Korhonen et al., 2008; Birch et al., 2012).
Here, we further investigate this potentially large aerosol indirect forcing by exam-ining the response of Arctic CCN to additional primary aerosol (sea-salt and
biolog-5
ical particles) and DMS emissions. We use the global aerosol microphysics model (GLOMAP-mode) (Mann et al., 2010), which has been recently improved to better re-produce summertime aerosol mass observed at high latitude ground-stations (south of 82◦N) (Browse et al., 2012). In this study the model is evaluated further against CCN and aerosol size distribution measurements north of 87◦N during the Arctic Summer
10
Cloud Ocean Study (ASCOS) in the summer of 2008.
2 Model description and experimental set-up
The model was run at a resolution of 2.8◦×2.8◦ with 31 pressure levels extending
from the surface to 10 hPa. GLOMAP (Mann et al., 2010) uses a two-moment aerosol size-resolving scheme to calculate particle mass and number in seven variable-size
15
log-normal modes (four soluble, three insoluble).
The microphysical processes in GLOMAP include; wet (Browse et al., 2012) and dry deposition, ageing of carbonaceous particles from an initial insoluble state to water soluble, oxidation of sulphur dioxide gas (SO2) to sulphate in cloud droplets (aqueous phase oxidation), condensation growth between modes (due to uptake of sulphuric
20
acid and secondary organic vapours), nucleation of H2SO4vapour to sulphate aerosol
(in the boundary layer and free troposphere) and coagulation between modes (Mann et al., 2010).
Emissions of anthropogenic black carbon (BC) and organic carbon (OC) particles and anthropogenic and volcanic SO2 were taken from the Aerosol Comparisons be-25
ACPD
13, 17087–17121, 2013Response of Arctic CCN to sea-ice
retreat
J. Browse et al.
Title Page
Abstract Introduction
Conclusions References
Tables Figures
◭ ◮
◭ ◮
Back Close
Full Screen / Esc
Printer-friendly Version Interactive Discussion
Discussion
P
a
per
|
D
iscussion
P
a
per
|
Discussion
P
a
per
|
Discuss
ion
P
a
per
|
(v2) (van der Werf et al., 2010). GLOMAP is forced by European Centre for Medium-Range Weather Forecasts (ECMWF) 6 hourly global meteorological analyses, which diagnose winds below 6 m s−1for 90 % of the time over the late summer pack-ice, com-paring well to observations (Tjernström et al., 2012).
In GLOMAP the sources of summertime Arctic aerosol are: (1) transport from lower
5
latitudes, which is substantially suppressed by scavenging in low-level clouds (Browse et al., 2012); (2) particles nucleated in the free troposphere and ultimately transported into the boundary layer (BL); (3) particles nucleated directly in the BL from H2SO4
derived from DMS and other sources of SO2 (assumed to follow a nucleation rate
j=A[H2SO4], Kulmala et al., 2006); (4) wind-driven sea salt emissions from open leads
10
and the marginal ice zone (MIZ). Below, we show that the model can simulate a real-istic size distribution and CCN population based on these processes alone. However, many studies have shown the importance of marine primary organic material (often re-ferred to as biogenic microcolloids or polymer microgels) secreted from phytoplankton, sea-ice algae and bacteria in the ocean mixed layer for Arctic CCN (Orellana et al.,
15
2011; Leck and Bigg, 2005; Bigg and Leck, 2008, 2001). We therefore include a new empirically-derived marine primary OC emission flux in GLOMAP.
To calculate a primary biological flux of particles we used a similar approach to Lohmann and Leck (2005), adjusting a marine OC flux (ranging from 0.5 to 5.0 µm−2d−1 OC) until the observed particle size distribution from the ASCOS
obser-20
vations was reproduced. OC particles were emitted as a lognormal mode of geometric mean diameter 40 nm and geometric standard deviation of 1.4 based on measure-ments in Heintzenberg et al. (2006) and Covert et al. (1996). The best agreement with the observed accumulation mode came from inclusion of a OC flux of 2.85 µg m−2d−1 OC (per area of open water), which when scaled to the median sea-ice fraction (∼90 %) 25
resulted in an August median primary OC flux north of 85◦N of 0.3 µg m−2d−1OC.
sea-ACPD
13, 17087–17121, 2013Response of Arctic CCN to sea-ice
retreat
J. Browse et al.
Title Page
Abstract Introduction
Conclusions References
Tables Figures
◭ ◮
◭ ◮
Back Close
Full Screen / Esc
Printer-friendly Version Interactive Discussion
Discussion
P
a
per
|
D
iscussion
P
a
per
|
Discussion
P
a
per
|
Discuss
ion
P
a
per
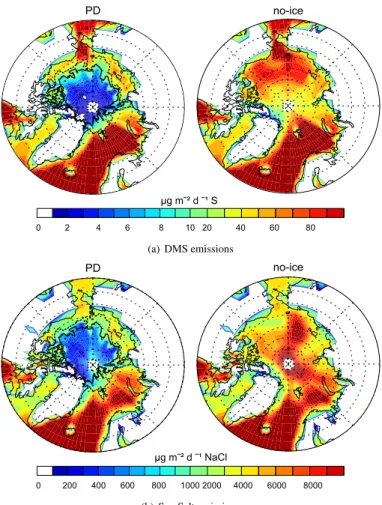
salt emission interquartile range of 200–2300 µg m−2d−1NaCl north of 70◦N. However, emission fluxes greater than 1000 µg m−2d−1NaCl occur exclusively in the MIZ (65 to 75◦N) with emissions north of 85◦N ranging from 460–700 µg m−2
d−1
NaCl (Fig. 1a). GLOMAP has been shown to simulate observed surface level concentrations of sea-salt aerosol at lower latitudes well (Mann et al., 2010), although no similar
measure-5
ments are available over regions of sea ice.
DMS seawater concentrations are taken from the inventory of Kettle et al. (1999), which incorporates measurements from the sub-Arctic seas and central Arctic ocean (Leck and Persson, 1996). The DMS sea-air flux was calculated using the transfer ve-locity parametrisation of Nightingale et al. (2000) which agrees well with measurements
10
at wind-speeds<10 m s−1 (Huebert et al., 2004). Using year 2000 sea ice climatolo-gies, the August–September DMS flux simulated north of 85◦N (90–100 % pack ice)
has an interquartile range of 0.6–2.68 µg m−2d−1S, which encompasses the observed flux of 0.9 µg m−2d−1S at∼87◦N (Leck and Persson, 1996). Modelled DMS emissions
from July to September in the MIZ are a factor of∼20 greater than in the central Arctic 15
ocean (Fig. 1b), consistent with observations (Leck and Persson, 1996).
In GLOMAP, oxidation of DMS and SO2to condensable H2SO4vapour is driven by
OH and NO3concentrations (Spracklen et al., 2005). SO2can add to aerosol mass via several pathways: (1) nucleation of new particles from H2SO4 vapour (Kulmala et al.,
2006), (2) aqueous phase oxidation of SO2 (by HO2 and O3) in clouds (Mann et al., 20
2010; Woodhouse et al., 2013), and (3) condensation of H2SO4vapour onto the surface of existing aerosol (condensation and ageing processes Mann et al., 2010). However, only nucleation of new particles from H2SO4 vapour will add to aerosol number as
well as mass. Thus, the efficacy of DMS as an aerosol precursor is dependent on the abundance of oxidants in the Arctic atmosphere and the efficiency and frequency of
25
growth (condensation and wet oxidation) processes.
ACPD
13, 17087–17121, 2013Response of Arctic CCN to sea-ice
retreat
J. Browse et al.
Title Page
Abstract Introduction
Conclusions References
Tables Figures
◭ ◮
◭ ◮
Back Close
Full Screen / Esc
Printer-friendly Version Interactive Discussion
Discussion
P
a
per
|
D
iscussion
P
a
per
|
Discussion
P
a
per
|
Discuss
ion
P
a
per
|
CCN response to oxidant concentrations by repeating our analysis using the coupled version of GLOMAP (Breider et al., 2010) so that increased DMS concentrations feed-back on oxidant concentrations.
Several model simulations were performed to evaluate the model against recent ob-servations and then to quantify the response of aerosol to changes in sea ice cover.
5
The model was run from 1 August–30 September 2008 after a 3 month spin up. Monthly mean sea ice fractions are for the year 2000. The majority of results shown here are for the month of August although in all instances a similar CCN response to sea-ice loss was seen in July. The four core simulations in the study are defined as:
1. PD: a present-day control run identical to that presented in Browse et al. (2012),
10
which does not include marine OC emissions.
2. PD-MOC: same as PD but with primary marine OC (MOC) emissions from the Arctic Ocean.
3. no-ice and no-ice-MOC: same as PD and PD-MOC, respectively except that sea-ice fraction in the Northern Hemisphere is set to zero for July, August and
15
September for all model processes.
We also ran several sensitivity cases to test the importance of different processes: PD-noBLN, a present-day run to quantify the importance of boundary layer nucleation (BLN); no-ice [SS], in which the removal of sea-ice affects only sea-salt emissions; and no-ice [DMS], in which the removal of sea-ice affects only DMS emissions. Further runs
20
also test the importance of drizzle scavenging by suppressing low-cloud precipitation in the present day (PD-noDRIZZ) and after sea-ice loss (no-ice-noDRIZZ). We do not examine the isolated effect of marine organic primary emissions but include the effect of extrapolating the “tuned” OC emission over the entire Arctic ocean in no-ice-MOC in addition to sea-salt and DMS emission increases. The processes and emission fluxes
25
ACPD
13, 17087–17121, 2013Response of Arctic CCN to sea-ice
retreat
J. Browse et al.
Title Page
Abstract Introduction
Conclusions References
Tables Figures
◭ ◮
◭ ◮
Back Close
Full Screen / Esc
Printer-friendly Version Interactive Discussion
Discussion
P
a
per
|
D
iscussion
P
a
per
|
Discussion
P
a
per
|
Discuss
ion
P
a
per
3 The Arctic Summer Cloud Ocean study (ASCOS)
The ASCOS ship campaign took place in 2008 between 2 August–9 September aboard the Swedish ice-breakerOden. The campaign took place in the Arctic Ocean starting in Longyearbyen and included a three week measurement period on a drifting ice-floe at approximately 87◦N (Paatero et al., 2009; Tjernström et al., 2013). One purpose of
5
ASCOS was to study the linkage between local aerosol processes and the life-cycle of low-level clouds in the shallow Arctic boundary layer. Thus, detailed measurements of boundary layer CCN and the aerosol size distribution were taken over the majority of the observation period.
During ASCOS, the sub-micron size distribution was measured every 10 min by
10
a Tandem Differential Mobility Particle Sizer (TDMPS) (Heintzenberg and Leck, 2012). This system consisted of two differential mobility analysers working in parallel over an overlapping size range. Particles were sampled through a PM10 inlet and the size spectra calculated over 45 size bins in the range 3–800 nm. These measurements were found to agree well with a second DMPS system used during the campaign. Further
15
details of this system are discussed in Martin et al. (2011).
Both the DMPS system and CCN counter used the same sampling method. The PM10 inlet mast was situated 25 m above sea-level and protected from local ship
pol-lution by both the position of the inlet and the use of a polpol-lution controller. A similar method was used for all three previous campaigns in this region (Arctic ocean
experi-20
ments, 91, 96, 01) and is discussed in detail in Leck et al. (2001). CCN were measured using two identical CCN counters (Roberts and Nenes, 2005). The first measured CCN at a fixed supersaturation of 0.2 %, while the second cycled between 0.1 % and 0.7 % supersaturation. The first instrument was used to measure CCN number concentra-tions and the second to determine the sensitivity of measured CCN to the choice of
25
supersaturation (Mauritsen et al., 2011; Martin et al., 2011).
ACPD
13, 17087–17121, 2013Response of Arctic CCN to sea-ice
retreat
J. Browse et al.
Title Page
Abstract Introduction
Conclusions References
Tables Figures
◭ ◮
◭ ◮
Back Close
Full Screen / Esc
Printer-friendly Version Interactive Discussion
Discussion
P
a
per
|
D
iscussion
P
a
per
|
Discussion
P
a
per
|
Discuss
ion
P
a
per
|
et al., 2001). We restrict our comparison to the period that the ship was moored to an ice floe at 87◦N and compare the median size distribution and normalized probability distribution of CCN concentration from 12 August–1 September 2008.
4 Modelling present day Arctic CCN
After improvements to the treatment of scavenging in the model, GLOMAP has been
5
shown to reproduce observed sulphate and equivalent BC (EBC) mass concentrations at Arctic ground stations (<82◦N) well (Browse et al., 2012). However, the indirect
aerosol effect depends on CCN concentration changes, not the aerosol component masses. We therefore evaluate the model against CCN and size distribution measure-ments over the high-Arctic pack-ice from the Arctic Summer Cloud Ocean Study
(AS-10
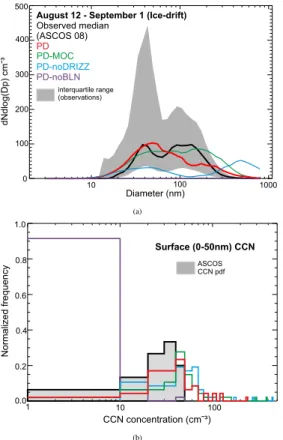
COS). We compare the model against the observations in terms of the size distribu-tion, the CCN frequency histogram, and the slope and intercept of modelled versus observed integrated particle concentration between 3 and 800 nm diameter (Fig. 2).
The PD run can explain the median Aitken mode particle concentrations, but predicts too low number of particles in the accumulation mode (Fig. 2a). In contrast, the
PD-15
noBLN run has extremely low particle concentrations across the full distribution. Thus, in the PD model, boundary layer nucleation (BLN) is the main source of boundary layer CCN (Fig. 2b) and the contribution of sea salt particles is insignificant, a result consistent with the analysis of Bigg and Leck (2008). The slope of modelled versus observed particle number (3–800 nm diameter) is 0.96 in the PD run, but the intercept
20
is 60 cm−3, suggesting that the model cannot represent periods of very low aerosol concentrations. This bias is also evident comparing the CCN frequency histogram for the ice-drift period (Fig. 2b) which suggests that CCN concentrations are generally overestimated by GLOMAP.
The choice of BLN mechanism in our model is consistent with Karl et al. (2012),
25
nucle-ACPD
13, 17087–17121, 2013Response of Arctic CCN to sea-ice
retreat
J. Browse et al.
Title Page
Abstract Introduction
Conclusions References
Tables Figures
◭ ◮
◭ ◮
Back Close
Full Screen / Esc
Printer-friendly Version Interactive Discussion
Discussion
P
a
per
|
D
iscussion
P
a
per
|
Discussion
P
a
per
|
Discuss
ion
P
a
per
ation rate coefficient (A) used in Karl et al. (2012) is a factor of 10 lower than that used in GLOMAP. Therefore, overestimation of particle number could stem from overesti-mation of the BLN rate. However, uncertainty analysis of GLOMAP-mode (Lee et al., 2012) suggests that modelled CCN concentrations are fairly insensitive to a factor of 10 change in the BLN rate. Thus, overestimation of particle number is more likely to
5
stem from inter-related processes such as an underestimation of the Arctic boundary layer H2SO4condensation sink.
Inclusion of the tuned 40 nm diameter marine OC emissions with BLN (run PD-MOC) improves the agreement with the observed accumulation mode particle number con-centration (Fig. 2a). It also improves the total particle concon-centration model-observation
10
intercept (13.3 cm−3
) with a slope of 1.1 (Fig. 2a). The reduced intercept concentra-tion is a result of suppression of BLN caused by the higher primary OC surface area. Reproduction of the observed Aitken mode without BLN was not possible in GLOMAP without significant alterations to model processes or by reducing the size of the OC particles to less than 40 nm.
15
On balance, we argue that a combination of Aitken primary marine OC emissions and boundary layer nucleation can best explain the observed size distribution and CCN concentration over the pack-ice. But other plausible models cannot be rejected, such as assuming that all Aitken and accumulation mode particles are derived from primary OC (with no BLN), requiring some form of particle disaggregation or altered emission
20
size distribution (Heintzenberg and Leck, 2012).
Finally, we note that our simulations confirm a significant role of drizzle scavenging in controlling Arctic CCN. Suppressing stratocumulus cloud scavenging (PD-noDRIZZ) increases the positive bias in modelled CCN (Fig. 2b) and results in a very poor agree-ment with the observed size distribution, decreasing the model-observation slope for
25
ACPD
13, 17087–17121, 2013Response of Arctic CCN to sea-ice
retreat
J. Browse et al.
Title Page
Abstract Introduction
Conclusions References
Tables Figures
◭ ◮
◭ ◮
Back Close
Full Screen / Esc
Printer-friendly Version Interactive Discussion
Discussion
P
a
per
|
D
iscussion
P
a
per
|
Discussion
P
a
per
|
Discuss
ion
P
a
per
|
5 Effect of removing sea ice
5.1 Changes in emissions of sea-salt, DMS and marine OC
The removal of sea ice increases the median mass emission of sea salt aerosol be-tween 70◦ and ∼90◦N by a factor of 10 to ≈6000 µg m−2d−1 NaCl (approximately
one-third that of the North Atlantic). Spatially, maximum sea salt emission is now in
5
the central Arctic Ocean rather than the Greenland and Barents Seas (Fig. 1a). This increase is greater than the factor of 3.5 calculated by Struthers et al. (2010). The dif-ference in sea-salt emission is likely due to a number of factors, such as the use of non-zero sea-ice fraction in Struthers et al. (2010) or differences in the emitted size range.
10
Predictions of future Arctic marine biological activity with respect to microcolloid pro-duction are highly uncertain. The melting of sea-ice in general enhances biological activity through various processes (Wassmann and Reigstad, 2011). Thus, for no-ice runs with marine organics (no-ice-MOC) we have extended our derived OC flux over the entire central Arctic Ocean resulting in a uniform emission in the central and
sub-15
Arctic seas of 2.85 µg m−2d−1 OC, increasing the median primary OC emission north of 70◦N by a factor of∼4 from PD-MOC.
Given the diversity of future predictions of Arctic phytoplankton distribution and species (Gabric et al., 2005) we use the same seawater DMS concentration inven-tories (extrapolated from observations in the 1990s) (Kettle et al., 1999) for the PD
20
and no-ice runs. DMS emission between 70◦ and 90◦N in the no-ice simulation has increased by a factor of 15 from the PD run (Fig. 1b). This increase is greatest north of 85◦N where the DMS flux in August has increased from a median 2 µg m−2d−1S to a median 33 µg m−2d−1S (a factor of∼40 greater than currently observed (Leck and
Persson, 1996)). However, the spatial distribution of DMS emission has changed little
25
ACPD
13, 17087–17121, 2013Response of Arctic CCN to sea-ice
retreat
J. Browse et al.
Title Page
Abstract Introduction
Conclusions References
Tables Figures
◭ ◮
◭ ◮
Back Close
Full Screen / Esc
Printer-friendly Version Interactive Discussion
Discussion
P
a
per
|
D
iscussion
P
a
per
|
Discussion
P
a
per
|
Discuss
ion
P
a
per
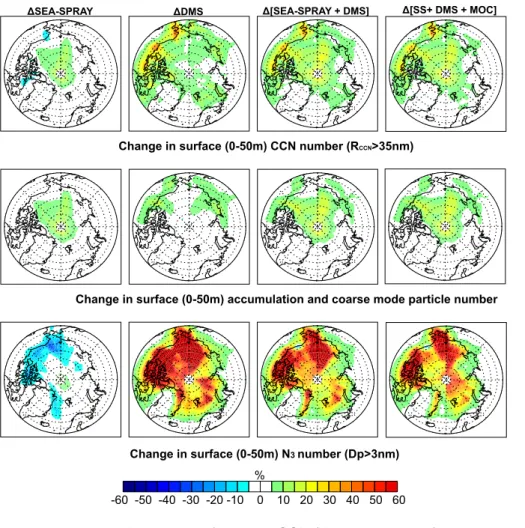
5.2 Changes in CCN concentration
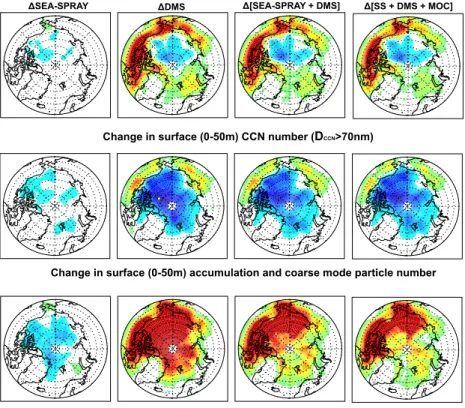
Figure 3 shows the change in CCN concentration averaged from 0 to 50 m altitude in August from the PD and no-ice runs as well as the no-ice [SS] and no-ice [DMS] sensitivity runs. CCN are defined here as particles with diameter>70 nm, which cor-responds approximately to particles activated at 0.2 % supersaturation (to match the
5
ASCOS observations). A supersaturation of 0.2 % is high for Arctic low-level clouds, thus we also present changes in accumulation (and coarse) mode particle concentra-tions, which corresponds to CCN activation of particles larger than 100 nm diameter (geometric mean diameter of 300–400 nm), or a supersaturation of∼0.1 %.
Two points stand out from Fig. 3. First, when only sea-salt emissions respond to
10
loss of ice over the Arctic ocean, there is a small decrease of about 5 % in CCN and a decrease in the total particle concentration (N3, particles larger than 3 nm) of 5–10 %. Secondly, there is a decrease of 10–30 % in CCN in the central Arctic ocean when only DMS emissions respond but a>60 % increase inN3. The central Arctic CCN decrease remains when both sea-salt and DMS emissions respond. This response is even larger
15
(>50 %) and more widespread (encompassing the entire oceanic Arctic region) when CCN are classed as aerosol within the accumulation and coarse modes only. However, the inclusion of both sea-salt and DMS response results in an increase in N3 (10– 60 %). These changes in particle concentration are not restricted to the surface layer, but extend up to about 800 hPa (Fig. 5)
20
Also shown (Fig. 3, right column) is the change in CCN between the PD-MOC and no-ice-MOC simulations. The inclusion of a primary marine OC source has not sig-nificantly altered the response of CCN to sea-ice retreat. However, in some regions (most notably north of Svalbard) the increase in CCN between the PD and no-ice runs becomes negligible when primary marine OC emissions are included in simulations.
25
ACPD
13, 17087–17121, 2013Response of Arctic CCN to sea-ice
retreat
J. Browse et al.
Title Page
Abstract Introduction
Conclusions References
Tables Figures
◭ ◮
◭ ◮
Back Close
Full Screen / Esc
Printer-friendly Version Interactive Discussion
Discussion
P
a
per
|
D
iscussion
P
a
per
|
Discussion
P
a
per
|
Discuss
ion
P
a
per
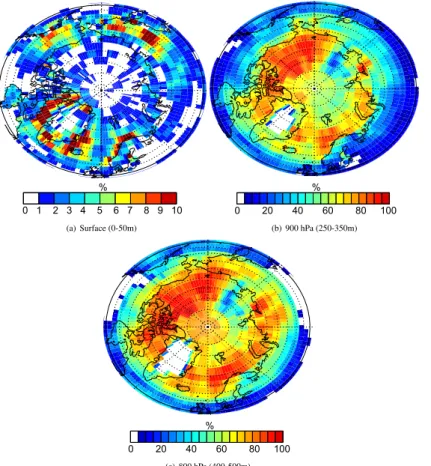
|
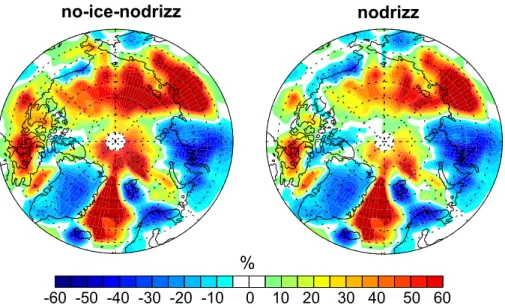
Arctic aerosol to sea-ice retreat. Figure 4 shows the CCN change in August when stra-tocumulus cloud scavenging is suppressed in all PD and no-ice runs (PD-noDRIZZ and no-ice-noDRIZZ). Without this local deposition process, the removal of sea-ice results in a universal increase in central Arctic CCN (10–20 %) andN3 (10–60 %) in all runs where DMS and primary aerosol emissions have been perturbed. However, it must be
5
noted that the significant CCN increase (∼60 %) over the continental Canadian Arctic
(Fig. 3) is reduced to less than 20 % if we assume a negligible stratocumulus scaveng-ing rate in the model (Fig. 4).
Here, we have shown that in the central Arctic surface concentrations of CCN de-crease after sea-ice retreat. The heterogeneous and non-intuitive response of
mod-10
elled CCN to additional DMS and primary aerosol (sea-salt and organic) emissions in the Arctic atmosphere is dependent on the strength of local scavenging processes in the Arctic boundary layer. Below we explain this response in terms of competing nu-cleation and growth (condensation, ageing and aqueous phase oxidation) processes in the scavenging-dominated Arctic BL by examining the average size distribution and
15
microphysical fluxes in regions of CCN increase and decrease (Fig. 5).
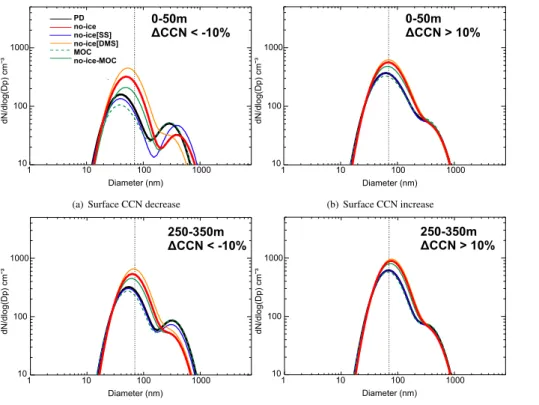
6 Explaining the CCN response
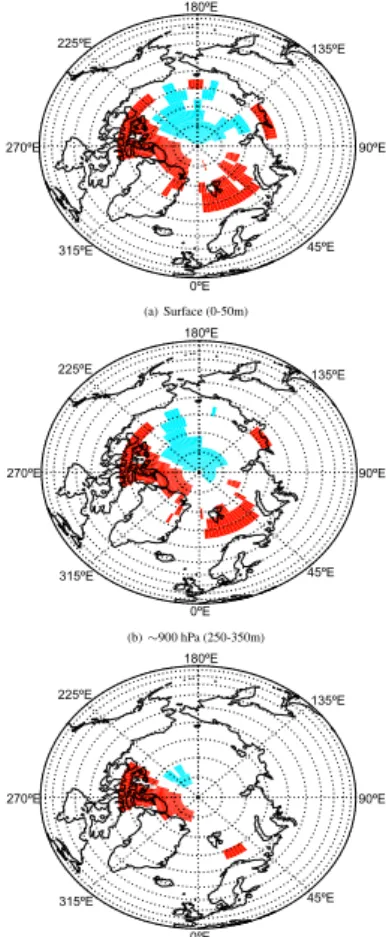
Figure 6 shows the size distribution for all runs in Figs. 3 and 4 averaged over all grid-boxes where CCN number has decreased in no-ice compared to PD by more than 10 % and where CCN number has increased in no-ice by more than 10 %. Results are shown
20
for the surface layer (0–50 m) and between 250–350 m (where low cloud fraction is higher, Fig. 7). In addition, Table 2 shows the percentage change in nucleation, particle growth (condensation, aqueous phase oxidation and ageing) and sulphate scavenging rates for regions where CCN has decreased in no-ice.
When sea-salt emissions alone (without primary organics) respond to ice loss (no-ice
25
con-ACPD
13, 17087–17121, 2013Response of Arctic CCN to sea-ice
retreat
J. Browse et al.
Title Page
Abstract Introduction
Conclusions References
Tables Figures
◭ ◮
◭ ◮
Back Close
Full Screen / Esc
Printer-friendly Version Interactive Discussion
Discussion
P
a
per
|
D
iscussion
P
a
per
|
Discussion
P
a
per
|
Discuss
ion
P
a
per
centrations increase and accumulation mode concentrations decrease. The combined effect of changes in sea spray, DMS and marine primary organics (the no-ice-MOC run) is to increase the size and number concentration of the Aitken mode everywhere but decrease the number of accumulation mode particles. Thus, CCN concentrations decrease in regions where the increase in large (>70 nm diameter) Aitken particles
5
is insufficient to compensate for the loss of accumulation mode particles (Fig. 6). This response is the same at 900hpa. However, within the cloud layer (Fig. 7) the response to sea-salt emissions alone is reduced (Fig. 6c, d).
The microphysical fluxes help to explain these changes in CCN and the size dis-tribution in terms of changes in nucleation, growth and scavenging rates. In regions
10
where CCN are suppressed (Table 2), nucleation rates fall by 54 % at the surface when only sea spray responds to sea ice loss (run no-ice [SS]), but they increase by 60 % when both DMS and sea spray respond (run no-ice), and by 391 % when only DMS responds (run no-ice [DMS]). Sea spray therefore strongly suppresses nucleation and DMS strongly enhances it, leading to a small net enhancement in nucleation when both
15
DMS and sea spray respond to ice loss.
The decrease in nucleation rates in response to additional sea-spray is an effect of increasing the condensation sink in a strongly scavenging environment. When we in-crease the surface level condensation sink (sea-spray response to sea-ice loss) but maintain present day DMS concentrations (as in no-ice [SS]) the nucleation flux
de-20
creases (54 %) but the condensation flux increases by 26 % (Table 2). This response results in a decrease in total particle number (N3) (Fig. 6a), an increase in particle size, and a 10 % increase in scavenged accumulation mode sulphate because larger particles are more efficiently scavenged (Table 2).
We propose that the modelled response of CCN to sea-ice loss can be explained by
25
the interaction of several competing processes in the Arctic boundary layer, in terms of changes in the particle size distribution (Fig. 6):
near-ACPD
13, 17087–17121, 2013Response of Arctic CCN to sea-ice
retreat
J. Browse et al.
Title Page
Abstract Introduction
Conclusions References
Tables Figures
◭ ◮
◭ ◮
Back Close
Full Screen / Esc
Printer-friendly Version Interactive Discussion
Discussion
P
a
per
|
D
iscussion
P
a
per
|
Discussion
P
a
per
|
Discuss
ion
P
a
per
|
surface nucleation (−50 %) is evident in the reduction inN3 (Fig. 3). At the same time sea-salt aerosol itself does not add significantly to CCN as it is strongly scav-enged (evident in the negligible size distribution changes at cloud level between PD and no-ice [SS]).
2. More DMS alone can cause a reduction in CCN because the increase in H2SO4 5
grows all particles to sizes where they can be wet scavenged more easily (Ta-ble 2). In the central Arctic this effect is only partly offset by increased boundary layer nucleation (evident in the large increase inN3in Fig. 3).
3. A combination of DMS, OC and sea-salt accelerates the growth of primary parti-cles (increasing the scavenging rate) while simultaneously suppressing nucleation
10
due to a higher condensation sink near the surface. In regions away from the sea salt source, such as over the continental Canadian Arctic (Fig. 1a), this response is more than compensated for by the enhanced supply of CCN from boundary layer nucleation.
Finally, our results suggest that aqueous phase oxidation within cloud droplets
15
(wherein SO2 reacts with OH in cloud droplets to form H2SO4) is a significant sink
for Arctic DMS (Table 2) which increases in a no-ice scenario (264 %). Thus, the im-pact of DMS emissions on CCN is suppressed due the existing boundary layer clouds, a result consistent with the analysis of Woodhouse et al. (2013) who suggest that the inefficiency of the CLAW mechanism (Leck and Bigg, 2008; Quinn and Bates, 2011;
20
Woodhouse et al., 2010) stems from the efficient oxidation processes which suppress new particle formation in the remote marine boundary layer.
6.1 Response of CCN to precipitation suppression
In these simulations we have assumed that the change in aerosol emissions has no effect on cloud microphysics. However, complex microphysical responses of the Arctic
25
ACPD
13, 17087–17121, 2013Response of Arctic CCN to sea-ice
retreat
J. Browse et al.
Title Page
Abstract Introduction
Conclusions References
Tables Figures
◭ ◮
◭ ◮
Back Close
Full Screen / Esc
Printer-friendly Version Interactive Discussion
Discussion
P
a
per
|
D
iscussion
P
a
per
|
Discussion
P
a
per
|
Discuss
ion
P
a
per
and precursor emissions do not feedback on aerosol removal, but cause a suppression of precipitation.
As an extreme case we can quantify the change in CCN between the PD run with drizzle and the no-ice run without drizzle (assuming the extra aerosol suppresses pre-cipitation). In this extreme scenario the removal of ice leads to significant increases
5
in the central Arctic CCN (10–40 %), while in more southerly regions, CCN decreases (Fig. 8). However, Fig. 8 shows that the change in CCN between PD (with drizzle) and no-ice-noDRIZZ (with suppressed drizzle) is very similar to the change in CCN between PD and PD-noDRIZZ. The explanation lies in the role of drizzle in scavenging aerosol transported from lower latitudes (Browse et al., 2012). When drizzle is suppressed in
10
the no-ice run, Arctic CCN becomes dominated by aerosol transported from low lati-tudes, which is the same aerosol that flows into the Arctic when drizzle is suppressed in the PD. Given our poor understanding of Arctic clouds this model response is spec-ulative, however, our analysis points to the need for a much better understanding of aerosol-cloud interaction in the Arctic.
15
6.2 Oxidant limitations
In the absence of precipitation suppression, CCN change in GLOMAP after sea-ice loss is driven partly by the increase in DMS emission. However, the rate of SO2formation from DMS is dependent on the availability of oxidants in the Arctic boundary layer (Voulgarakis et al., 2009). The previous analysis was performed with the uncoupled
20
version of GLOMAP which used fixed oxidant fields (including HOx and NOx) from Arnold et al. (2005). Thus, the feedback from increasing DMS concentrations on the abundance of oxidants was neglected.
Similar analysis using a coupled version of the model (Breider et al., 2010) shows a similar CCN response (Fig. 9) as shown in Fig. 3. This result suggests that oxidant
25
ACPD
13, 17087–17121, 2013Response of Arctic CCN to sea-ice
retreat
J. Browse et al.
Title Page
Abstract Introduction
Conclusions References
Tables Figures
◭ ◮
◭ ◮
Back Close
Full Screen / Esc
Printer-friendly Version Interactive Discussion
Discussion
P
a
per
|
D
iscussion
P
a
per
|
Discussion
P
a
per
|
Discuss
ion
P
a
per
|
suggest that sea-ice retreat results in a 30–60 % decrease in OH concentrations at high latitudes which could act to suppress the effect of greater DMS emission.
The sensitivity of CCN to oxidant abundance has not been tested here. However, If oxidant concentrations decrease as dramatically as Voulgarakis et al. (2009) sug-gest, then the CCN response to sea-ice retreat may become dominated by primary
5
emissions (i.e the response of CCN to no-ice [SS]) and thus, negligible.
7 Conclusions
Before the end of this century, significant Arctic sea-ice losses are likely to affect many aspects of the Arctic and global climate including aerosol and CCN characteristics. In this study, the total removal of sea-ice from July to September increased emission
10
of sea-salt, marine primary organic aerosol and DMS north of 70◦N in GLOMAP by factors of∼10,∼4 and∼15 respectively. The combined increase in primary aerosol
and DMS emission increased total particle concentrations by 30–40 % north of 80◦N. However, the change in CCN was non-uniform with significant increases over the con-tinental Arctic and small decreases over the central Arctic Ocean (Fig. 3).
15
Analysis of the modelled size distribution (Fig. 6) and relative change in nucleation rate (Table 2) suggests that this spatially non-uniform CCN response is the result of enhanced growth and nucleation processes (from the additional DMS-derived sulphuric acid vapour), competing in a strongly scavenging environment. Where the boundary layer condensation sink is large (such as over the open Arctic ocean with enhanced
20
sea-spray) nucleation is suppressed. In this environment, particles grow to sizes where they are more readily scavenged, leading to a reduction in accumulation mode particle concentrations. However, over continental regions without an enhanced sea-salt flux, nucleation processes dominate and particle concentrations increase (Fig. 3).
These modelled responses are plausible in terms of microphysical effects, but our
25
ACPD
13, 17087–17121, 2013Response of Arctic CCN to sea-ice
retreat
J. Browse et al.
Title Page
Abstract Introduction
Conclusions References
Tables Figures
◭ ◮
◭ ◮
Back Close
Full Screen / Esc
Printer-friendly Version Interactive Discussion
Discussion
P
a
per
|
D
iscussion
P
a
per
|
Discussion
P
a
per
|
Discuss
ion
P
a
per
assumed that the aerosol system responds to loss of ice but that atmospheric dy-namics and clouds remain unchanged. It is also plausible that the enhanced aerosol sources suppress Arctic drizzle, which would allow more efficient transport of aerosol into the Arctic from low-latitudes (resulting in a positive Arctic aerosol feedback in some regions).
5
Finally, the predicted growth of the marginal ice zone and the eventual future decline of multi-year sea-ice is also likely to result in a rise in local humidity and other meteoro-logically driven changes in cloud processes (Vavrus et al., 2011). Thus, the impact of any CCN change on the radiative characteristics of clouds must be quantified relative to the impact of higher Arctic humidity.
10
This work highlights the complexity of processes controlling the high Arctic summer aerosol size distribution and CCN load. Our results indicate that the CCN response to sea-ice loss is controlled by many inter-related processes. Thus, we suggest that for aerosol-cloud-climate feedbacks in the Arctic to be projected we must first address the significant gap in our understanding of polar aerosol and cloud processes in global
15
models.
Acknowledgements. JB was funded by a studentship from the Natural Environment Research Council (NERC) and by the Met Office through a CASE partnership. KC is a Royal Society Wolfson Merit Award holder. GWM is funded by the Natural Environment Research Council. We would like to thank Anja Schmidt and Matthew Woodhouse for their comments and as-20
sistance. This work is part of ASCOS (the Arctic Summer Cloud Ocean Study). ASCOS was made possible by funding from the Knut and Alice Wallenberg Foundation and the DAMO-CLES European Union 6th Framework Program Integrated Research Project. The Swedish Polar Research Secretariat (SPRS) provided access to the icebreakerOdenand logistical sup-port. Michael Tjernström and Caroline Leck are specifically thanked for their coordination of 25
ACPD
13, 17087–17121, 2013Response of Arctic CCN to sea-ice
retreat
J. Browse et al.
Title Page
Abstract Introduction
Conclusions References
Tables Figures
◭ ◮
◭ ◮
Back Close
Full Screen / Esc
Printer-friendly Version Interactive Discussion
Discussion
P
a
per
|
D
iscussion
P
a
per
|
Discussion
P
a
per
|
Discuss
ion
P
a
per
|
References
Arnold, S., Chipperfield, M., and Blitz, M.: A three-dimensional model study of the effect of new temperature-dependent quantum yields for acetone photolysis, J. Geophys. Res., 110, D22305, doi:10.1029/2005JD005998, 2005. 17092, 17102
Bigg, E. K. and Leck, C.: Properties of aerosol over the Central Arctic Ocean, J. Geophys. Res., 5
106, 32101–32109, doi:10.1029/1999JD901136, 2001. 17089, 17091
Bigg, E. K. and Leck, C.: The composition of fragments of bubbles bursting at the ocean surface, J. Geophys. Res., 113, D11209, doi:10.1029/2007JD009078, 2008. 17091, 17095
Birch, C. E., Brooks, I. M., Tjernström, M., Shupe, M. D., Mauritsen, T., Sedlar, J., Lock, A. P., Earnshaw, P., Persson, P. O. G., Milton, S. F., and Leck, C.: Modelling atmospheric structure, 10
cloud and their response to CCN in the central Arctic: ASCOS case studies, Atmos. Chem. Phys., 12, 3419–3435, doi:10.5194/acp-12-3419-2012, 2012. 17090
Boé, J., Hall, A., and Qu, X.: September sea-ice cover in the Arctic ocean projected to vanish by 2100, Nat. Geosci., 2, 341–343, 2009. 17088
Browse, J., Carslaw, K. S., Arnold, S. R., Pringle, K., and Boucher, O.: The scavenging pro-15
cesses controlling the seasonal cycle in Arctic sulphate and black carbon aerosol, Atmos. Chem. Phys., 12, 6775–6798, doi:10.5194/acp-12-6775-2012, 2012. 17090, 17091, 17093, 17095, 17098, 17102
Breider, T. J., Chipperfield, M. P., Richards, N. A. D., Carslaw, K. S., Mann, G. W., and Spracklen, D. V.: Impact of BrO on dimethylsulfide in the remote marine boundary layer, 20
Geophys. Res. Lett., 37, L02807, doi:10.1029/2009GL040868, 2010. 17093, 17102
Covert, D. S., Weidensohler, A., Aalto, P. P., Heintzenberg, J., McMurry, P. H., and Leck, C.: Aerosol number size distributions from 3 to 500 nm diameter in the Arctic marine boundary layer during summer and autumn, Tellus B, 48, 197–212, 1996. 17091
Comiso, J.: A rapidly declining perennial sea ice cover in the Arctic, Geophys. Res. Lett., 29, 25
1956, doi:10.1029/2002GL015650, 2002. 17088
Curry, J. A., Schramm, J. L., and Ebert, E. E.: Sea ice-albedo climate feedback mechanism, J. Climate, 8, 240–247, 1995. 17088, 17089
Dentener, F., Kinne, S., Bond, T., Boucher, O., Cofala, J., Generoso, S., Ginoux, P., Gong, S., Hoelzemann, J. J., Ito, A., Marelli, L., Penner, J. E., Putaud, J.-P., Textor, C., Schulz, M., 30
ACPD
13, 17087–17121, 2013Response of Arctic CCN to sea-ice
retreat
J. Browse et al.
Title Page
Abstract Introduction
Conclusions References
Tables Figures
◭ ◮
◭ ◮
Back Close
Full Screen / Esc
Printer-friendly Version Interactive Discussion
Discussion
P
a
per
|
D
iscussion
P
a
per
|
Discussion
P
a
per
|
Discuss
ion
P
a
per
the years 2000 and 1750 prescribed data-sets for AeroCom, Atmos. Chem. Phys., 6, 4321– 4344, doi:10.5194/acp-6-4321-2006, 2006. 17090
Flanner, M. G., Shell, K. M., Barlage, M., Perovich, D. K., and Tschudi, M. A.: Radative forcing and albedo feedback from the Northern Hemisphere cryosphere between 1979 and 2008, Nat. Geosci., 4, 151–155, doi:10.1038/ngeo1062, 2011. 17088, 17089
5
Gabric, A. J., Qu, B., Matrai, P., and Hirst, A. C.: The simulated response of dimethylsulphide production in the Arctic Ocean to global warming, Tellus B, 57, 391–403, 2005. 17089, 17097 Gong, S. L.: A parameterization of sea-salt aerosol source function for sub- and super-micron
particles, Global Biogeochem. Cy., 17, 8–16, doi:10.1029/2003GB002079, 2003. 17091 Heintzenberg, J. and Leck, C.: The summer aerosol in the central Arctic 1991–2008: did it 10
change or not?, Atmos. Chem. Phys., 12, 3969–3983, doi:10.5194/acp-12-3969-2012, 2012. 17089, 17090, 17094, 17096
Heintzenberg, J., Leck, C., Birmili, W., Wehner, B., Tjernström, M., and Weidensohler, A.: Aerosol number size-distributions during clear and fog periods in the summer high Arctic: 1991, 1996 and 2001, Tellus B, 58, 41–50, 2006. 17091
15
Holland, M. M., Bitz, C. M., and Tremblay, B.: Future abrupt reductions in the summer Arctic sea ice, Geophys. Res. Lett., 33, L23503, doi:10.1029/2006GL028024, 2006. 17088 Hu, R.-M., Blanchet, J.-P., and Girard, E.: Evaluation of the direct and indirect radiative
and climate effects of aerosols over the western Arctic, J. Geophys. Res., 110, D112213, doi:10.1029/2004JD005043, 2005. 17089
20
Hudson, S. R.: Estimating the global radiative impact of the sea ice-albedo feedback in the Arctic, J. Geophys. Res., 116, D16102, doi:10.1029/2011JD015804, 2011. 17089
Huebert, B. J., Blomquist, B. W., Hare, J. E., Fairall, C. W., Johnson, J. E., and Bates, T. S.: Measurements of the sea–air DMS flux and transfer velocity using eddy correlation, Geo-phys. Res. Lett., 31, L23113, doi:10.1029/2004GL021567, 2004. 17092
25
Karl, M., Leck, C., Gross, A., and Pirjola, L.: A study of new particle formation in the marine boundary layer over the central Arctic Ocean using a flexible multicomponent aerosol dy-namic model, Tellus B, 64, 17158, doi:10.3402/tellusb.v64i0.17158, 2012. 17095, 17096 Kettle, A. J., Andreae, M. O., Amouroux, D., Andreae, T. W., Bates, T. S., Berresheim, H.,
Binge-mer, H., Boniforti, R., Curran, M. A. J., DiTullio, G. R., Helas, G., Jones, G. B., Keller, M. D., 30
ACPD
13, 17087–17121, 2013Response of Arctic CCN to sea-ice
retreat
J. Browse et al.
Title Page
Abstract Introduction
Conclusions References
Tables Figures
◭ ◮
◭ ◮
Back Close
Full Screen / Esc
Printer-friendly Version Interactive Discussion
Discussion
P
a
per
|
D
iscussion
P
a
per
|
Discussion
P
a
per
|
Discuss
ion
P
a
per
|
database of sea surface dimethylsulfide (DMS) measurements and a procedure to predict sea surface DMS as a function of latitude, longitude and month, Global Biogeochem. Cy., 13, 399–444, doi:10.1029/1999GB900004, 1999. 17092, 17097
Kulmala, M., Lehtinen, K. E. J., and Laaksonen, A.: Cluster activation theory as an explanation of the linear dependence between formation rate of 3 nm particles and sulphuric acid con-5
centration, Atmos. Chem. Phys., 6, 787–793, doi:10.5194/acp-6-787-2006, 2006. 17091, 17092
Korhonen, H., Carslaw, K. S., Spracklen, D. V., Ridley, D. A., and Ström., J.: A global model study of processes controlling aerosol size distributions in the Arctic spring and summer, J. Geophys. Res., 113, D08211, doi:10.1029/2007JD009114, 2008. 17090
10
Leck, C. and Bigg, E. K.: Biogenic particles in the surface micro-layer and overlaying atmo-sphere in the central Arctic Ocean during summer, Tellus B, 57, 305–316, 2005. 17089, 17091
Leck, C. and Bigg, E. K.: A modified aerosol-cloud-climate-feedback hypothesis, Environ. Chem., 4, 400–403, doi:10.1071/EN07061, 2008. 17101
15
Leck, C. and Persson, C.: The central Arctic Ocean as a source of dimethyl sulfide – seasonal variability in relation to biological activity, Tellus B, 48, 156–177, 1996. 17089, 17092, 17097 Leck, C., Nilsson, E. D., Biggs, K., and Bäcklin, L.: The Atmospheric program on the Arctic Ocean Expedition in the summer of 1996 (AOE-96) – a technical overview – outline of exper-imental approach, instruments, scientific objectives, J. Geophys. Res., 106, 32051–32067, 20
2001. 17094
Lee, L. A., Carslaw, K. S., Pringle, K. J., and Mann, G. W.: Mapping the uncertainty in global CCN using emulation, Atmos. Chem. Phys., 12, 9739–9751, doi:10.5194/acp-12-9739-2012, 2012. 17096
Liu, Y. H., Key, J. R., Liu, Z. Y., Wang, X. J., and Vavrus, S. J.: A cloudier Arctic expected with 25
diminishing sea ice, Geophys. Res. Lett., 39, L05705, doi:10.1029/2012GL051251, 2012. 17089
Lohmann, U. and Leck, C.: Importance of submicron surface-active organic aerosols for pristine Arctic clouds, Tellus B, 57, 261–268, 2005. 17091
Mann, G. W., Carslaw, K. S., Spracklen, D. V., Ridley, D. A., Manktelow, P. T., Chipperfield, M. P., 30
ACPD
13, 17087–17121, 2013Response of Arctic CCN to sea-ice
retreat
J. Browse et al.
Title Page
Abstract Introduction
Conclusions References
Tables Figures
◭ ◮
◭ ◮
Back Close
Full Screen / Esc
Printer-friendly Version Interactive Discussion
Discussion
P
a
per
|
D
iscussion
P
a
per
|
Discussion
P
a
per
|
Discuss
ion
P
a
per
Martin, M., Chang, R. Y.-W., Sierau, B., Sjogren, S., Swietlicki, E., Abbatt, J. P. D., Leck, C., and Lohmann, U.: Cloud condensation nuclei closure study on summer arctic aerosol, Atmos. Chem. Phys., 11, 11335–11350, doi:10.5194/acp-11-11335-2011, 2011. 17094
Mauritsen, T., Sedlar, J., Tjernström, M., Leck, C., Martin, M., Shupe, M., Sjogren, S., Sierau, B., Persson, P. O. G., Brooks, I. M., and Swietlicki, E.: An Arctic CCN-limited cloud-aerosol 5
regime, Atmos. Chem. Phys., 11, 165–173, doi:10.5194/acp-11-165-2011, 2011. 17094 Nightingale, P. D., Malin, G., Law, C. S., Watson, A. J., Liss, P. S., Liddicoat, M. I.,
Boutin, J., and Upstill-Goddard, R. C.: In situ evaluation of air-gas exchange parameteri-zations using novel conservative and volatile tracers, Global Biogeochem. Cy., 14, 373–387, doi:10.1029/1999GB900091, 2000. 17092
10
Orellana, M. V., Matrai, P. A., Leck, C., Rauschenberg, C. D., and Lee, A. M.: Marine microgels as a source of cloud condensation nuclei in the high Arctic, P. Natl. Acad. Sci. USA, 108, 13612–13617, 2011. 17089, 17091
Paatero, J., Vaattovaara, P., Vestenius, M., Meinander, O., Makkonen, U., Kivi, R., Hyvärinen, A., Asmi, E., Tjernström, M., and Leck, C.: Finnish contribution to the Arctic summer cloud ocean 15
study (ascos) expedition, arctic ocean 2008, Geophysica, 45, 119–146, 2009. 17094 Quinn, P. K. and Bates, T. S.: The case against climate regulation via oceanic phytoplankton
sulphur emissions, Nature, 480, 51–56, doi:10.1038/nature10580, 2011. 17101
Roberts, G. C. and Nenes, A. A.: A continuous-flow streamwise thermal-gradient CCN chamber for atmospheric measurements, Aerosol Sci. Tech., 39, 206–221, 20
doi:10.1080/027868290913988, 2005. 17094
Shindell, D. T., Chin, M., Dentener, F., Doherty, R. M., Faluvegi, G., Fiore, A. M., Hess, P., Koch, D. M., MacKenzie, I. A., Sanderson, M. G., Schultz, M. G., Schulz, M., Steven-son, D. S., Teich, H., Textor, C., Wild, O., Bergmann, D. J., Bey, I., Bian, H., Cuvelier, C., Dun-can, B. N., Folberth, G., Horowitz, L. W., Jonson, J., Kaminski, J. W., Marmer, E., Park, R., 25
Pringle, K. J., Schroeder, S., Szopa, S., Takemura, T., Zeng, G., Keating, T. J., and Zuber, A.: A multi-model assessment of pollution transport to the Arctic, Atmos. Chem. Phys., 8, 5353– 5372, doi:10.5194/acp-8-5353-2008, 2008. 17090
Struthers, H., Ekman, A. M. L,.Glantz, P., Iversen, T., Kirkevag, A., Martensson, E. M., Se-land, O., and Nilsson, E. D.: The effect of sea ice loss on sea salt aerosol concentrations and 30
ACPD
13, 17087–17121, 2013Response of Arctic CCN to sea-ice
retreat
J. Browse et al.
Title Page
Abstract Introduction
Conclusions References
Tables Figures
◭ ◮
◭ ◮
Back Close
Full Screen / Esc
Printer-friendly Version Interactive Discussion
Discussion
P
a
per
|
D
iscussion
P
a
per
|
Discussion
P
a
per
|
Discuss
ion
P
a
per
|
Spracklen, D. V., Pringle, K. J., Carslaw, K. S., Chipperfield, M. P., and Mann, G. W.: A global off-line model of size-resolved aerosol microphysics: I. Model development and prediction of aerosol properties, Atmos. Chem. Phys., 5, 2227–2252, doi:10.5194/acp-5-2227-2005, 2005. 17092
Tjernström, M., Birch, C. E., Brooks, I. M., Shupe, M. D., Persson, P. O. G., Sedlar, J., Maurit-5
sen, T., Leck, C., Paatero, J., Szczodrak, M., and Wheeler, C. R.: Meteorological conditions in the central Arctic summer during the Arctic Summer Cloud Ocean Study (ASCOS), Atmos. Chem. Phys., 12, 6863–6889, doi:10.5194/acp-12-6863-2012, 2012. 17091
Tjernström, M., Leck, C., Birch, C. E., Brooks, B. J., Brooks, I. M., Bäcklin, L., Chang, R. Y.-W., Granath, E., Graus, M., Hansel, A., Heintzenberg, J., Held, A., Hind, A., de la Rosa, S., 10
Johnston, P., Knulst, J., de Leeuw, G., Di Liberto, L., Martin, M., Matrai, P. A., Maurit-sen, T., Müller, M., Norris, S. J., Orellana, M. V., Orsini, D. A., Paatero, J., Persson, P. O. G., Gao, Q., Rauschenberg, C., Ristovski, Z., Sedlar, J., Shupe, M. D., Sierau, B., Sire-vaag, A., Sjogren, S., Stetzer, O., Swietlicki, E., Szczodrak, M., Vaattovaara, P., Wahlberg, N., Westberg, M., and Wheeler, C. R.: The Arctic Summer Cloud-Ocean Study (ASCOS): 15
overview and experimental design, Atmos. Chem. Phys. Discuss., 13, 13541–13652, doi:10.5194/acpd-13-13541-2013, 2013. 17094
van der Werf, G. R., Randerson, J. T., Giglio, L., Collatz, G. J., Mu, M., Kasibhatla, P. S., Mor-ton, D. C., DeFries, R. S., Jin, Y., and van Leeuwen, T. T.: Global fire emissions and the contribution of deforestation, savanna, forest, agricultural, and peat fires (1997–2009), At-20
mos. Chem. Phys., 10, 11707–11735, doi:10.5194/acp-10-11707-2010, 2010. 17091 Vavrus, S., Bhatt, U. S., and Alexeev., V. A.: Factors influencing simulated changes in future
Arctic cloudiness, J. Climate, 24, 4817–4830, doi:10.1175/2011JCLI4029.1, 2011. 17104 Voulgarakis, A., Yang, X., and Pyle., J. A.: How different would tropospheric oxidation be over an
ice-free Arctic?, Geophys. Res. Lett., 36, L23807, doi:10.1029/2009GL040541, 2009. 17102, 25
17103
Wassmann, P. and Reigstad, M.: Future Arctic Ocean seasonal ice zones and implications for pelagic-benthic coupling, Oceanography, 24, 220–231, 2011. 17097
Woodhouse, M. T., Carslaw, K. S., Mann, G. W., Vallina, S. M., Vogt, M., Halloran, P. R., and Boucher, O.: Low sensitivity of cloud condensation nuclei to changes in the sea-air flux 30
ACPD
13, 17087–17121, 2013Response of Arctic CCN to sea-ice
retreat
J. Browse et al.
Title Page
Abstract Introduction
Conclusions References
Tables Figures
◭ ◮
◭ ◮
Back Close
Full Screen / Esc
Printer-friendly Version Interactive Discussion
Discussion
P
a
per
|
D
iscussion
P
a
per
|
Discussion
P
a
per
|
Discuss
ion
P
a
per
|
Table 1.Summary of sea-ice conditions controlling primary emissions (the present day sea-ice [PD] and no sea ice [no-ice]) and microphysical processes included in model simulations.
DMS ems Sea-Salt ems MOC ems stratocumulus BL PD no-ice PD no-ice PD no-ice scavenging nucleation
PD X X X X
PD-MOC X X X X X
PD-noBLN X X X
PD-nodrizz X X X
no-ice X X X X
no-ice [SS] X X X X
no-ice [DMS] X X X X
MOC-no-ice X X X X X
ACPD
13, 17087–17121, 2013Response of Arctic CCN to sea-ice
retreat
J. Browse et al.
Title Page
Abstract Introduction
Conclusions References
Tables Figures
◭ ◮
◭ ◮
Back Close
Full Screen / Esc
Printer-friendly Version Interactive Discussion
Discussion
P
a
per
|
D
iscussion
P
a
per
|
Discussion
P
a
per
|
Discuss
ion
P
a
per
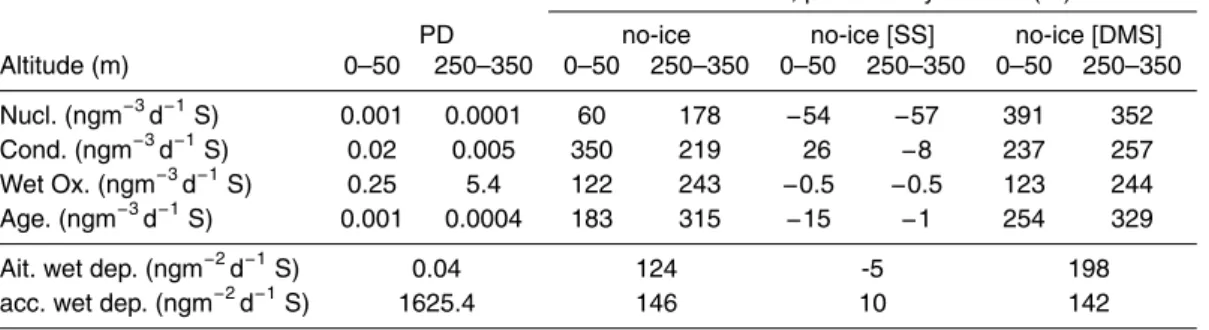
Table 2.Percentage change in: nucleation (Nucl.), condensation (Cond.), aqueous phase ox-idation (Wet Ox.), ageing (Age) and accumulation (acc. wet dep.) and Aitken mode (Ait. wet dep.) wet deposition mass flux between simulations. Also shown is the absolute value of each metric in the present day (PD) run (column 1). Average is taken over grid-boxes where the CCN change between PD and no-ice simulations is less than−10 % at the surface (sfc) and
∼900 hPa (250–350 m) as shown in Fig. 5 (blue). Note: the same grid-boxes are used for all
runs, although the CCN change between PD and no-ice [SS] is never less than 10 %. However data from this run is included for comparison.
∆from PD, present day sea-ice (%)
PD no-ice no-ice [SS] no-ice [DMS]
Altitude (m) 0–50 250–350 0–50 250–350 0–50 250–350 0–50 250–350
Nucl. (ngm−3
d−1
S) 0.001 0.0001 60 178 −54 −57 391 352
Cond. (ngm−3
d−1
S) 0.02 0.005 350 219 26 −8 237 257
Wet Ox. (ngm−3
d−1
S) 0.25 5.4 122 243 −0.5 −0.5 123 244
Age. (ngm−3d−1S) 0.001 0.0004 183 315
−15 −1 254 329
Ait. wet dep. (ngm−2d−1S) 0.04 124 -5 198
ACPD
13, 17087–17121, 2013Response of Arctic CCN to sea-ice
retreat
J. Browse et al.
Title Page
Abstract Introduction
Conclusions References
Tables Figures
◭ ◮
◭ ◮
Back Close
Full Screen / Esc
Printer-friendly Version Interactive Discussion
Discussion
P
a
per
|
D
iscussion
P
a
per
|
Discussion
P
a
per
|
Discuss
ion
P
a
per
|
µg mˉ² d ˉ¹ S
0 2 4 6 8 10 20 40 60 80
(a) DMS emissions
0 200 400 600 800 1000 2000 4000 6000 8000
µg mˉ² d ˉ¹ NaCl
(b) Sea-Salt emissions
ACPD
13, 17087–17121, 2013Response of Arctic CCN to sea-ice
retreat
J. Browse et al.
Title Page
Abstract Introduction
Conclusions References
Tables Figures
◭ ◮
◭ ◮
Back Close
Full Screen / Esc
Printer-friendly Version Interactive Discussion
Discussion
P
a
per
|
D
iscussion
P
a
per
|
Discussion
P
a
per
|
Discuss
ion
P
a
per
August 12 - September 1 (Ice-drift)
Observed median (ASCOS 08)
PD
PD-noDRIZZ PD-noBLN
PD-MOC
Diameter (nm)
dNdlog(Dp) cm
ˉ³
10 100 1000
0 100 200 300 400 500
interquartile range (observations)
(a)
Surface (0-50nm) CCN
CCN concentration (cmˉ³)
1 10 100
0.0 0.2 0.4 0.6 0.8 1.0
Normalized frequency
ASCOS CCN pdf
(b)
Fig. 2. (a)Median size distribution from the ASCOS ice-drift period compared to the median size distribution in the PD (red), PD-noBLN (purple), PD-noDRIZZ (blue) and PD-MOC (green) simulations. In all cases the lognormal size distribution was calculated over the diameter range 3–800 nm to match the size limitations of the DMPS instrument.(b)Probability density function (pdf) of CCN concentration per cm−3
ACPD
13, 17087–17121, 2013Response of Arctic CCN to sea-ice
retreat
J. Browse et al.
Title Page
Abstract Introduction
Conclusions References
Tables Figures
◭ ◮
◭ ◮
Back Close
Full Screen / Esc
Printer-friendly Version Interactive Discussion
Discussion
P
a
per
|
D
iscussion
P
a
per
|
Discussion
P
a
per
|
Discuss
ion
P
a
per
|
ΔSEA-SPRAY Δ[SEA-SPRAY + DMS] Δ[SS + DMS + MOC]
Change in surface (0-50m) CCN number (DCCN>70nm)
Change in surface (0-50m) accumulation and coarse mode particle number
Change in surface (0-50m) N number (Dp>3nm)3
% ΔDMS
-60 -50 -40 -30 -20 -10 0 10 20 30 40 50 60
ACPD
13, 17087–17121, 2013Response of Arctic CCN to sea-ice
retreat
J. Browse et al.
Title Page
Abstract Introduction
Conclusions References
Tables Figures
◭ ◮
◭ ◮
Back Close
Full Screen / Esc
Printer-friendly Version Interactive Discussion
Discussion
P
a
per
|
D
iscussion
P
a
per
|
Discussion
P
a
per
|
Discuss
ion
P
a
per
Change in surface (0-50m) CCN number (RCCN>35nm)
Change in surface (0-50m) accumulation and coarse mode particle number
Change in surface (0-50m) N number (Dp>3nm)3
ΔSEA-SPRAY ΔDMS Δ[SEA-SPRAY + DMS] Δ[SS+ DMS + MOC]
%
-60 -50 -40 -30 -20 -10 0 10 20 30 40 50 60
ACPD
13, 17087–17121, 2013Response of Arctic CCN to sea-ice
retreat
J. Browse et al.
Title Page
Abstract Introduction
Conclusions References
Tables Figures
◭ ◮
◭ ◮
Back Close
Full Screen / Esc
Printer-friendly Version Interactive Discussion
Discussion
P
a
per
|
D
iscussion
P
a
per
|
Discussion
P
a
per
|
Discuss
ion
P
a
per
|
0ºE
90ºE 180ºE
270ºE
45ºE 135ºE 225ºE
315ºE
(a) Surface (0-50m)
0ºE
90ºE 180ºE
270ºE
45ºE 135ºE 225ºE
315ºE
(b)∼900 hPa (250-350m)
0ºE
90ºE 180ºE
270ºE
45ºE 135ºE 225ºE
315ºE
(c)∼800 hPa (400-500m)
ACPD
13, 17087–17121, 2013Response of Arctic CCN to sea-ice
retreat
J. Browse et al.
Title Page
Abstract Introduction
Conclusions References
Tables Figures
◭ ◮
◭ ◮
Back Close
Full Screen / Esc
Printer-friendly Version Interactive Discussion
Discussion
P
a
per
|
D
iscussion
P
a
per
|
Discussion
P
a
per
|
Discuss
ion
P
a
per
0-50m ΔCCN < -10%
PD no-ice no-ice[SS] no-ice[DMS] MOC no-ice-MOC
1000
100
10
dN/dlog(Dp) cm
ˉ³
1 10 100 1000 Diameter (nm)
(a) Surface CCN decrease
0-50m ΔCCN > 10%
1000
100
10
dN/dlog(Dp) cm
ˉ³
1 10 100 1000 Diameter (nm)
(b) Surface CCN increase
250-350m ΔCCN < -10%
1000
100
10
dN/dlog(Dp) cm
ˉ³
1 10 100 1000 Diameter (nm) (c)∼900hPa CCN decrease
250-350m ΔCCN > 10%
1000
100
10
dN/dlog(Dp) cm
ˉ³
1 10 100 1000 Diameter (nm)
(d)∼900hPa CCN increase
![Table 1. Summary of sea-ice conditions controlling primary emissions (the present day sea-ice [PD] and no sea ice [no-ice]) and microphysical processes included in model simulations.](https://thumb-eu.123doks.com/thumbv2/123dok_br/18353803.353353/25.918.51.696.178.538/summary-conditions-controlling-emissions-microphysical-processes-included-simulations.webp)