Association between Lipid Ratios and Insulin
Resistance in a Chinese Population
Liying Zhang1,2, Shanying Chen1,3, Aiwen Deng4, Xinyu Liu1, Yan Liang1, Xiaofei Shao1, Mingxia Sun1, Hequn Zou1*
1Department of Nephrology, Third Affiliated Hospital of Southern Medical University, Guangzhou, Guangdong, China,2Department of Nephrology, First Affiliated Hospital of Inner Mongolia Medical University, Huhehaote, China,3Department of Nephrology, Zhangzhou Affiliated Hospital of Fujian Medical University, Zhangzhou, Fujian, China,4Department of Rehabilitation, Third Affiliated Hospital of Southern Medical University, Guangzhou, Guangdong, China
*hequnzou@hotmail.com
Abstract
Aim
To explore the association of lipid ratios and triglyceride (TG) with insulin resistance (IR) in a Chinese population. We also provide the clinical utility of lipid ratios to identify men and women with IR.
Methods
This cross-sectional study included 614 men and 1055 women without diabetes. Insulin re-sistance was defined by homeostatic model assessment of IR>2.69. Lipid ratios included
the TG/ high density lipoprotein cholesterol (HDL-C), the total cholesterol (TC)/HDL-C and the low density lipoprotein cholesterol (LDL-C)/HDL–C. Logistic regression models and ac-curate estimates of the area under the receiver operating characteristic (AUROC) curves were obtained.
Results
In normal-weight men, none of lipid ratios nor TG was associated with IR. In overweight/ obese men, normal-weight women and overweight/obese women, the TG/HDL-C, the TC/HDL-C and TG were significantly associated with IR, and the associations were inde-pendent of waist circumference. All of the AUROCs for the TG/HDL-C and TG were>0.7.
The AUROCs for TC/HDL-C ratio were 0.69–0.77. The optimal cut-offs for TG/HDL-C were 1.51 in men and 0.84 in women. The optimal cut-offs for TG were 1.78 mmol/L in men and 1.49 mmol/L in women, respectively. In men, the optimal cut-off for LDL-C/HDL-C is 3.80. In women, the optimal cut-off for LDL-C/HDL-C is 3.82.
Conclusion
The TG/HDL-C, the TC/HDL-C and TG are associated with IR in overweight/obese men, normal-weight and overweight/obese women. The LDL-C/HDL-C is only associated with IR OPEN ACCESS
Citation:Zhang L, Chen S, Deng A, Liu X, Liang Y, Shao X, et al. (2015) Association between Lipid Ra-tios and Insulin Resistance in a Chinese Population. PLoS ONE 10(1): e0116110. doi:10.1371/journal. pone.0116110
Academic Editor:Marie Thearle, NIH / NIDDK, UNITED STATES
Received:May 20, 2014
Accepted:December 3, 2014
Published:January 30, 2015
Copyright:© 2015 Zhang et al. This is an open ac-cess article distributed under the terms of the
Creative Commons Attribution License, which permits unrestricted use, distribution, and reproduction in any medium, provided the original author and source are credited.
Data Availability Statement:All relevant data are within the paper.
Funding:This study was supported by the following Science Foundations: 1. EU FP7 Program, UroSense, 2011; 2. ISN Research Committee grant, 2007; 3. ISN Research Committee grant, 2004; 4. Guangdong Provincial Science and Technique Pro-gram (No. 2011B031800386), 2011. The funders had no role in study design, data collection and analysis, decision to publish, or preparation of the manuscript.
in normal-weight women. The TG/HDL-C and TG might be used as surrogate markers for assessing IR.
Introduction
Insulin resistance (IR) is a major risk of type 2 diabetes and cardiovascular diseases [1]. The gold standard method to detect IR, the hyperinsulinemiceuglycemic clamp, is impractical in clinical practice [2]. Previous studies have reported the triglyceride/high density lipoprotein cholesterol (TG/HDL-C) ratio is a surrogate marker of IR [3–9]. This might be a simple and re-liable method to assess IR. However, the association of the TG/HDL-C ratio with IR might be ethnicity-dependant [6,8,10]. The association of the TG/HDL-C ratio with IR is demonstrated in Caucasian individuals [3–8]. One previous study based on African Americans did not sup-port using TG or the TG/HDL-C ratio as an appropriate surrogate marker of IR [6]. Another study also indicated that the TG/HDL-C ratio was not associated with IR in South Asian women [8]. Limited studies indicated that the TG/HDL-C ratio might be a surrogate marker of IR in Chinese population [9,10,11]. In these two studies, the sample sizes were relatively small and one study was limited to non-obese women [10,11]. In another study based on 812 Chi-nese subjects, it was indicated that using the TG/HDL-C ratio can significantly enhance the di-agnostic accuracy of IR defined by homeostatic model assessment of insulin resistance (HOMA-IR) [9]. Therefore, using the TG/HDL-C ratio as a surrogate marker of IR has not been widely described in Chinese population. Lipid ratios can also be used to assess the risk of cardiovascular diseases and chronic kidney disease [12,13,14].
Apart from the TG/HDL-C ratio, other lipid ratios or TG might also be used to predict IR. One study indicated that the low density lipoprotein cholesterol (LDL-C)/HDL-C ratio might be the best reliable marker of IR in non-obese Japanese adults [15]. TG has been reported to be an alternative surrogate for IR [6]. Our previous study also indicated that serum TG is a suit-able predictor for CKD in men [14].
The aim of the present study is to explore the associations of lipid ratios and TG with IR in a Chinese population. We also provide the clinical utility of lipid ratios to identify men and women with IR.
Methods
Study population
All of data were drawn from a population-based, cross-sectional survey in Southern China. We have described the epidemiology study elsewhere [16]. The study was conducted between June, 2012, and Oct, 2012, on Wanzhai Town, Zhuhai City. 1843 subjects had complete data. In the present analysis, we excluded subjects with diabetes. Diabetes was defined as having a history of diabetes or fasting glucose7.0mmol/Lor 2-hour postprandial blood glu-cose11.1mmol/L [17]. 115 Subjects having history of diabetes and 36 subjects with fasting blood glucose7.0mmol/L were excluded. All subjects with fasting glucose>5.6 mmol/L
This study has been approved by the ethics committee of the Third Affiliated Hospital of Southern Medical University. Written informed consents were obtained. All of the work has been carried out in accordance with the Declaration of Helsinki.
Assessment of IR
We used HOMA-IR to assess IR. Homeostatic model assessment of insulin resistance was calcu-lated as the following formula: fasting plasma glucose (mmlo/L) × fasting insulin (IU/L)/22.5 [18]. Using blood samples collected after a minimum 10 hour fasting, fasting glucose was mea-sured by calorimetric methods, and fasting insulin was meamea-sured using electrochemiluminescence immunoassays [16]. Based on an epidemiology survey in China, IR was defined as HOMA-IR>
2.69 (exceeding the 75% percentile of HOMA-IR in normal glucose tolerance subjects) [19].
Serum Lipid Profiles
Fasting serum lipids were determined using blood specimens after an overnight fasting for at least 10 hours. Using calorimetric methods with the Roche assay (Roche cobas6000), serum total cholesterol (TC), serum TG, and serum HDL- C were determined [14]. Low density lipo-protein cholesterol was indirectly calculated using the Friedewald Equation [20]. We calculated three lipid ratios: the TG/HDL ratio, the TC/HDL ratio and the LDL/HDL ratio.
Confounders
Information on age, sex, education attainment, personal and family health history and lifestyle habits was obtained by questionnaires [16]. According to years of schooling, we divided education status into two categories: (1) high senior school or above (2) 0 years of schooling to junior middle school. Physical inactivity was defined as less than one hour of moderately intense activity per week. We used a calibrated mercury sphygmomanometer to determine blood pressures in the right arm of subjects after a rest period of 5 minutes. Blood pressure was measured three times and the average of the three consecutively measurement was calculated [16].
Anthropometric measurements including height, weight, and waist circumference were measured by the World Health Organization recommended protocols [21]. Waist circumfer-ence was accurate to 0.1cm and weight was accurate to 0.1 kg. Body mass index (BMI) was calculated as weight (in kilograms) divided by the square of the height (in meters).
Data analysis
All statistical analyses were performed using Stata (version 11). One previous study indicated that the association of the TG/HDL-C ratio with IR might be sex-dependant [8]. Body fat accumulates differently in men and women, and we also use different waist circumference cut-offs for men and women in clinical practice [22]. The cut-offs for the TG/HDL-C ratio also differ in men and women [23]. In the present study, all statistical analyses were run in men and women separately. Descriptive statistics for continuous variables were presented as mean
standard deviation if variables were normally distributed or as median and interquartile range if variables were skewed distributed. Frequencies and percentages were used to express categorical variables. A p-value of<0.05 was considered significance.
women [11]. In the present study, we divided both men and women into two different BMI cat-egories: a normal-weight subgroup and an overweight/obese subgroup. Based on a previous meta-analysis, the optimal cut-off for BMI is 24 kg/m2in Chinese population [22]. Clinical characteristics of subjects in different BMI categories were presented and compared using Stu-dent t test or rank-sum test for continuous variables and the chi-squared test or Fisher’s exact test for categorical variables.
To explore whether lipid ratios and TG are associated with IR in Chinese individuals, logis-tic regression models were used and odds ratios (ORs) and 95% confidence interval (CI) were calculated. Lipid ratios and TG were used as an independent variable, respectively. Insulin re-sistance was defined as HOMA-IR>2.69 and insulin sensitivity was defined if HOMA-IR<
or = 2.69 [19]. In the adjusted models, potential confounders were added. These confounders included socio-demographic status (age and educational attainment), lifestyle factors (current smoking, current alcohol use, and physical inactivity), waist circumference, systolic blood pres-sure and diastolic blood prespres-sure. The prior study indicated waist circumference is associated with IR even in normal-weight individuals [25], so waist circumference was also added as a covariate.
We used HOMA-IR as a continuous variable to examine the correlations of HOMA-IR with the lipid ratios and TG. The models were adjusted for age, educational attainment, current smoking, current alcohol use, physical inactivity, waist circumference, systolic blood pressure and diastolic blood pressure. All variables with a skewed distribution including HOMA-IR, TG, the TG/HDL-C ratio, the TC/HDL-C ratio and the LDL-C/HDL-C ratio were logarithmi-cally transformed in the regression models.
We also run the full models to explore the associations of TG/HDL-C ratio with IR in the whole population. Next, sexTG/HDL-C ratio and BMI categoryTG/HDL-C ratio were
added into the adjusted models, respectively. The p-values for the interaction terms of sex
TG/HDL-C ratio and BMI categoryTG/HDL-C ratio in the full models of IR were explored.
Accurate estimates of the area under the receiver operating characteristic (AUROC) curve analysis was conducted by using the TG/HDL-C ratio, the TC/HDL-C ratio, the LDL-C/HDL-C ratio, and TG as continuous variables in the logistic regression models. Accurate estimates of AUROC were obtained. Insulin resistance is mostly caused by abdominal obesity and waist cir-cumference is used as an alternative method to assess IR [6,26]. So in the present study, the AUROC of waist circumference is assigned as a standard AUROC. The AUROCs were also ad-justed for covariates used in the logistic models. Based on the AUROCs, the diagnostic value of lipid ratios and TG were assessed: an AUROC of 0.5 was considered as no discrimination, an AUROC between 0.7 and 0.8 was considered as acceptable, an AUROC between 0.7 and 0.8 was considered as excellent, and an AUROC0.9 was considered as outstanding [27]. We also
used another anthropometric index, BMI, as a continuous variable in the logistic regression models to examine whether BMI is a better predictor of IR than waist circumference and the lipid ratios.
Youden’s index was calculated as (specificity + sensitivity−1) and used to select the optimal
cut-offs for each lipid ratio and TG.
Results
Clinical characteristics of three subgroups in different CRP categories
(
Table 1
)
overweight/obese subjects had significantly higher levels of lipid ratios and TG. Overweight/ obese subjects also had higher blood pressures and higher levels of fasting glucose, and the differences were significant.
Associations of lipid ratios and TG with IR defined by HOMA-IR in
different BMI categories (
Table 2
)
The association of the TG/HDL-C ratio and IR was first explored in the whole population. Next, sexTG/HDL-C ratio and BMI categoryTG/HDL-C ratio were added into the adjusted
models, respectively. The interaction term of sexTG/HDL-C ratio is 0.1 in the full model of insulin resistance and that of BMI categoryTG/HDL-C ratio is<0.001.
In normal-weight men, none of lipid ratios nor serum TG was associated with IR in the ad-justed models. In overweight/obese men, the TG/HDL-C ratio, the TC/HDL-C ratio and TG were significant associated with IR, and the associations were independent of waist circumfer-ence and other potential confounders. The OR was 1.80 (95% CI 1.28–2.53, P = 0.001) for one unit increase in the TG/HDL-C ratio, 1.67 (95% CI 1.11–2.53, P = 0.01) for one unit increase in the TG/HDL-C ratio, or 1.36 (95% CI 1.06–1.75, P = 0.02) for one mmol/L increase in TG, respectively.
In normal-weight women, all of lipid ratios and TG were significantly associated with IR and the associations were independent of other confounders. Every unit increase in the TG/HDL-C ratio was associated with OR 3.17 (95% CI 2.07–4.86, P<0.001). Every unit
Table 1. Characteristicsaof men and women by different BMI categories.
Men Women
Normal-weight Overweight/obesity P value Normal-weight Overweight/obesity P value
n = 343 n = 271 n = 685 n = 370
Age (years) 52.616.1 52.213.2 0.75 49.815.1 54.912.0 <0.001
Body Mass Index (kg/m2) 21.42.0 25.82.3 <0.001 20.92.0 26.52.3 <0.001
Waist circumference(cm) 80.37.4 93.26.7 <0.001 76.07.3 88.57.9 <0.001
Current smoker (%) 112 (32.65) 87 (32.10) 0.91 9 (1.31) 0 0.03
Current alcohol use (%) 46 (13.41) 37 (13.65) 0.93 7 (1.02) 4 (1.08) 1
Education attainment High school or above (%) 182 (53.06) 131 (48.34) 0.25 281 (41.02) 113 (30.54) 0.001
Physical inactivity (%) 176 (51.31) 166 (61.25) 0.02 403 (58.83) 201 (54.32) 0.16
Systolic blood pressure (mm Hg) 127.119.9 133.417.2 <0.001 122.319.1 133.420.7 <0.001 Diastolic blood pressure (mmHg) 77.310.9 82.29.9 <0.001 74.510.6 80.910.7 <0.001 Fasting glucose (mmo/l) 4.700.50 4. 910.64 <0.001 4.650.44 4.900.56 <0.001 Fasting insulin (uU/mL) 6.38 (4.48–8.88) 11.43 (7.67–16.58) <0.001 7.14 (5.17–9.64) 10.64 (7.98–15.27) <0.001 HOMA–IR (uU/ml .mmol/mL) 1.37 (0.91–1.87) 2.50 (1.64–3.65) <0.001 1.47 (1.08–2.09) 2.30 (1.70–3.33) <0.001 Serum Triglyceride (mmol/L) 1.14 (0.83–1.63) 1.78 (1.17–2.41) <0.001 1.00 (0.75–1.39) 1.38 (0.99–1.94) <0.001
LDL (mmol/L) 3.100.92 3.200.90 0.22 3.080.87 3.380.90 <0.001
HDL (mmol/L) 1.510.33 1.350.26 <0.001 1.640.33 1.510.27 <0.001
TG/HDL-C ratio 0.79 (0.53–1.21) 1.35(0.87–1.95) <0.001 0.61 (0.42–0.96) 0.91(0.63–1.38) <0.001 TC/HDL-C ratio 3.56 (2.97–4.10) 4.14(3.63–4.55) <0.001 3.21 (2.74–3.75) 3.78(3.27–4.76) <0.001 LDL/HDL-C ratio 2.09 (1.66–2.52) 2.37(1.99–2.86) <0.001 1.88 (1.49–2.30) 2.22(1.85–2.64) <0.001
a
MeanSD or median (25th to 75th percentiles) for continuous variables and absolute and relative (%) values for category variables are presented. HOMA-IR: Homeostatic model assessment of insulin resistance; TC: total cholesterol; TG: triglyceride; HDL-C: high density lipoprotein cholesterol; LDL-C: low density lipoprotein cholesterol;
Analyses were used to explore the differences in study characteristics between normal and overweight subjects within each sex
increase in the TC/HDL-C ratio was associated with OR 1.67 (95% CI 1.20, 2.32, P = 0.001). Every unit increase in the LDL-C/HDL-C ratio was associated with OR 1.55 (95% CI 1.01, 2.38, P = 0.046). One mmol/L increase in TG was associated with OR 2.62 (95% CI 1.84, 3.73, P<0.001).
In overweight/obese women, the TG/HDL-C ratio, the TC/HDL-C ratio, and TG were associated with IR. The OR for the TG/HDL-C ratio (every unit increase) was 2.85 (95% CI 1.89–4.31, P<0.001). The OR for the TC/HDL-C ratio (every unit increase) was 2.01 (95%
CI 1.41–2.97,<0.001). The OR for TG (each mmol/l increase) was 2.02 (95% CI 1.47–2.76,
P<0.001), respectively.
When HOMA-IR was used as a continuous variable in the adjusted regression models, TG, the TG/HDL-C ratio and the TC/HDL-C ratio were significantly association with HOMA-IR in both the normal-weight or overweight/obese men and women (P<0.05). The Pearson
cor-relation coefficient between TG and HOMA-IR was 0.32–0.37. The Pearson correlation coeffi-cient between the TG/HDL-C ratio and HOMA-IR was 0.33–0.41. The Pearson correlation coefficient between the TC/HDL-C ratio and HOMA-IR was 0.24–0.33. The LDL-C/HDL-C ratio was only associated with HOMA-IR in normal-weight women (The Pearson correlation coefficient was 0.07–0.22).
Comparison of AUROCs for potential markers of IR in different BMI
categories by sex (
Table 3
)
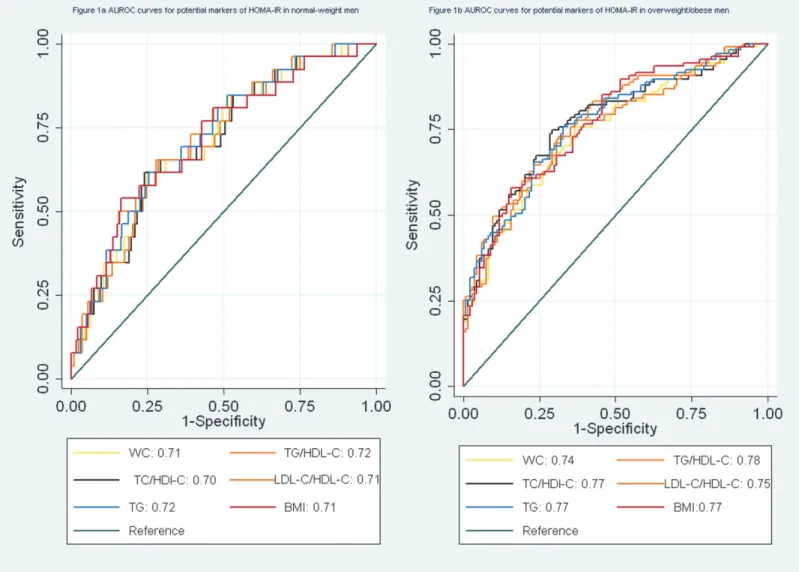
In logistic regression models, waist circumference was associated with IR in normal-weight men (not shown in the table). The AUROC for waist circumference was 0.71 (95% CI 0.61–
0.81) (Fig. 1A). In overweight/obese men, the AUROC curve analyses showed that the TG/ HDL ratio, the TC/HDL-C ratio and serum TG were acceptable predictors for IR defined by HOMA-IR (the AUROC>0.7) (Fig. 1B).
In normal-weight women, waist circumference, the TG/HDL-C ratio, the TC/HDL-C ratio, the LDL-C/HDL-C ratio and TG were suitable predictors for IR. Among four variables, the TG/HDL-C ratio and TG were better predictors for IR than waist circumference and the TC/ HDL-C ratio. The TG/HDL-C ratio and TG had significantly higher AUROCs than waist cir-cumference (P<0.05) (Fig. 2A). In overweight/obese women, TG and the TG/HDL-C ratio
were acceptable predictors for IR (the AUROC>0.70). The AUROCs for waist circumference
and the LDL-C/HDL-C ratio were significantly lower (0.6<AUROC<0.7) (Fig. 2B).
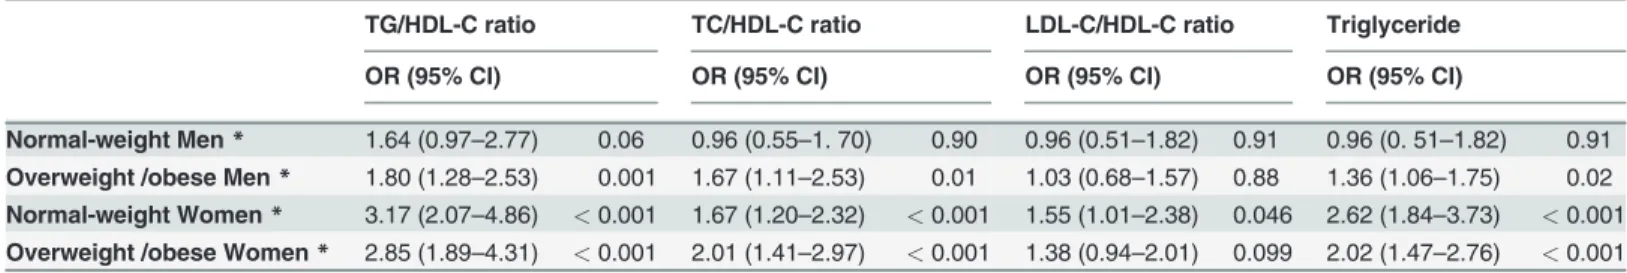
Table 2. Associationsaof lipid profiles and triglycerides with insulin resistance in men and women categorized by BMI phenotype.
TG/HDL-C ratio TC/HDL-C ratio LDL-C/HDL-C ratio Triglyceride
OR (95% CI) OR (95% CI) OR (95% CI) OR (95% CI)
Normal-weight Men* 1.64 (0.97–2.77) 0.06 0.96 (0.55–1. 70) 0.90 0.96 (0.51–1.82) 0.91 0.96 (0. 51–1.82) 0.91
Overweight /obese Men* 1.80 (1.28–2.53) 0.001 1.67 (1.11–2.53) 0.01 1.03 (0.68–1.57) 0.88 1.36 (1.06–1.75) 0.02
Normal-weight Women* 3.17 (2.07–4.86) <0.001 1.67 (1.20–2.32) <0.001 1.55 (1.01–2.38) 0.046 2.62 (1.84–3.73) <0.001
Overweight /obese Women* 2.85 (1.89–4.31) <0.001 2.01 (1.41–2.97) <0.001 1.38 (0.94–2.01) 0.099 2.02 (1.47–2.76) <0.001
aTC: total cholesterol; TG: triglyceride; HDL-C: high density lipoprotein cholesterol; LDL-C: low density lipoprotein cholesterol
*Adjusted for age, current smoker, current alcohol use, physical inactivity, education attainment, blood pressure and waist circumference The TG/HDL-C ratio, the TC/HDL-C ratio and TG were associated with IR in overweight/obese men and both normal-weight and overweight/obese women. The LDL-C/HDL-C ratio was associated with IR in normal—weight women. In normal-weight men, none of lipid ratios nor TG was associated with IR.
BMI was also a suitable predictor for IR in men and normal-weight women (the AUROC>
0.7), but it was not better than waist circumference, TG and the TG/HDL-C ratio (Table 3).
Optimal cut-offs for lipid ratios and TG in male and female subjects
(
Table 4
)
The optimal cut-offs for lipid ratios and TG are listed inTable 4. The cut-offs for TG/HDL-C ratio were 1.51 in men and 0.84 in women. The cut-offs for TG were 1.78 in men and 1.49 in women, respectively. In men, the optimal cut-off for LDL-C/HDL-C ratio was 3.80. In women, the optimal cut-off for LDL-C/HDL-C ratio was 3.82.
The cut-offs for waist circumference were 87 cm in men and 81 cm in women. Men and women had different cut-offs for BMI (25.15 kg/m2in men and 23.44 kg/m2in women).
Discussion
The results of the present study indicated that the TG/HDL-C ratio, the TC/HDL-C ratio and TG were associated with IR in overweight/obese men, normal-weight women and overweight/ obese women. Both of the AUROCs for the TG/HDL-C, and TG were>0.7. The AUROCs for
TC/HDL-C ratio were 0.69–0.77. The LDL-C/HDL-C ratio might not be associated with IR in both men and overweight women. In normal-weight men, none of lipid ratios nor TG was as-sociated with IR.
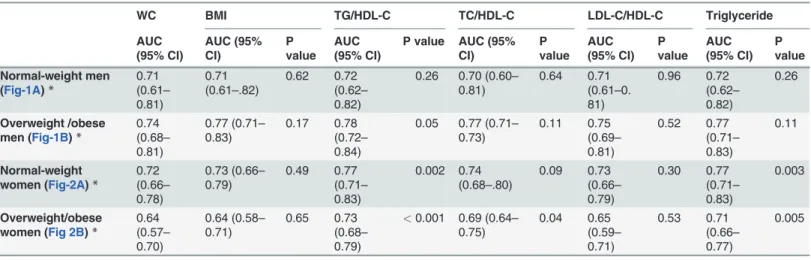
Both elevated TG and low HDL-C are components of metabolic syndrome [23]. In 1997, it was reported by Gaziano et al [28] that the TG/HDL-C ratio was a strong predictor of myocar-dial infarction. In 2003, McLaughlin et al reported that serum TG and the TG/HDL-C ratio were the most useful metabolic markers in predicting IR [3]. In this study, TG or the TG/HDL-C ratio was recommended as the most practical approach to identify IR in overweight individu-als [3]. Using the level of the TG/HDL-C ratio (3.5) might be a simple method to identify in-sulin-resistant, dyslipidemia patients [4]. The results of one study based on 770 non-Hispanic whites, 243 non-Hispanic blacks, and 346 Mexican Americans also supported using the TG/HDL-C ratio as a simple and useful predictor for hyperinsulinemia among non-diabetic Table 3. Area under the receiver operating characteristic curvesafor potential markers of HOMA-IR.
WC BMI TG/HDL-C TC/HDL-C LDL-C/HDL-C Triglyceride
AUC (95% CI) AUC (95% CI) P value AUC (95% CI)
P value AUC (95% CI) P value AUC (95% CI) P value AUC (95% CI) P value Normal-weight men (Fig-1A)*
0.71 (0.61– 0.81)
0.71 (0.61–.82)
0.62 0.72 (0.62– 0.82)
0.26 0.70 (0.60– 0.81)
0.64 0.71 (0.61–0. 81) 0.96 0.72 (0.62– 0.82) 0.26 Overweight /obese men (Fig-1B)*
0.74 (0.68– 0.81)
0.77 (0.71– 0.83)
0.17 0.78 (0.72– 0.84)
0.05 0.77 (0.71– 0.73) 0.11 0.75 (0.69– 0.81) 0.52 0.77 (0.71– 0.83) 0.11 Normal-weight women (Fig-2A)*
0.72 (0.66– 0.78)
0.73 (0.66– 0.79) 0.49 0.77 (0.71– 0.83) 0.002 0.74 (0.68–.80) 0.09 0.73 (0.66– 0.79) 0.30 0.77 (0.71– 0.83) 0.003 Overweight/obese women (Fig 2B)*
0.64 (0.57– 0.70) 0.64 (0.58– 0.71) 0.65 0.73 (0.68– 0.79)
<0.001 0.69 (0.64– 0.75) 0.04 0.65 (0.59– 0.71) 0.53 0.71 (0.66– 0.77) 0.005
*Adjusted for age, current smoker, current alcohol use, physical inactivity, education attainment, blood pressure, and waist circumference
aWC: waist circumference; BMI body mass index; TC: total cholesterol; TG: triglyceride; HDL-C: high density lipoprotein cholesterol; LDL-C: low density
lipoprotein cholesterol; HOMA-IR: Homeostatic model assessment of insulin resistance
individuals. The TG/HDL-C ratio was significantly associated with hyperinsulinemia regard-less of race/ethnicity [5].
Subsequent studies indicated that the association of the TG/HDL- C ratio with IR might dif-fer by ethnicity and the TG/HDL-C ratio should not be widely used as a suitable predictor of IR in all ethnic groups [6,8]. In Kim-Dorner et al’s study [6], 50 Caucasian and 99 African Americans were included. The results indicated that both TG and the TG/HDL-C were not ap-propriate predictors for IR defined by HOMA-IR in African Americans ( an AUC<0.70) [6].
The TG/HDL-C ratio is also not a good surrogate marker of IR for Hispanics obese youth and South Asian women [7,8]. As we know, there are limited evidences which support using the TG/HDL-C as a surrogate marker of IR in Chinese individuals. In the present analysis, the re-sults indicated that both the TG/HDL-C ratio and TG can be used as an appropriate predictor for IR in women and overweight/obese men but not in normal-weight men. In the logistic models, when waist circumference and the TG/HDL-C ratio were added into the same models, the AUROCs were significantly increased (P<0.001). The result indicated that using the
Figure 1. a. AUROC curves for potential markers of HOMA-IR in normal-weight men.b. AUROC curves for potential markers of HOMA-IR in overweight/obese men.
TG/HDL-C ratio might increase the diagnostic accuracy of IR. The finding was consistent with a previous study based on 812 Taiwanese adults [9].
Besides LDL-C and HDL-C which are the primary targets of therapy in most clinical guide-lines, other lipoprotein-lipid such as non-HDL-C or apolipoprotein B (apoB) could provide a predictive value [13]. The TC /HDL-C ratio and the LDL-C/HDL-C ratio are also used for as-sessing cardiovascular risks [13,14]. Although studies on the association of the TC/HDL-C ratio or the HDL-C /HDL-C ratio with IR were relatively less, the results support using the TC/HDL-C ratio or the HDL-C /HDL-C ratio as a surrogate marker of IR [15,29,30]. A study based on non-diabetic individuals with impaired fasting glucose showed that the AUROC of the TC/HDL-C ratio for predicting IR was 0.78 (95% CI, 0.65–0.91) [29]. The TC/HDL-C ratio also might have higher sensitivity and specificity in diagnosing polycystic ovarian syndrome with IR [30]. Previous studies based on small samples indicated that the LDL-C/HDL-C ratio might be a reliable marker of IR [15]. In the Quebec Cardiovascular Study [31], 2103 middle-aged men were included and the metabolic profiles were measured. Figure 2. a. AUROC curves for potential markers of HOMA-IR in normal-weight women.b. AUROC curves for potential markers of HOMA-IR in overweight/obese women.
It was concluded that variation in the TC/HDL-C ratio may be related to the IR syndrome than variation in the LDL-C/HDL-C ratio [31]. In a study based on 105 women with polycystic ovarian syndrome, the associations of the TC/HDL-C ratio or the LDL-C /HDL-C ratio with IR have been examined [30]. As we know, the associations have not been explored in Chinese men and women without polycystic ovarian syndrome. In the present analysis, the re-sults indicated that the TC/HDL-C ratio also is associated with IR in overweight/obese men and both normal-weight and overweight/obese women. But the findings did not support using the LDL-C /HDL-C ratio as a predictor of IR in both men and women regardless of BMI categories.
In the present study, it is shown that the optimal cut-off for the TG/HDL-C ratio is 1.51 (3.48, when using mmol/L/mmol/L) for men and this result is similar to the previous study [4]. However, the optimal cut-off for TG/HDL-C ratio in women is 0.84. In one prior study based on Chinese individuals, it was shown that the best cut-off for the TG/HDL-C is 1.1. [10]. Based on one previous study, the optimal cut-offs for waist circumference are 85 cm in men and 80 cm in women in Chinese population [22]. In the present study, we also had similar optimal cut-offs for waist circumference (87 cm in men and 81 cm in women). The recommended opti-mal cut-off for BMI is 24 kg/m2in men and women in Chinese population [22]. However, in the present study, we get difference optimal cut-offs for BMI in men and women (25.15 kg/m2 in men and 23.44 kg/m2in women).
In the present study, we did not use the gold standard method, the hyperinsulinemiceuglycemic clamp, to detect IR. This is a major limitation of the present study. Several alternative methods can be used to detect IR. These methods included HOMA-IR, fasting insulin, Quantitative insulin sensitivity check index (QUICKI) [32], glucose/ insulin ratio [33] and so on. A previous study based on 15, 568 Chinese individuals provided information on the optimal cut-off for HOMA-IR in Chinese individuals [19]. In this national survey, subjects were recruited from 19 provinces of China [19]. Not enough evidence is available to determine optimal cut-offs for QUICKI and fasting serum insulin in the Chinese populations. A study based on 508 Chinese individuals with diabetes mellitus also indicated that that the fasting glucose/ insulin ratio is not a reliable index of insulin sensitivity [33].
Table 4. Optimal cut-offs for lipid ratios and the associated sensitivities and specificitiesa.
Cut-point Sensitivity (%) Specificity (%)
Men
Waist circumference (cm) 87 80.8 62.4
BMI (kg/m2) 25.15 68.49 80.09
TG/HDL-C ratio 1.51 54.1 78.2
TC/HDL-C ratio 3.80 76.0 57.1
LDL-C/HDL-C ratio 1.90 54.1 75.9
Triglyceride (mmol/L) 1.78 57.5 72.4
Women
Waist circumference (cm) 81 77.16 60.02
BMI (kg/m2) 23.44 72.29 67.11
TG/HDL-C ratio 0.84 72.4 69.0
TC/HDL-C ratio 3.82 57.8 76.1
LDL-C/HDL-C ratio 2.26 71.8 68.0
Triglyceride (mmol/L) 1.49 55.6 79.7
aAdjusted for age, current smoker, current alcohol use, physical inactivity, education attainment, blood pressure and waist circumference
In the present study, we found that in men with normal weight, none of the lipid ratios nor TG was a reliable marker of IR. Because the sample size is relatively small, the associations of lipid ratios and IG with IR need to be further explored. Waist circumference can be used to pre-dict IR in normal-weight men, and the AUROC for waist circumference was 0.86. In our previ-ous study, it was found that waist circumference is associated with IR and metabolic syndrome in normal-weight subjects [25]. But in that study, serum lipids were not added as covariates. In the present study, it was found that the association of waist circumference with IR in normal-weight men was independent of the TG/HDL ratio.
Other limitations of the present study include two additional points. This was only a cross-sectional study not a longitudinal study. The sample might be bias because only 37% of subjects were men. However, we have analyzed the data in men and women, respectively. The main ad-vantages included using three lipid ratios including the TG/HDL-C ratio, the TC/HDL-C ratio and the LDL-C/HDL-C ratio and the sample was relatively large compared with previous stud-ies [6,9,10,11].
Conclusion
The TG/HDL-C ratio, the TC/HDL-C ratio and TG are associated with IR in overweight/obese men and both normal-weight and overweight/obese women. All of the AUROCs for the TG/ HDL-C, and TG were>0.7. The AUROCs for TC/HDL-C ratio were 0.69–0.77. The LDL-C/
HDL-C ratio should not be used as a reliable predictor for IR in both men and overweight women. In normal-weight men, none of the lipid ratios nor TG was associated with IR, and waist circumference is significantly associated with IR in normal-weight men. The TG/HDL-C ratio and TG might be recommended as surrogate markers of IR in overweight/obese men, normal-weight and overweight/obese women.
Author Contributions
Conceived and designed the experiments: LZ SC HZ. Performed the experiments: LZ SC AD XL YL XS HZ. Analyzed the data: LZ SC MS. Contributed reagents/materials/analysis tools: LZ SC AD XL YL XS HZ. Wrote the paper: LZ SC HZ.
References
1. Reaven GM (1988) Banting Lecture 1988: role of insulin resistance in human disease. Diabetes 37:1595–1607. doi:10.2337/diabetes.37.12.1595PMID:3056758
2. Elahi D (1996) In praise of the hyperglycemic clamp. A method for assessment of beta-cell sensitivity and insulin resistance. Diabetes Care 19(3):278–86. doi:10.2337/diacare.19.3.278PMID:8742583
3. McLaughlin T, Abbasi F, Cheal K, Tichet J, Bonnet F, et al. (2003) Use of metabolic markers to identify overweight individuals who are insulin resistant. Ann Intern Med 139:802–9. doi: 10.7326/0003-4819-139-10-200311180-00007PMID:14623617
4. McLaughlin T, Reaven G, Abbasi F, Lamendola C, Saad M, et al. (2005) Is there a simple way to identi-fy insulin-resistant individuals at increased risk of cardiovascular disease? Am J Cardiol 96:399–404. doi:10.1016/j.amjcard.2005.03.085PMID:16054467
5. Li C, Ford ES, Meng YX, Mokdad AH, Reaven GM (2008) Does the association of the triglyceride to high-density lipoprotein cholesterol ratio with fasting serum insulin differ by race/ethnicity? Cardiovasc Diabetol 7:4. doi:10.1186/1475-2840-7-4PMID:18307789
6. Kim-Dorner SJ, Deuster PA, Zeno SA, Remaley AT, Poth M (2010) Should triglycerides and the triglyc-erides to high-density lipoprotein cholesterol ratio be used as surrogates for insulin resistance? Metab-olism 59(2):299–304. doi:10.1016/j.metabol.2009.07.027PMID:19796777
8. Mostafa SA, Davies MJ, Morris DH, Yates T, Srinivasan BT, et al. (2012) The association of the triglyc-eride-to-HDL cholesterol ratio with insulin resistance in White European and South Asian men and women. PLoS One 7(12):e50931. doi:10.1371/journal.pone.0050931PMID:23251403
9. Chiang JK, Lai NS, Chang JK, Koo M (2011) Predicting insulin resistance using the triglyceride-to-high-density lipoprotein cholesterol ratio in Taiwanese adults. Cardiovasc Diabeto 17;10:93. doi:10.1186/ 1475-2840-10-93PMID:22004541
10. Gasevic D, Frohlich J, Mancini GB, Lear SA (2012) The association between triglyceride to high-densi-ty-lipoprotein cholesterol ratio and insulin resistance in a multiethnic primary prevention cohort. Metabo-lism 61(4):583–9. doi:10.1016/j.metabol.2011.09.009PMID:22075272
11. He JY, He S, Liu K, Wang Y, Shi D, et al. (2014) The TG/HDL-C Ratio Might Be a Surrogate for Insulin Resistance in Chinese Nonobese Women. Int J Endocrino 105168. doi:10.1155/2014/105168PMID: 25136362
12. Arsenault BJ, Boekholdt SM, Kastelein JJ (2011) Lipid parameters for measuring risk of cardiovascular disease. Nat Rev Cardio. 8:197–206. doi:10.1038/nrcardio.2010.223PMID:21283149
13. Miller M, Stone NJ, Ballantyne C, Bittner V, Criqui MH, et al.(2011) American Heart Association Clinical Lipidology, Thrombosis, and Prevention Committee of the Council on Nutrition, Physical Activity, and Metabolism; Council on Arteriosclerosis, Thrombosis and Vascular Biology; Council on Cardiovascular Nursing; Council on the Kidney in Cardiovascular Disease. Triglycerides and cardiovascular disease: a scientific statement from the American Heart Association. Circulation 123:2292–2333. doi:10.1161/ CIR.0b013e3182160726PMID:21502576
14. Zhang LY, Yuan ZY, Chen W, Chen SY, Liu XY, et al. (2014) Serum Lipid Profiles, Lipid ratios and Chronic Kidney Disease in a Chinese Population. Int. J. Environ. Res. Public Health 29; 11(8):7622– 35. doi:10.3390/ijerph110807622PMID:25075881
15. Kawamoto R, Tabara Y, Kohara K, Miki T, Kusunoki T, et al. (2010) Low-density lipoprotein cholesterol to high-density lipoprotein cholesterol ratio is the best surrogate marker for insulin resistance in non-obese Japanese adults. Lipids Health Dis 2010 7; 9:138. doi:10.1186/1476-511X-9-138PMID: 21134293
16. Chen SY, Chen YM, Liu XY, Li M, Wu BD, et al. (2013) Association of Insulin Resistance with Chronic Kidney Disease in Non-diabetic Subjects with Normal Weight. Plos One 13; 8(9):e74058. doi:10.1371/ journal.pone.0074058PMID:24058515
17. Expert Committee on the Diagnosis and Classification of Diabetes Mellitus: (1997) Report of the Expert Committee on the Diagnosis and Classification of Diabetes Mellitus. Diabetes Care 20:1183–1197. PMID:9203460
18. Hanley AJ, Williams K, Gonzalez C, D’Agostino RB Jr, Wagenknecht LE, et al. (2003) Prediction of type 2 diabetes using simple measures of insulin resistance: combined results from the San Antonio Heart Study, the Mexico City Diabetes Study, and the Insulin Resistance Atherosclerosis Study. Diabe-tes 52(2):463–469. doi:10.2337/diabetes.52.2.463PMID:12540622
19. Xing XY, Yang WY, Yang ZJ (2004) The diagnostic significance of homeostasis model assessment of insulin resistance in Metabolic Syndrome among subjects with different glucose tolerance (Chinese). Chin J Diabetes 12(3):182–186.
20. Friedewald WT, Levy RI, Fredrickson DS (1972) Estimation of the concentration of low-density lipopro-tein cholesterol in plasma, without use of the preparative ultracentrifuge. Clin. Chem 18:499–502. PMID:4337382
21. Molarius A, Seidell JC, Sans S, Tuomilehto J, Kuulasmaa K (1999) Waist and hip circumferences, and waist-hip ratio in 19 populations of the WHO MONICA Project. Int J Obes Relat Metab Disord 23 (2):116–125. doi:10.1038/sj.ijo.0800772PMID:10078844
22. Bei-Fan Z, Cooperative Meta-Analysis Group of Working Group on Obesity in China (2002) Predictive values of body mass index and waist circumference for risk factors of certain related diseases in Chi-nese adults: study on optimal cut-off points of body mass index and waist circumference in ChiChi-nese adults. Asia Pac J Clin Nutr 11 Suppl 8:S685–93. doi:10.1046/j.1440-6047.11.s8.9.xPMID:12534691
23. National Cholesterol Education Program (NCEP) Expert Panel on Detection Ea, and Treatment of High Blood Cholesterol in Adults (Adult Treatment Panel III) (2002) Third Report of the National Cholesterol Education Program (NCEP) Expert Panel on Detection, Evaluation, and Treatment of High Blood Cho-lesterol in Adults (Adult Treatment Panel III) final report. Circulation 106(25):3143–3421. PMID: 12485966
24. Ruderman NB, Schneider SH, Berchtold P (1981) The“metabolically-obese,”normal-weight individual. Am J Clin Nut. 34(8):1617–1621. PMID:7270486
26. Bagby SP (2004) Obesity-initiated metabolic syndrome and the kidney: a recipe for chronic kidney dis-ease? J Am Soc Nephrol 15(11):2775–2791. doi:10.1097/01.ASN.0000141965.28037.EEPMID: 15504931
27. Hosmer D, Lemeshow S (2000) Applied logistic regression. 2nd ed. New York: John Wiley & Sons, Inc.
28. Gaziano JM, Hennekens CH, O’Donnell CJ, Breslow JL, Buring JE (1997) Fasting Trs, high-density li-poprotein, and risk of myocardial infarction. Circulation 21; 96(8):2520–5. doi:10.1161/01.CIR.96.8. 2520PMID:9355888
29. Ray S, Bairagi AK, Guha S, Ganguly S, Ray D, et al. (2012) A simple way to identify IR in non-diabetic acute coronary syndrome patients with impaired fasting glucose. Indian J Endocrinol Metab 16(Suppl 2):S460–4. doi:10.4103/2230-8210.104132PMID:23565467
30. Xiang SK, Hua F, Tang Y, Jiang XH, Zhuang Q, et al. (2012) Relationship between Serum Lipoprotein Ratios and IR in Polycystic Ovary Syndrome. Int J Endocrinol:173281. doi:10.1155/2012/173281 PMID:22792101
31. Lemieux I, Lamarche B, Couillard C, Pascot A, Cantin B, et al. (2001) Total cholesterol/HDL cholesterol ratio vs LDL cholesterol/HDL cholesterol ratio as indices of ischemic heart disease risk in men: the Que-bec Cardiovascular Study. Arch Intern Med 10–24; 161 (22):2685–92. doi:10.1001/archinte.161.22. 2685PMID:11732933
32. Katz A, Nambi SS, Mather K, Baron AD, Follmann DA, et al. (2000) Quantitative insulin sensitivity check index: a simple, accurate method for assessing insulin sensitivity in humans. J Clin Endocrinol Metab 85(7):2402–10. doi:10.1210/jc.85.7.2402PMID:10902785