www.earth-syst-sci-data.net/8/79/2016/ doi:10.5194/essd-8-79-2016
© Author(s) 2016. CC Attribution 3.0 License.
Data compilation on the biological response to ocean
acidification: an update
Y. Yang1, L. Hansson2, and J.-P. Gattuso3,4
1State Key Laboratory of Marine Environmental Science, Xiamen University, 361005 Xiamen, China 2International Atomic Energy Agency, Environment Laboratories, 4a Quai Antoine 1er, 98000, Monaco 3Sorbonne Universités, UPMC Univ Paris 06, CNRS-INSU, Laboratoire d’Océanographie de Villefranche, 181
chemin du Lazaret, 06230 Villefranche-sur-mer, France
4Institute for Sustainable Development and International Relations, Sciences Po, 27 rue Saint Guillaume, 75007
Paris, France
Correspondence to:Y. Yang ([email protected])
Received: 29 September 2015 – Published in Earth Syst. Sci. Data Discuss.: 11 November 2015 Revised: 28 January 2016 – Accepted: 2 February 2016 – Published: 16 February 2016
Abstract. The exponential growth of studies on the biological response to ocean acidification over the last few decades has generated a large amount of data. To facilitate data comparison, a data compilation hosted at the data publisher PANGAEA was initiated in 2008 and is updated on a regular basis (doi:10.1594/PANGAEA.149999). By January 2015, a total of 581 data sets (over 4 000 000 data points) from 539 papers had been archived. Here we present the developments of this data compilation 5 years since its first description by Nisumaa et al. (2010). Most of the study sites from which data have been archived are in the Northern Hemisphere and the number of archived data from studies from the Southern Hemisphere and polar oceans is still relatively low. Data from 60 studies that investigated the response of a mix of organisms or natural communities were all added after 2010, indicating a welcome shift from the study of individual organisms to communities and ecosystems. The initial imbalance of considerably more data archived on calcification and primary production than on other processes has improved. There is also a clear tendency towards more data archived from multifactorial studies after 2010. For easier and more effective access to ocean acidification data, the ocean acidification community is strongly encouraged to contribute to the data archiving effort, and help develop standard vocabularies describing the variables and define best practices for archiving ocean acidification data.
1 Introduction
The release of carbon dioxide (CO2) into the atmosphere by human activities results in an increased flux of CO2 into a mildly alkaline ocean, resulting in an increase in the con-centration of inorganic carbon, and a reduction in pH, car-bonate ion concentration, and the capacity of seawater to buffer changes in its chemistry. These changes are collec-tively known as ocean acidification (Gattuso et al., 2014).
Investigations of the effect of ocean acidification on ma-rine organisms and ecosystems have a relatively short history. A wide range of sensitivities to projected rates of ocean acid-ification exists within and across diverse groups of organ-isms, with a trend for greater sensitivity in early life stages
(Kroeker et al., 2013). Several meta-analyses reveal a pattern of positive and negative impacts (Gattuso et al., 2014) but key uncertainties remain in our understanding of the impacts on organisms, life histories and ecosystems.
chemistry and ancillary data are often reported in different units and scales, and calculated using different sets of con-stants, making the carbonate chemistry across studies incon-sistent. For example, it is crucial to report the pH scale used, since pH reported on the free scale is about 0.11 to 0.12 units higher than on the total and seawater scales, respec-tively (Zeebe and Wolf-Gladrow, 2001).
A compilation of ocean acidification biological response data was initiated by the European Network of Excellence for Ocean Ecosystems Analysis (EUR-OCEANS) and the European Project on Ocean Acidification (EPOCA) in 2008 (Nisumaa et al., 2010). This effort ended in 2012 when the EPOCA project came to an end but was resumed in the framework of the Ocean Acidification International Coordi-nation Centre (OA-ICC) in 2013, in close collaboration with Xiamen University and the world data centre PANGAEA. The goal of the OA-ICC data compilation is to gather data on the biological response to ocean acidification (carbon-ate chemistry, biogeochemical processes and ancillary data) from published articles and to make them available in a co-herent format to the scientific community. As part of the ef-fort, the carbonate system variables are recalculated in a con-sistent way. Data from papers that report at least two carbon-ate chemistry parameters, as well as temperature and salinity, are included in the compilation. The data compilation has been very well received by the ocean acidification commu-nity. It has been used in three meta-analyses (Kroeker et al., 2010, 2013; Liu et al., 2010), a modelling study (Muller and Nisbet, 2014) and cited in six other publications (Fiorini et al., 2011; Hendriks and Duarte, 2010; Hoppe et al., 2012; Ko-eve and Oschlies, 2012; Meyer and Riebesell, 2014; Rokitta, 2012). We report here on the developments of this database 5 years since its first description by Nisumaa et al. (2010). This update is timely, since 500 data sets from 439 papers (81 % of the total number included in the compilation) have been archived since the publication of Nisumaa et al. (2010).
2 Data
The compilation process described in Nisumaa et al. (2010) was followed to maintain consistency. Briefly, papers on the biological response to ocean acidification were iden-tified by searching the OA-ICC news stream (http:// news-oceanacidification-icc.org/) or through the OA-ICC bibliographic database for older papers. Papers were ex-cluded from the compilation when they only used levels of partial pressure of carbon dioxide (pCO2) or pH which are not consistent with present-day levels or future scenarios. For example, data collected with a control condition with pCO2values below about 100 µatm or above 1700 µatm or pHT (on the total scale) values below about 7.5 or above 8.5 were excluded unless they are environmentally relevant at the study location. Data were requested from the au-thors by email. Data were either provided by auau-thors, or
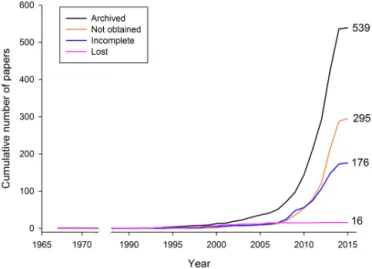
ex-Figure 1.Cumulative number of papers for which data have been included in the compilation (“archived”), papers for which data could not be obtained (“not obtained”), papers which reported less than two carbonate system parameters (“incomplete”) and papers for which the data have been lost (“lost”).
tracted from tables in the original paper, or downloaded from other data repositories such as the Biological and Chemical Oceanography Data Management Office (BCO-DMO), the British Oceanographic Data Centre (BODC) and the Aus-tralian Antarctic Data Centre (AADC). All the data sets archived in the framework of the OA-ICC (since 2013) as well as the projects EPOCA/EUR-OCEANS (2008–2012) have been given the tag “Ocean Acidification International Coordination Centre (OA-ICC)” in PANGAEA.
Between the beginning of this activity in 2008 and Jan-uary 2015, 1026 relevant papers were identified. 581 data sets (over 4 000 000 data points) were archived from 539 of these papers. Data from a paper can be archived as several data sets (e.g. http://doi.pangaea.de/10.1594/PANGAEA. 777725), which explains why out of 539 papers, there were 581 data sets archived. Data of the remaining 487 papers could not be added to the compilation for the following rea-sons (Fig. 1): (1) less than two carbonate system parameters were measured in 176 papers, preventing the recalculation of the carbonate chemistry; (2) data from 295 papers could not be obtained from the authors; and (3) data from 16 papers were lost by authors.
bio-logical response papers, with data from 11 papers archived for 2007 to 110 papers for 2014. More than 90 % of the data archived in the compilation come from papers published after 2007.
All the references of papers included in the data com-pilation have been tagged with the keyword “OAICCdb” in the OA-ICC bibliographic database (www.tinyurl.com/ oaicc-biblio). The OA-ICC bibliographic database was used to retrieve statistical information on the type of papers from which the data archived originated. Keywords describing the geographical region, type of organism and biological process studied, other factors manipulated, as well as the country of affiliation of the first author were extracted from the bib-liographic database for statistical analysis. Results are pre-sented as the percentage of papers from which data were archived. Information on salinity, temperature and carbonate chemistry data archived as part of the data compilation were extracted from the PANGAEA data warehouse. The analyses of these parameters were based on the percentage of data sets or count of data points.
2.1 Geographical coverage
In the OA-ICC data compilation, the location of study sites indicates where the studied organisms were collected or the location of the natural communities investigated. The ge-ographical location is not always clearly indicated in the papers, and the bibliographic database does not provide geographical information for experiments using organisms which have been cultured for a long time in the laboratory or collected from commercial hatcheries. The geographical areas which are best covered are the North Atlantic Ocean, North Pacific Ocean, South Pacific Ocean and Mediterranean Sea (33, 19, 17 and 10 %, respectively, of the papers in-dicating a geographical location). The Arctic Ocean, Baltic Sea, Southern Ocean, Red Sea, Indian Ocean and South At-lantic Ocean collectively represent only 21 % of the papers. In summary, most of the study sites to date have been in the Northern Hemisphere, the number of studies from the South-ern Hemisphere and polar oceans are relatively low (Fig. 2). Data from 35 studies performed in the Arctic Ocean were archived, 22 of them from the EPOCA mesocosm experiment carried out in Kongsfjorden (Spitsbergen) in 2010 (Riebe-sell et al., 2013). There were data from 12 papers from the Southern Ocean, all added after the publication of Nisumaa et al. (2010). This remains a low number considering the fact that polar regions are particularly vulnerable to ocean acidi-fication (Orr et al., 2005; Steinacher et al., 2009).
2.2 Taxonomic coverage
Phytoplankton (in 20 % of the papers in the data compilation) and corals (18 %) are still the best represented taxonomic groups (Fig. 3), although their percentages came down from, respectively, 39 and 29 % of the papers from which data were
Figure 2.(a)Location of organisms and natural communities from which data has been archived and(b)distribution of locations ac-cording to latitude.
archived before 2010 (Nisumaa et al., 2010). The relative number of papers studying other taxonomic groups went up: molluscs (8 to 16 %), macroalgae (7 to 11 %), crustaceans (5 to 8 %), echinoderms (3 to 8 %) and fish (2 to 6 %). Sixty studies (11 %) investigated the response of a mix of organ-isms or natural communities, while there were no such stud-ies from which data were archived before 2010, indicating a clear shift away from the study of individual organisms to communities and ecosystems, as has been recommended to close existing gaps in ocean acidification science (Riebesell and Gattuso, 2015). This is important as data on competitive and trophic interactions are key to better predict future im-pacts of ocean acidification. The amount of papers concern-ing prokaryotes, protists, zooplankton and others (annelids, virus etc.) are relatively low (less than 8 % for each species).
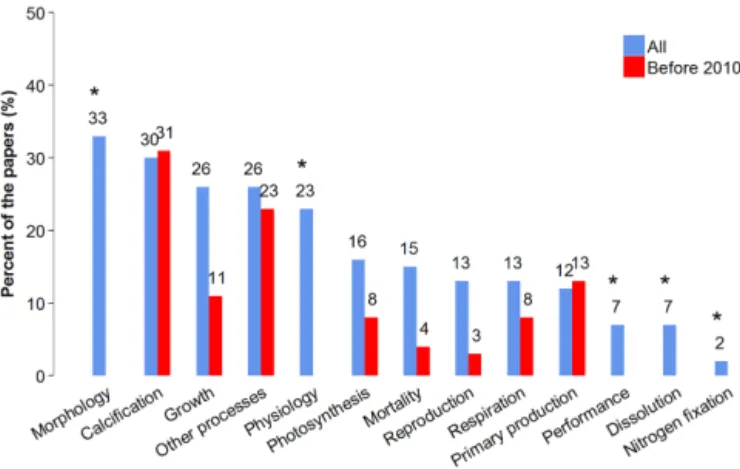
2.3 Biological processes
Figure 3.Taxonomic coverage of the papers from which data have been included in the OA-ICC data compilation, compared to those archived prior to 2010. Categories marked with∗were not present
in Nisumaa et al. (2010).
Figure 4.Biological processes reported in the papers from which data have been included in the OA-ICC data compilation, com-pared to those archived prior to 2010. Other processes studied in the papers from which data were archived before 2010 comprise variables such as shell length, width and linear extension of mol-luscs, bleaching, invasion, orientation, different blood cell concen-tration, concentration in the tissues of organisms, rate of nitrogen fixation (Nisumaa et al., 2010). The categories marked with∗were
not present in Nisumaa et al. (2010) or their definition was differ-ent. “Morphology” was included in “Other processes” in Nisumaa et al. (2010) whereas it is considered as a distinct category in the present paper.
oaicc-biblio). All processes, except calcification and primary production, are better represented today than they were be-fore 2010, indicating that the initial imbalance (of consid-erably more studies on calcification and primary production than on other processes) has improved.
2.4 Multiple factors
There is a clear tendency towards more multifactorial studies after 2010. Even though the majority of the compiled papers
Figure 5.Papers that have manipulated the carbonate chemistry alone and those that have manipulated the carbonate chemistry as well as other variables. CC, carbonate chemistry. The categories marked with * were not present in Nisumaa et al. (2010).
have only manipulated the carbonate chemistry, their relative contribution in the data compilation decreased from 81 (pre-2010) to 69 %. The main other factors studied in addition to the carbonate system are temperature (14 % of papers), nutri-ents (6 %) and light (5 %) (Fig. 5). Few papers manipulated oxygen, metal or toxic compounds. Twenty papers have also reported combined effect of changes in carbonate chemistry with two or three other factors. In general, data from studies on multifactorial impact are still limited in the data compila-tion. It is one of the major challenges faced by future ocean acidification research (Riebesell and Gattuso, 2015).
2.5 Countries of first-author affiliation
Based on first-author affiliation, most of the data compiled are from articles contributed by European countries (59 %; Fig. 6). Within Europe, 41 % of the papers were published by German scientists and 19 % by UK scientists. The USA (18 %) and Australia (8 %) also contribute a lot to the data compilation. There are still data from many papers which could not be obtained from the authors from these two coun-tries (87 and 49 papers, respectively).
2.6 Measured carbonate chemistry variables
A complete and consistent set of carbonate system variables was calculated by the R package seacarb (Gattuso et al., 2015) as described by Nisumaa et al. (2010), in order to provide coherent information on the chemistry1. The recal-culated parameters were archived together with the origi-nal ones and were flagged accordingly (“Calculated using seacarb after Nisumaa et al., 2010” together with a reference to the data curator responsible for the recalculation).
1Dissolved inorganic carbon (C
Figure 6. Countries of affiliation of first author of papers from which data were archived and papers for which data could not be obtained.
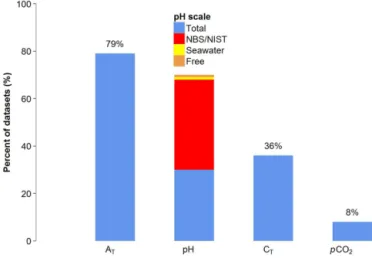
Total alkalinity (AT) is the carbonate chemistry variable that is the most measured (79 % of the data sets; Fig. 7). The other variables measured include pH (70 %), dissolved in-organic carbon (CT, 36 %) and the partial pressure of carbon dioxide (pCO2, 8 %). Out of the 70 % data sets that measured pH, 38 % reported pH on the National Bureau of Standard (NBS) scale (also referred to as the National Institute of Stan-dards and Technology, NIST, scale), 30 % on the total scale, 1 % on the seawater scale (SWS) and 1 % on the free scale (Fig. 7). Although the number of data sets with pH reported on the NBS scale are still more than on the total scale, the ratio of them has been decreased from 2.2 (pre-2010) to 1.2. The pH value on the total scale is 0.15 units lower than on the NBS/NIST scale and 0.01 units higher than on the SWS scale (Dickson, 2010), which makes the direct comparison of experimental results difficult. All other scales are converted to the total scale in this compilation as recommended in the Guide to Best Practices in Ocean Acidification Research and Data Reporting (Dickson, 2010).
2.7 Temperature and salinity coverage
The temperature values reported range from−3 to 34◦C but most temperature data are between 18 and 21◦C (Fig. 8a) and few values are below 0◦C or above 30◦C. Salinity ranges from 4 to 65 with 60 % of the data points ranging between 32 and 36 (Fig. 8b). The geographical distribution of the papers considered (Fig. 2) shows that the study sites are distributed over all the oceans of the world, including the high-salinity Red Sea and the low-salinity Baltic Sea. High-salinity la-goons and low-salinity estuarine areas have also been stud-ied, which can explain the large range of salinity in the com-pilation. There are 36 data points with salinity greater than 50 – they were derived from paper on brine algae collected from sea ice in Antarctica (McMinn et al., 2014).
Figure 7.Variables of the seawater carbonate system reported in the data sets.
2.8 Carbonate chemistry variables coverage
pHT,pCO2,AT,CT, aragonite (a) and calcite (c) satu-ration states and carbonate ion (CO2−
ies performed in low-salinity areas, such as the Baltic Sea and estuarine areas. The concentration of CO2−
3 , as well as a andc exhibit similar distribution patterns, with most number of data points close to their average value of surface seawater for 2100 (Fig. 8g, h, i).
3 Recommendations
As a new scientific field such as ocean acidification devel-ops, the amount of scientific data grows considerably and the need for data archiving greatly increases to ensure that data are easily accessible for analysis and reuse. Many journals, such as the Proceedings of the Royal Society B – Biological Sciences, PLoS ONE and Nature, require or encourage au-thors to archive data in public data repositories. Several data journals were launched to help this process. For example, the present journal was launched by the European Geosciences Union in 2008 and Scientific Data of the Nature publishing group in 2014. Many funding agencies also have require-ments on data archiving. The European Research Council (ERC) mandate funded scientists to deposit primary data in relevant databases as soon as possible after data collection. In the United States, researchers seeking funding from the National Science Foundation (NSF) are required to submit a data management plan as a supplement to the grant appli-cation. Research projects such as the European FP7 project EPOCA have provided guidelines on data reporting and dis-cussed the benefits of data archiving (Pesant et al., 2010). Al-though data archiving is not only of benefit for the scientific community but also a great way to advertise scientific work, get more citations (Piwowar et al., 2007) and initiate new col-laborations, it is a difficult task to collect data from authors. It is a slow process and only data from 53 % of the relevant papers could be included in the compilation. We therefore encourage the international ocean acidification community to actively participate in the data archiving effort.
Another challenge is the use of consistent variable names as papers sometimes report the same variable with differ-ent names, for example “respiration” and “oxygen consump-tion”. It is recommended to develop standard vocabular-ies describing the variables. And the standard vocabularvocabular-ies should be used in the metadata template to ensure effective data searching (Jiang et al., 2015). At an expert meeting on the management of ocean acidification biological response data organized by the Ocean Acidification International Co-ordination Centre in 2014, ocean acidification scientists and data managers from major data centres agreed to develop a list of the most common biological parameters from ocean acidification studies (Hansson et al., 2014). Journals are in-vited to make sure that variables of the carbonate chem-istry are reported in full and with the required level of de-tail (see Supplement). Furthermore, some data have previ-ously been published in PANGAEA by data curators of other projects (e.g. the project “Biological Impacts of Ocean
Acid-ification”, BIOACID), or in other databases (e.g. the Bio-logical and Chemical Oceanography Data Management Of-fice, British Oceanographic Data Centre, Australian Antarc-tic Data Centre), which induced duplicates when they were archived again for the OA-ICC data compilation with recal-culated carbonate chemistry data. To detect duplication, we recommend that the community creates unique identification for data sets on the biological response to ocean acidification. And it is hoped that all projects and databases can define best practices for archiving ocean acidification data and cooperate to avoid duplication. To this end and to meet the need for eas-ier and more effective access to ocean acidification data, data managers of various institutions are planning to create a joint portal (“one-stop shop”) for access to global ocean acidifica-tion data by linking different data repositories (Garcia et al., 2015; Hansson et al., 2014). The Ocean Acidification Inter-national Coordination Centre recently organized a follow-up workshop to the last meeting in 2014 to work on the technical details of the one-stop shop data portal.
Data availability
Access to data presented in this paper is at doi:10.1594/PANGAEA.149999.
Access to additional data resources: (1) the growing collection of data sets: http://www.pangaea.de/search?q= Project:OA-ICC and (2) the Ocean Acidification (OA-ICC) bibliography: https://www.mendeley.com/groups/4333941/ ocean-acidification-oa-icc/papers/.
The Supplement related to this article is available online at doi:10.5194/essd-8-79-2016-supplement.
Acknowledgements. We are grateful to all the authors for the provision of data and to the staff of PANGAEA, especially Stefanie Schumacher, for the considerable help and support it has provided to the data compilation since 2007. The pioneering work of Anne-Marin Nisumaa, data manager of the EPOCA project, is greatly appreciated. This is a contribution of the Ocean Acidification International Coordination Centre (OA-ICC), a project funded through the Peaceful Uses Initiative of the IAEA. The IAEA is grateful for the support provided to its Environment Laboratories by the Government of the Principality of Monaco. The support of the State Key Laboratory of Marine Environmental Science (Xiamen University) is also gratefully acknowledged. We thank S. Pesant as well as an anonymous referee for their useful comments.
References
Cornwall, C. E. and Hurd, C. L.: Experimental design in ocean acid-iffication research: problems and solutions, ICES J. Mar. Sci., in press, 2016.
Dickson, A. G.: The carbon dioxide system in seawater: equilib-rium chemistry and measurements, in: Guide to best practices for ocean acidiffication research and data reporting, edited by: Riebesell, U., Fabry, V. J., Hansson, L., and Gattuso, J.-P., Pub-lications Office of the European Union, Luxembourg, 17–40, 2010.
Dickson, A. G., Sabine, C. L., and Christian J. R.: Guide to best practices for ocean CO2measurements, PICES Special Publica-tion, 3, 1–191, 2007.
Fiorini, S., Middelburg, J. J., and Gattuso, J.-P.: Testing the effects of elevated pCO2 on coccolithophores (Prymnesiophyceae): comparison between haploid and diploid life stages, J. Phycol., 47, 1281–1291, 2011.
Garcia, H. E., Cosca, C., Kozyr, A., Mayorga, E., Chandler, C., Thomas, R. W., O’Brien, K., Appeltans, W., Hankin, S., New-ton, J. A., Gutierrez, A., Gattuso, J.-P., Hansson, L., Zweng, M., and Pfell, B.: Data management strategy to improve global use of ocean acidification data and information, Oceanography, 28, 226–228, 2015.
Gattuso, J.-P. and Hansson, L.: Ocean acidification: background and history, in: Ocean acidification, edited by: Gattuso, J.-P. and Hansson, L., Oxford University Press, Oxford, 1–27, 2011. Gattuso, J.-P. and Lavigne, H.: Technical Note: Approaches and
software tools to investigate the impact of ocean acidifica-tion, Biogeosciences, 6, 2121–2133, doi:10.5194/bg-6-2121-2009, 2009.
Gattuso, J.-P., Gao, K., Lee, K., Rost, B., and Schulz, K. G.: Ap-proaches and tools to manipulate the carbonate chemistry, in: Guide to best practices for ocean acidification research and data reporting, edited by: Riebesell U., Fabry V. J., Hansson L., and Gattuso J.-P., Publications Office of the European Union, Lux-embourg, 41–52, 2010.
Gattuso, J.-P., Brewer, P. G., Hoegh-Guldberg, O., Kleypas, J. A., Pörtner, H.-O., and Schmidt, D. N.: Ocean acidification, in: Cli-mate Change 2014: Impacts, Adaptation, and Vulnerability, Part A: Global and Sectoral Aspects, Contribution of Working Group II to the Fifth Assessment Report of the Intergovernmental Panel of Climate Change, edited by: Field C. B., Barros V. R., Dokken D. J., Mach K. J., Mastrandrea M. D., Bilir T. E., Chatterjee M., Ebi K. L., Estrada Y. O., Genova R. C., Girma B., Kissel E. S., Levy A. N., MacCracken S., Mastrandrea P. R., and White L. L., Cambridge University Press, United Kingdom and USA, 129– 131, 2014.
Gattuso, J.-P., Epitalon, J.-M., and Lavigne, H.: seacarb: seawater carbonate chemistry with R, R package version 3.0.8, 2015. Hansson, L., Appeltans, W., and Gattuso, J.-P.: Promoting
inter-national collaboration on ocean acidification data management, Eos, Trans. Am. Geophys. Union, 95, 421–422, 2014.
Hendriks, I. E. and Duarte, C. M.: Ocean acidification: Separating evidence from judgment-A reply to Dupont et al., Estuar. Coast. Shelf Sci., 89, 186–190, 2010.
Hoppe, C. J. M., Langer, G., Rokitta, S. D., Wolf-Gladrow, D. A., and Rost, B.: Implications of observed inconsistencies in
carbon-ate chemistry measurements for ocean acidification studies, Bio-geosciences, 9, 2401–2405, doi:10.5194/bg-9-2401-2012, 2012. Jiang, L.-Q., O’Connor, S. A., Arzayus, K. M., and Parsons, A. R.: A metadata template for ocean acidification data, Earth Syst. Sci. Data, 7, 117–125, doi:10.5194/essd-7-117-2015, 2015.
Koeve, W. and Oschlies, A.: Potential impact of DOM accumulation onfCO2and carbonate ion computations in ocean acidification experiments, Biogeosciences, 9, 3787–3798, doi:10.5194/bg-9-3787-2012, 2012.
Kroeker, K. J., Kordas, R. L., Crim, R. N., and Singh, G. G.: Meta-analysis reveals negative yet variable effects of ocean acidifica-tion on marine organisms, Ecol. Lett., 13, 1419–1434, 2010. Kroeker, K. J., Kordas, R. L., Crim, R., Hendriks, I. E., Ramajo, L.,
Singh, G. S., Duarte, C. M., and Gattuso, J.-P.: Impacts of ocean acidification on marine organisms: quantifying sensitivities and interaction with warming, Glob. Chang. Biol., 19, 1884–1896, 2013.
Liu, J., Weinbauer, M. G., Maier, C., Dai, M., and Gattuso, J.-P.: Effect of ocean acidification on microbial diversity, and on microbe-driven biogeochemistry and ecosystem functioning, Aquat. Microb. Ecol., 61, 291–305, 2010.
McMinn, A., Müller, M. N., Martin, A., and Ryan, K. G.: The re-sponse of Antarctic sea ice algae to changes in pH and CO2, PLoS One, 9, e86984, doi:10.1371/journal.pone.0086984, 2014. Meyer, J. and Riebesell, U.: Reviews and Syntheses: Responses of coccolithophores to ocean acidification: a meta-analysis, Biogeo-sciences, 12, 1671–1682, doi:10.5194/bg-12-1671-2015, 2015. Muller, E. B. and Nisbet, R. M.: Dynamic energy budget modeling
reveals the potential of future growth and calcification for the coccolithophore Emiliania huxleyi in an acidified ocean, Glob. Chang. Biol., 20, 2031–2038, 2014.
Nisumaa, A.-M., Pesant, S., Bellerby, R. G. J., Delille, B., Middel-burg, J. J., Orr, J. C., Riebesell, U., Tyrrell, T., Wolf-Gladrow, D., and Gattuso, J.-P.: EPOCA/EUR-OCEANS data compilation on the biological and biogeochemical responses to ocean acidifica-tion, Earth Syst. Sci. Data, 2, 167–175, doi:10.5194/essd-2-167-2010, 2010.
Orr, J. C., Fabry, V. J., Aumont, O., Bopp, L., Doney, S. C., Feely, R. A., Gnanadesikan, A., Gruber, N., Ishida, A., Joos, F., Key, R. M., Lindsay, K., Maier-Reimer, E., Matear, R., Monfray, P., Mouchet, A., Najjar, R. G., Plattner, G.-K., Rodgers, K. B., Sabine, C. L., Sarmiento, J. L., Schlitzer, R., Slater, R. D., Totterdell, I. J., Weirig, M.-F., Yamanaka, Y., and Yool, A.: Anthropogenic ocean acidification over the twenty-first century and its impact on cal-cifying organisms, Nature, 437, 681–686, 2005.
Orr, J. C., Epitalon, J.-M., and Gattuso, J.-P.: Comparison of ten packages that compute ocean carbonate chemistry, Biogeo-sciences, 12, 1483–1510, doi:10.5194/bg-12-1483-2015, 2015. Pesant, S., Alan Hook, L., Lowry, R., Moncoiffé, G., Nisumaa,
A.-M., and Pfeil, B.: Safeguarding and sharing ocean acidification data, in: Guide to best practices for ocean acidification research and data reporting, edited by: Riebesell, U., Fabry, V. J., Hans-son, L., and Gattuso, J.-P., Publications Office of the European Union, Luxembourg, 243–258, 2010.
Piwowar, H. A., Day, R. S., and Fridsma, D. B.: Sharing detailed re-search data is associated with increased citation rate, PLoS One, 2, e308, doi:10.1371/journal.pone.0000308, 2007.
to best practices for ocean acidiffication research and data re-porting, edited by: Riebesell, U., Fabry, V. J., Hansson, L., and Gattuso, J.-P., Publications Office of the European Union, Lux-embourg, 18–19, 2010.
Riebesell, U. and Gattuso, J.-P.: Lessons learned from ocean acidi-fication research, Nat. Clim. Chang., 5, 12–14, 2015.
Riebesell, U., Gattuso, J.-P., Thingstad, T. F., and Middelburg, J. J.: Arctic ocean acidification: pelagic ecosystem and biogeochem-ical responses during a mesocosm study, Biogeosciences, 10, 5619–5626, doi:10.5194/bg-10-5619-2013, 2013.
Rokitta, S. D.: Characterization of the life-cycle stages of the coc-colithophore Emiliania huxleyi and their responses to ocean acid-ification, Ph.D. thesis, University of Bremen, Bremen, 2012. Sørensen, S.: Enzymstudien II: Uber die Messung und die
Be-deutung der Wasserstoffionenkonzentration bei enzymatischen Prozessen, Biochem. Zeit, 21, 131–200, 1909.
Steinacher, M., Joos, F., Frölicher, T. L., Plattner, G.-K., and Doney, S. C.: Imminent ocean acidification projected with the NCAR global coupled carbon cycle-climate model, Biogeosciences , 6, 515–533, doi:10.5194/bg-6-515-2009, 2009.
Traganza, E. D.: Dynamics of the carbon dioxide system on the Great Bahama Bank, Bull. Mar. Sci., 17, 348–366, 1967. Vernon, H. M.: The effect of environment on the development of
echinoderm larvae: an experimental inquiry into the causes of variation, Philos. Trans. R. Soc. London B Biol. Sci., 186, 577– 632, 1895.