CPD
11, 4895–4915, 2015An astronomical correspondence to the 1470 year cycle of
abrupt climate change
A. M. Kelsey et al.
Title Page
Abstract Introduction
Conclusions References
Tables Figures
◭ ◮
◭ ◮
Back Close
Full Screen / Esc
Printer-friendly Version
Interactive Discussion
Discussion
P
a
per
|
Discussion
P
a
per
|
Discussion
P
a
per
|
Discussion
P
a
per
|
Clim. Past Discuss., 11, 4895–4915, 2015 www.clim-past-discuss.net/11/4895/2015/ doi:10.5194/cpd-11-4895-2015
© Author(s) 2015. CC Attribution 3.0 License.
This discussion paper is/has been under review for the journal Climate of the Past (CP). Please refer to the corresponding final paper in CP if available.
An astronomical correspondence to the
1470 year cycle of abrupt climate change
A. M. Kelsey1, F. W. Menk2, and P. T. Moss1
1
School of Geography, Planning and Environmental Management, The University of Queensland, St Lucia, QLD, 4072, Australia
2
Centre for Space Physics, School of Mathematical and Physical Sciences, Faculty of Science and Information Technology, University of Newcastle, Callaghan, NSW, 2308, Australia Received: 9 September 2015 – Accepted: 22 September 2015 – Published: 20 October 2015 Correspondence to: A. M. Kelsey ([email protected])
CPD
11, 4895–4915, 2015An astronomical correspondence to the 1470 year cycle of
abrupt climate change
A. M. Kelsey et al.
Title Page
Abstract Introduction
Conclusions References
Tables Figures
◭ ◮
◭ ◮
Back Close
Full Screen / Esc
Printer-friendly Version
Interactive Discussion
Discussion
P
a
per
|
Discussion
P
a
per
|
Discussion
P
a
per
|
Discussion
P
a
per
|
Abstract
The existence of a ∼1470 year cycle of abrupt climate change is well-established, manifesting in Bond ice-rafting debris (IRD) events, Dansgaard–Oeschger atmo-spheric temperature cycle, and cyclical climatic conditions precursory to increased El Niño/Southern Oscillation (ENSO) variability and intensity. This cycle is central to
5
questions on Holocene climate stability and hence anthropogenic impacts on climate (deMenocal et al., 2000). To date no causal mechanism has been identified, although solar forcing has been previously suggested. Here we show that interacting combina-tion of astronomical variables related to Earth’s orbit may be causally related to this cycle and several associated key isotopic spectral signals. The ∼1470 year climate 10
cycle may thus be regarded as a high frequency extension of the Milankovitch preces-sional cycle, incorporating orbital, solar and lunar forcing through interaction with the tropical and anomalistic years and Earth’s rotation.
1 Introduction
Rapid, millennial-scale climatic oscillations of 1470±500 years are evident in
numer-15
ous palaeoclimatic records in the North Atlantic and Pacific (Bond et al., 1997, 2013; Braun et al., 2005; Schulz, 2002; Turney et al., 2004). Greenland ice cores and North Atlantic marine cores show that abrupt climate change is associated with Dansgaard– Oeschger temperature cycles and IRD events (Bond et al., 1997; Bond and Lotti, 1995; Bond et al., 2013; Heinrich, 1988). Bond (Bond et al., 1997, 2013; Mayewski
20
CPD
11, 4895–4915, 2015An astronomical correspondence to the 1470 year cycle of
abrupt climate change
A. M. Kelsey et al.
Title Page
Abstract Introduction
Conclusions References
Tables Figures
◭ ◮
◭ ◮
Back Close
Full Screen / Esc
Printer-friendly Version
Interactive Discussion
Discussion
P
a
per
|
Discussion
P
a
per
|
Discussion
P
a
per
|
Discussion
P
a
per
|
glacial, coincident with cold phases of the Dansgaard–Oeschger cycle (Bond et al., 1997; Mayewski et al., 1997; Schulz, 2002).
As sea-surface temperature (SST) cooling preceded these IRD events, and calv-ing events occurred in multiple ice-sheets, internal factors to ice-sheet collapse were dismissed as causal (Bond et al., 1997; Bond and Lotti, 1995). Instead, an
5
ocean–atmosphere link through solar forcing has been suggested (Bond et al., 1997; Mayewski et al., 1997; Schulz, 2002). It was hypothesised that the discharge of ice associated with IRD events produced colder, less saline waters, affecting the thermo-haline current (THC), triggering abrupt major climate change (Clement and Peterson, 2008).
10
Correlated with Bond IRD and Dansgaard–Oeschger cycles is the 1480±10 year
cy-cle in the Pacific associated with the onset of climatic conditions suitable for increased El Niño/Southern Oscillation (ENSO) variability (Turney et al., 2004). ENSO’s dynamic atmospheric–oceanic activity was proposed as an alternative cause of the millennial-scale climate cycle because associated convective systems dominate the planet’s
cli-15
mate (Clement and Peterson, 2008). These systems witness the meridional poleward flow of heat, air and moisture from the tropics which is propelled by ocean–atmosphere interaction (Clement and Peterson, 2008; Gagan et al., 2004; Turney et al., 2004), and are hypothesised as contributing to ice surge and sea-ice formation through trans-ported moisture and heat in the∼1470 year cycle (Gagan et al., 2004; Turney et al., 20
2004). Solar forcing of ENSO at orbital scales is evident in climatic datasets based on the relative precessional positions of the equinox and perihelion (Gagan et al., 2004; Turney et al., 2004).
Based on the similarity in lengths of this millennial-scale climate cycle and the Sothic cycle of Egyptian chronology (cf. Lockyer, 1964), we hypothesised that precession and
25
vari-CPD
11, 4895–4915, 2015An astronomical correspondence to the 1470 year cycle of
abrupt climate change
A. M. Kelsey et al.
Title Page
Abstract Introduction
Conclusions References
Tables Figures
◭ ◮
◭ ◮
Back Close
Full Screen / Esc
Printer-friendly Version
Interactive Discussion
Discussion
P
a
per
|
Discussion
P
a
per
|
Discussion
P
a
per
|
Discussion
P
a
per
|
ability and long-term bolometric variability has been identified in understanding various isotopic signatures associated with this cycle (cf. Damon and Sonett, 1991).
2 Background
Variables were selected for this study to capture the elements of our conceptual model. As the Sun and Moon are responsible for the precessional cycle (Lowrie, 2007: 58),
5
they were clear candidates. The Moon is responsible for nutation (Lowrie, 2007: 58). Nutation, which is a cyclical wobbling of the Earth’s axis over a 18.6 yr periodicity, alters the latitudinal perspective to incoming solar radiation (Lowrie, 2007: 58). As Milankovitch demonstrated through his radiation curves that the amount of radiation received is latitudinally dependent (Imbrie and Imbrie, 1979), the selection of these
10
variables was appropriate. Latitudinal variations in tide heights occur due to the lunar influence, also incorporating one of the conceptual model’s precepts (cf. Lowrie, 2007: 52).
Solar forcing, through sunspot cyclicity and by association with the perihelion, was also incorporated in our model parameters. Sunspot activity modulates the cosmic ray
15
flux in Earth’s atmosphere (Libby, 1960), whilst the perihelion plays an important role in the level of solar insolation reaching Earth. Earth’s rotation-revolution cycle rela-tive to the anomalistic year, based on the perihelion, was also parameterised for this model. These combined factors were expected to account for the sub-harmonics of this millennial-scale signal and various other harmonics found in the radiocarbon isotopic
20
record.
This conceptual model and its implementation are different from previous attempts to explain the cause of this ∼1470 yr cycle. Firstly, an innovative approach used in
this study is the inclusion of Earth’s rotation relative to the anomalistic year in the search for a cause of this millennial-scale cycle and associated sub-harmonics. Unlike
25
CPD
11, 4895–4915, 2015An astronomical correspondence to the 1470 year cycle of
abrupt climate change
A. M. Kelsey et al.
Title Page
Abstract Introduction
Conclusions References
Tables Figures
◭ ◮
◭ ◮
Back Close
Full Screen / Esc
Printer-friendly Version
Interactive Discussion
Discussion
P
a
per
|
Discussion
P
a
per
|
Discussion
P
a
per
|
Discussion
P
a
per
|
Whilst the Saros cycle of eclipses and lunar nodal cyclicity have been extensively used in prior research (Keeling and Whorf, 2000; Munk and Cartwright, 1966), we used the Metonic cycle of lunations within which a cyclical eclipse pattern is naturally self-contained (see below).
The Metonic lunation cycle recurs at 19 yr intervals (to within a couple of hours)
5
and is therefore closely coupled to the tropical year. The Metonic return associated with the current perihelion was selected as a variable because it has the capacity to capture diachronic precessional dynamics by association with the anomalistic year: the Metonic cycle is naturally associated with the tropical system; and the length of the sidereal year is very close the anomalistic year. The Metonic cycle also fulfils the
10
eclipse and gravitational potential of the vacant lunar nodal position as the Moon aligns with the nodes. Additionally, the Metonic cycle shares a harmonic with the Schwabe sunspot cycle at 57 yrs, enhancing its suitability for use in this model. Consequently, the Metonic cycle is an ideal variable that can be associated with both solar and lunar forcing, and is commensurate with the other variables unlike the Saros cycle of eclipses
15
(cf. Cartwright, 1974; Munk et al., 2002).
The Saros cycle and nodal return are problematic for a number of reasons; these in-clude the irregularities associated with the Saros cycle of eclipses (Keeling and Whorf, 2000), and the appropriateness of using the Saros cycle (Munk et al., 2002). The Saros cycle is one that has been known since ancient times, enabling the prediction of the
20
occurrence of eclipses that recur in the same part of the heavens every 18 yrs 11 days (Gutzwiller, 1998: 596). Keeling and Whorf (2000) used the Saros cycle in their mod-elling attempt to explain the cause of the 1470 yr cycle but encountered difficulties that resulted in disparities between peaks of their interacting variables and tidal peaks, as well as large time discrepancies. Their (Keeling and Whorf, 2000) selection of
incom-25
CPD
11, 4895–4915, 2015An astronomical correspondence to the 1470 year cycle of
abrupt climate change
A. M. Kelsey et al.
Title Page
Abstract Introduction
Conclusions References
Tables Figures
◭ ◮
◭ ◮
Back Close
Full Screen / Esc
Printer-friendly Version
Interactive Discussion
Discussion
P
a
per
|
Discussion
P
a
per
|
Discussion
P
a
per
|
Discussion
P
a
per
|
cycle because it is larger than the cycle being investigated. Keeling and Whorf (2000) generalised their connection to the ∼1470 yr cycle through a lunar forced ∼1800 yr cycle, but were not able to explain the mechanisms behind the variations or time dis-crepancies. The gravitational forcing mechanism used by Keeling and Whorf (2000), which influenced the vertical mixing of oceanic layers, was not seen as of great enough
5
magnitude to cause the∼1470 yr cycle (Munk et al., 2002).
Additionally, the use of lunar nodal cycle of∼18.6 yrs as a variable is also
inappro-priate because it needs to be coupled with a lunation to fulfil its potential. This explains past interest in the Saros cycle of eclipses (Keeling and Whorf, 2000; Munk et al., 2002; Pettersson, 1930). The lunar nodes are the intersections of the ecliptic and lunar orbital
10
plane, and are points at which solar and lunar eclipses occur when the Moon is within
∼11◦of the node, at which time an eclipse must occur (Lowrie, 2007: 58). Exact align-ments of the Moon and node result in total solar and lunar eclipses, as well as annular solar eclipses. The closer the Moon to these nodes, the greater the gravitational pull on Earth as individual gravitational influences align (cf. Lowrie, 2007: 50–59; Pettersson,
15
1930: 282–283). The Metonic cycle of lunations is a far more suitable for the purposes of investigating lunar-forced climate cycles.
3 The Model
This study presents a simple trigonometric model involving the superposition of mean values of three variables: (i) Schwabe sunspot cycle; (ii) Metonic cycle of lunations
as-20
sociated with the current perihelion, and (iii) the anomalistic year, the time for Earth’s passage from perihelion to perihelion (365.2596 days). This in turn determines the time of Earth’s rotation and revolution (RRA) relative to the perihelion, i.e. the time for perihelion to occur over the same geographic longitude on Earth. The RRA periodicity used was∼103.77 years, which is the first closest rotational return to within 1◦ of the 25
Braziu-CPD
11, 4895–4915, 2015An astronomical correspondence to the 1470 year cycle of
abrupt climate change
A. M. Kelsey et al.
Title Page
Abstract Introduction
Conclusions References
Tables Figures
◭ ◮
◭ ◮
Back Close
Full Screen / Esc
Printer-friendly Version
Interactive Discussion
Discussion
P
a
per
|
Discussion
P
a
per
|
Discussion
P
a
per
|
Discussion
P
a
per
|
nas, 1989), and the 209 year Suess de Vries (SdV) cycle is a harmonic of this cycle. The modelled RRA activity was compared to 5500 years of astronomical data based on solar and lunar declinations linked to the current perihelion-based Metonic lunation [Fig. 1], generated using planetarium software: NOVA 2.13, (Hand, 1989–1994) and SkyChart III (DeBenedictis, 1993–2004). Lunar nodal positions were also examined
5
relative to these positions.
Heinrich (1988) suggested solar modulation of the climate as a factor in his model but qualified that it would need to accommodate locational sensitivity to filter the stronger pulses of ice-rafting. Our conceptual model assumes geographic regions that are sen-sitive to astronomical forcing through periodic orientation to peak solar and lunar
influ-10
ences (via rotation and revolution), with geographic longitude delineating cyclic returns. These sensitive regions occupy key locations associated with ENSO phenomena, IRD events, deep-water formation (DWF) and upwelling within the THC, with the inferred ability to influence atmospheric and oceanic circulation, heat distribution, and moisture transport. Such areas include the West Pacific Warm Pool (Partin et al., 2007) and
ar-15
eas of DWF in the North Atlantic (Bond et al., 2013; Clement and Peterson, 2008) and Weddell and Ross Seas (Mueller et al., 2012; Pritchard et al., 2012).
4 Discussion
Solar forcing and lunar forcing have both been suggested individually as causes of the
∼1470 yr cycle of abrupt climate change, with schools of thought divided into two
pri-20
mary opposing camps (Broecker, 2003; Munk et al., 2002). Insolation vs. gravitation are the respective themes of these two hypothetical positions (Munk et al., 2002). Gravita-tional forcing is closely linked with theories connected to the thermohaline current and IRD events, whilst the argument for insolation is strongly linked with millennial-scale oscillations of ENSO in the tropical Pacific (Broecker, 2003). However, the position
25
CPD
11, 4895–4915, 2015An astronomical correspondence to the 1470 year cycle of
abrupt climate change
A. M. Kelsey et al.
Title Page
Abstract Introduction
Conclusions References
Tables Figures
◭ ◮
◭ ◮
Back Close
Full Screen / Esc
Printer-friendly Version
Interactive Discussion
Discussion
P
a
per
|
Discussion
P
a
per
|
Discussion
P
a
per
|
Discussion
P
a
per
|
The Sun and Moon cause oceanic, atmospheric and gravitational tides on Earth, driving wind and ocean currents (Keeling and Whorf, 2000; Lowrie, 2007; Toggweiler and Russell, 2008; Wilson, 2013), and their combined influence is potentially signifi-cant in the cause of the∼1470 yr climate cycle, given that linked atmospheric–oceanic
coupling has been identified as a major driver of climate change (deMenocal et al.,
5
2000). Both lunar tidal patterns (Oost et al., 1993; Pettersson, 1930; Raspopov et al., 2011; Stuiver et al., 1995) and evidence of solar forcing (Bond et al., 1997; Heinrich, 1988; Turney et al., 2004; Turney and Palmer, 2007) are found in the palaeoclimatic record.
The 11.4 year sunspot cycle appears to be associated with short-term signals and
10
harmonics in palaeoclimatic radioisotopes datasets, as well as temperature cyclic-ity (Damon and Sonett, 1991; Eddy, 1976). These cosmogenic isotopes likely result from solar modulation of the interplanetary magnetic field and associated cosmic ray flux reaching Earth, and are anticorrelated with sunspot count (Stuiver and Braziunas, 1989; Stuiver and Quay, 1980). Medium-term cyclical wiggles of 209 yrs in the
radio-15
carbon isotope curve, known as the SdV cycle, are assumed to be a modulation of cosmic ray flux by the solar wind (Damon and Sonett, 1991; Suess, 2006). On this as-sumption, modelling has suggested that the superposition of the∼209 year SdV and
∼88±11 year Gleissberg solar cycles may be associated with this∼1470 year climate
cycle (Braun et al., 2005; Damon and Sonett, 1991). However, with only∼200 years of 20
reliable direct observations of sunspot activity (Damon and Sonett, 1991; Eddy, 1976; Stuiver and Quay, 1980), solar variability for medium to long-term cycles is inferred from these isotopic datasets (Damon and Sonett, 1991).
The perihelion is a time of maximum annual solar insolation and an annual peak in spring tide (Berger, 1991; Lowrie, 2007; Thomson, 1997) and its timing is influenced
25
by the Moon. The perihelion is nonstationary, moving in an open-ended cycle of ∼
CPD
11, 4895–4915, 2015An astronomical correspondence to the 1470 year cycle of
abrupt climate change
A. M. Kelsey et al.
Title Page
Abstract Introduction
Conclusions References
Tables Figures
◭ ◮
◭ ◮
Back Close
Full Screen / Esc
Printer-friendly Version
Interactive Discussion
Discussion
P
a
per
|
Discussion
P
a
per
|
Discussion
P
a
per
|
Discussion
P
a
per
|
with IRD events, Dansgaard–Oeschger oscillations, and ENSO variability (Bond et al., 1997; Heinrich, 1988; Turney et al., 2004). The Milankovitch precessional cycle results from the interaction of two nonstationary precessional cycles that move in opposite directions: apsidal (perihelion/aphelion) and equinoctial precessions (Berger, 1977a; Imbrie and Imbrie, 1979). The equinoctial precession sees the equinoxes, which occur
5
at the intersections of the celestial equator with the ecliptic, move in retrograde motion through the constellations over∼26 ky (Berger, 1977a). This movement is in opposite
direction to the apparent annual solar path through the constellations.
The modelled cyclicity of Earth’s RRA is similar to known isotopic spectral peaks in palaeoclimatic records (Bond et al., 1997; Damon and Sonett, 1991; Stuiver and
Braz-10
iunas, 1989), with the strongest of such signals associated with RRA returns to the same longitude (≤1.54◦) phase-aligned to the sunspot and perihelion-based Metonic cycles. As seen in Table 1, the shortest RRA cycle associated with a Metonic return is 493 years (<0.2◦), and these returns occur in conjunction with a series of Metonic eclipses (Fig. 1). Crosses in the right hand columns of Table 1 identify the coincidence
15
of sunspot and Metonic cycles with the RRA cycle, which are important in the amplifica-tion of their individual influences. The 1479 year (<0.6◦) cycle (Table 1) is a harmonic of this signal, amplifying the phase-aligned sunspot cycle; it is also the mean length of the climate signal during the early Glacial (Bond et al., 2013). The RRA cycle period is also similar (differs by 104 years) to the mean Holocene length at 1375 years (Bond
20
et al., 2013).
The Metonic lunation and Schwabe sunspot cycles are harmonically related at peri-ods of 57 and 114 years, representing potential peaks/troughs of gravitational influence and temperature, with gravitational stresses greatest during solar eclipses. These peri-ods appear in palaeoclimatic records (Chambers et al., 2012; Edvardsson et al., 2011;
25
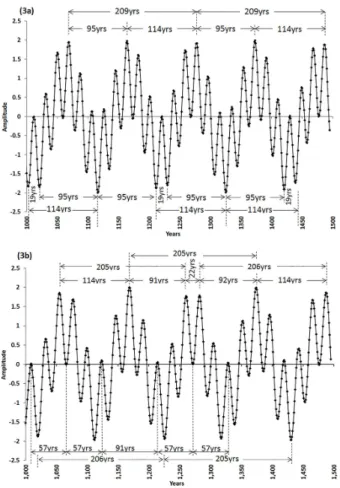
Stuiver and Braziunas, 1989). The 57 year cycle is nonstationary, returning to its start-ing longitude after 285 years (Table 1; Fig. 2).
CPD
11, 4895–4915, 2015An astronomical correspondence to the 1470 year cycle of
abrupt climate change
A. M. Kelsey et al.
Title Page
Abstract Introduction
Conclusions References
Tables Figures
◭ ◮
◭ ◮
Back Close
Full Screen / Esc
Printer-friendly Version
Interactive Discussion
Discussion
P
a
per
|
Discussion
P
a
per
|
Discussion
P
a
per
|
Discussion
P
a
per
|
cycle (Fig. 3a) matches the RRA return to∼1.54◦ longitude of the start point, and the
1479 year cycle is within 0.59◦ (Table 1). The RRA-Metonic return (209 years), based on interaction between the Moon and Earth’s rotation, is closer to the SdV cycle than it is to the return based on interaction between the sunspot cycle and Earth’s rotation (RRA) (∼206 years) (Fig. 3b). These findings suggest that both the SdV and Hallstadt
5
cycles result from the superposition of solar and lunar forcing.
The cycle with the most precise return to the starting longitude is 1868 years (0.017◦) and has no correspondence to the sunspot and Metonic cycles, but appears as a major spectral signal in palaeoclimatic data (Bond et al., 2013). This cycle appears to be strongly associated with oceanic tidal forcing, coincident with the Moon at perigee and
10
lunar node at 1842 yrs (Keeling and Whorf, 2000); at 1842 yrs a Metonic return occurs in association with a neap tide at the starting geographic longitude as the RRA is 90◦ out of alignment (<0.18◦). A 133 yr radiocarbon spectral signal (Damon and Sonett, 1991) is also reflected in the astronomical data of solar declinations (Fig. 1); it and the sunspot cycle are factors of the∼1470 yr cycle.
15
From our astronomical data, sinusoidal curves representing lunar and solar decli-nations (Fig. 1) correspond with key isotopic spectral frequencies in palaeoclimatic datasets, including the 209 year and 228 year harmonics (lunar declinations) and a 133 year Metonic harmonic (solar declinations). A series of total and annular solar eclipses occurs as part of the Metonic-perihelion lunation series at ∼456±38 yr
in-20
tervals, as the lunar nodal axis aligns with the semi-major axis of Earth’s orbit and hence the apsidal axis (Fig. 1). Bond IRD events occurred close to this harmonic at
∼1470±500 year intervals (Fig. 1), suggesting a causal relationship with both the RRA and Metonic-perihelion cycles. The Little Ice Age (LIA) produced the latest Bond IRD event (Bond et al., 2013) closely associated with Metonic-perihelion eclipses,
coinci-25
dent with a total south nodal eclipse.
CPD
11, 4895–4915, 2015An astronomical correspondence to the 1470 year cycle of
abrupt climate change
A. M. Kelsey et al.
Title Page
Abstract Introduction
Conclusions References
Tables Figures
◭ ◮
◭ ◮
Back Close
Full Screen / Esc
Printer-friendly Version
Interactive Discussion
Discussion
P
a
per
|
Discussion
P
a
per
|
Discussion
P
a
per
|
Discussion
P
a
per
|
gravitational forces associated with the lunar perigee cycle are also captured by this model and reflected in associated astronomical data. Three out of four Bond cycles in the last 5000 yrs (Fig. 1) occurred in close proximity to these south nodal total eclipses in the Metonic eclipse series. These results support the hypothesis of the perigean cycle being involved in the cause of the 1470 yr cycle (cf. Keeling and Whorf, 2000;
5
contra Munk et al., 2002).
These Metonic total and annual solar eclipses were ushered in and out by partial solar eclipses. Each eclipse series includes 4–5 solar eclipses spanning a period of 57–76 yrs. The 76 yr cycle has been associated with the Gleissberg cycle by some sources (eg., Hunten et al., 1993). Given that at 57 yr intervals the sunspot harmonic
10
phase aligns with the Metonic cycle, phase-alignment of solar and lunar forcing can be theoretically demonstrated. These cycles were phase-aligned in 1954 when a sunspot minimum occurred (Nicholson, 1956) in conjunction with a perihelion-based Metonic eclipse (Table 2), after which sunspot numbers rose rapidly during Solar Cycle 19 (Nicholson, 1956). This eclipse occurred at midday at 145◦E geographical longitude,
15
which transverses the IPWP.
Previously, latitudinally dependent Milankovitch radiation curves demonstrated that astronomical cycles cyclically influence insolation based on orientation and solar prox-imity (Imbrie and Imbrie, 1979). Consequently, variations in data of solar and lunar declinations that are considered in this model are indicative of altered isotopic
pat-20
terns of incoming solar radiation found in isotopic datasets. Furthermore, the 57 year Metonic-sunspot cyclicity appears to correspond to nonstationary 57 year patterns of precipitation, SST, sea level peaks, and geomagnetic cycles (Chambers et al., 2012; Edvardsson et al., 2011; Stuiver and Quay, 1980).
Our modelling and astronomical data suggest that a ∼493 year cycle is the base
25
harmonic of∼1470 yr cycle of climate change, resulting from the amplification of the
CPD
11, 4895–4915, 2015An astronomical correspondence to the 1470 year cycle of
abrupt climate change
A. M. Kelsey et al.
Title Page
Abstract Introduction
Conclusions References
Tables Figures
◭ ◮
◭ ◮
Back Close
Full Screen / Esc
Printer-friendly Version
Interactive Discussion
Discussion
P
a
per
|
Discussion
P
a
per
|
Discussion
P
a
per
|
Discussion
P
a
per
|
the 493 yr cycle, at∼2300 years a phase shift occurs to realign the RRA cycle to within
a 1◦return to the starting geographical longitude, highlighting regional sensitivity. Based on modelling of the 493 year cycle, there are generally three to four RRA series running concurrently that are within 1◦of a longitudinal return, with a new series beginning every 1868 years. This period matches the most precise RRA return that can
5
also be associated with an∼1800 year oceanic tidal cycle and major spectral peak in IRD data (Bond et al., 1997). Trough to peak of each series is a maximum of 2465 years that may be associated with the Hallstadt cycle. The maximum length of each series is 4437–4930 years that may be associated with the occurrence of Heinrich events.
5 Conclusions
10
By the RRA mechanism, the North Atlantic’s IRD and Dansgaard–Oeschger cycles are phase-locked to internal climate events and to millennial-scale climatic variability of ENSO phenomena. The confluence of solar insolation extremes and peak gravitational, oceanic, and atmospheric tides at the same longitudes likely affects ice-sheet me-chanics, oceanic and atmospheric currents, and atmospheric temperatures and SST,
15
influencing ice-rafting events and freshwater discharge into areas of DWF of the THC (Clement and Peterson, 2008; de Juan et al., 2010; Mueller et al., 2012; Pritchard et al., 2012), as well as ENSO’s dynamic atmospheric–oceanic activity.
In conclusion, we have seen that the superposition of the Earth’s rotation cy-cle (RRA), perihelion-based Metonic cycy-cle, and Schwabe sunspot cycy-cle emulate the
20
∼1470 climate cycle and its harmonics. Wobbles in solar and lunar declinations as-sociated with this model match spectral frequencies in isotopic data and suggest that nutation affects Earth’s insolation at sub-Milankovitch frequencies, influencing climate and isotopic patterns; although previously the cause of these isotopic patterns has been interpreted as inferred medium- to long-term cycles of solar variability (Damon
25
CPD
11, 4895–4915, 2015An astronomical correspondence to the 1470 year cycle of
abrupt climate change
A. M. Kelsey et al.
Title Page
Abstract Introduction
Conclusions References
Tables Figures
◭ ◮
◭ ◮
Back Close
Full Screen / Esc
Printer-friendly Version
Interactive Discussion
Discussion
P
a
per
|
Discussion
P
a
per
|
Discussion
P
a
per
|
Discussion
P
a
per
|
Acknowledgements. We thank the School of Geography, Planning and Environmental Man-agement at the University of Queensland for research funding.
References
Berger, A.: Long-term variations of the Earth’s orbital elements, Celestial Mech., 15, 53–74, 1977a.
5
Berger, A. L.: Support for the astronomical theory of climatic change, Nature, 269, 44–45, 1977b.
Berger, A.: Long-term history of climate ice ages and Milankovitch periodicity, in: The Sun in Time, Sonett, C. G., M., Matthews, M. (Eds.), University of Arizona, Tucson, 1991.
Bond, G., Showers, W., Cheseby, M., Lotti, R., Almasi, P., deMenocal, P., Priore, P., Cullen, H.,
10
Hajdas, I., and Bonani, G.: A pervasive millennial-scale cycle in north atlantic holocene and glacial climates, Science, 278, 1257–1266, 1997.
Bond, G. C. and Lotti, R.: Iceberg discharges into the North Atlantic on millennial time scales during the last glaciation, Science, 267, 1005–1010, 1995.
Bond, G. C., Showers, W., Elliot, M., Evans, M., Lotti, R., Hajdas, I., Bonani, G., and
John-15
son, S.: The north atlantic’s 1–2 kyr climate rhythm: relation to Heinrich events, Dans-gaard/Oeschger cycles and the little ice age, in: Mechanisms of Global Climate Change at Millennial Time Scales, American Geophysical Union, 2013.
Braun, H., Christl, M., Rahmstorf, S., Ganopolski, A., Mangini, A., Kubatzki, C., Roth, K., and Kromer, B.: Possible solar origin of the 1470 year glacial climate cycle demonstrated in a
cou-20
pled model, Nature, 438, 208–211, 2005.
Broecker, W. S.: Does the trigger for abrupt climate change reside in the ocean or in the atmo-sphere?, Science, 300, 1519–1522, 2003.
Cartwright, D. E.: Years of peak astronomical tides, Nature, 248, 656–657, 1974.
Chambers, D. P., Merrifield, M. A., and Nerem, R. S.: Is there a 60 year oscillation in global
25
mean sea level?, Geophys. Res. Lett., 39, 1–6, 2012.
CPD
11, 4895–4915, 2015An astronomical correspondence to the 1470 year cycle of
abrupt climate change
A. M. Kelsey et al.
Title Page
Abstract Introduction
Conclusions References
Tables Figures
◭ ◮
◭ ◮
Back Close
Full Screen / Esc
Printer-friendly Version
Interactive Discussion
Discussion
P
a
per
|
Discussion
P
a
per
|
Discussion
P
a
per
|
Discussion
P
a
per
|
Damon, P. and Sonett, C.: Solar and atmospheric components of the atmospheric 14C vari-ation spectrum, in: The Sun in Time, Sonett, C., Giampapa, M., and Matthews, M. (Eds.), University of Arizona, Tucson, 1991.
DeBenedictis, T.: SkyChart II I, Southern Stars Group, San Francisco, C A., 1993–2004. de Juan, J., Elósegui, P., Nettles, M., Larsen, T. B., Davis, J. L., Hamilton, G. S., Stearns, L. A.,
5
Andersen, M. L., Ekström, G., Ahlstrøm, A. P., Stenseng, L., Khan, S. A., and Forsberg, R.: Sudden increase in tidal response linked to calving and acceleration at a large Greenland outlet glacier, Geophys. Res. Lett., 37, doi:10.1029/2010GL043289, 2010.
deMenocal, P., Ortiz, J., Guilderson, T., and Sarnthein, M.: Coherent high- and low-latitude climate variability during the Holocene warm period, Science, 288, 2198–2202, 2000.
10
Eddy, J. A.: The Maunder Minimum, Science, 192, 1189–1202, 1976.
Edvardsson, J., Linderholm, H. W., and Hammarlund, D.: Enigmatic cycles detected in subfossil and modern bog-pine chronologies from southern Sweden, Trace, 9, 173–180, 2011. Gagan, M. K., Hendy, E. J., Haberle, S. G., and Hantoro, W. S.: Post-glacial evolution of the
Indo-Pacific Warm Pool and El Niño–Southern oscillation, Quatern. Int., 118–119, 127–143,
15
2004.
Gutzwiller, M. C.: Moon-Earth-Sun: the oldest three-body problem, Rev. Mod. Phys., 70, 589– 639, 1998.
Hand, R.: NOVA 2.13, Astrolabe Inc., Brewster, MA, 1989–1994.
Heinrich, H.: Origin and consequences of cyclic ice rafting in the Northeast Atlantic Ocean
20
during the past 130,000 years, Quaternary Res., 29, 142–152, 1988.
Hunten, D. M., Gerard, J.-C., and Francois, L. M.: The atmosphere’s response to solar radiation, in: The Sun in Time, Sonett, C., Giampapa, M., and Matthews, M. (Eds.), Generic, Kalmbach Publishing Company, Milwaukee, 1993.
Imbrie, I. and Imbrie, K.: Ice Ages: solving the Mystery, Enslow Publishers, New Jersey, 1979.
25
Keeling, C. D. and Whorf, T. P.: The 1800-year oceanic tidal cycle: a possible cause of rapid climate change, P. Natl. Acad. Sci. USA., 97, 3814–3819, 2000.
Libby, W. F.: Radiocarbon Dating, http://www.nobelprize.org/nobel_prizes/chemistry/laureates/ 1960/libby-lecture.pdf, last access: 23 October 2012, 2012.
Lockyer, S. N.: The Dawn of Astronomy, The MIT Press., Cambridge, 1964.
30
Lowrie, W.: Fundamentals of Geophysics, Cambridge University Press, Cambridge, 2007. Mayewski, P. A., Meeker, L. D., Twickler, M. S., Whitlow, S., Yang, Q., Lyons, W. B., and
cir-CPD
11, 4895–4915, 2015An astronomical correspondence to the 1470 year cycle of
abrupt climate change
A. M. Kelsey et al.
Title Page
Abstract Introduction
Conclusions References
Tables Figures
◭ ◮
◭ ◮
Back Close
Full Screen / Esc
Printer-friendly Version
Interactive Discussion
Discussion
P
a
per
|
Discussion
P
a
per
|
Discussion
P
a
per
|
Discussion
P
a
per
|
culation using a 110,000-year-long glaciochemical series, J. Geophys. Res.-Oceans, 102, 26345–26366, 1997.
Mueller, R. D., Padman, L., Dinniman, M. S., Erofeeva, S. Y., Fricker, H. A., and King, M. A.: Impact of tide-topography interactions on basal melting of Larsen C Ice Shelf, Antarctica, J. Geophys. Res., 117, doi:10.1029/2011JC007263, 2012.
5
Munk, W., Dzieciuch, M., and Jayne, S.: Millennial climate variability: is there a tidal connec-tion?, J. Climate, 15, 370–385, 2002.
Munk, W. H. and Cartwright, D. E.: Tidal spectroscopy and prediction, Philos. Tr. R. Soc. S.-A., 259, 533–581, 1966.
Nicholson, S. B.: Solar activity in 1955, Publ. Astron. Soc. Pac., 68, 146–148, 1956.
10
Oost, A. P., de Haas, H., Ijnsen, F., van den Boogert, J. M., and de Boer, P. L.: The 18.6 yr nodal cycle and its impact on tidal sedimentation, Sediment. Geol., 87, 1–11, 1993.
Partin, J. W., Cobb, K. M., Adkins, J. F., Clark, B., and Fernandez, D. P.: Millennial-scale trends in west Pacific warm pool hydrology since the Last Glacial Maximum, Nature, 449, 452–455, 2007.
15
Pettersson, O.: The Tidal Force, Geogr. Ann., 12, 261–322, 1930.
Pritchard, H. D., Ligtenberg, S. R. M., Fricker, H. A., Vaughan, D. G., Broeke, M. R. v. d., and Padman, L.: Antarctic ice-sheet loss driven by basal melting of ice shelves, Nature, 484, 502–505, 2012.
Raspopov, O. M., Dergachev, V. A., Ogurtsov, M. G., Kolström, T., Jungner, H., and
20
Dmitriev, P. B.: Variations in climate parameters at time intervals from hundreds to tens of millions of years in the past and its relation to solar activity, J. Atmos. Sol.-Terr. Phy., 73, 388–399, 2011.
Schulz, M.: On the 1470 year pacing of Dansgaard–Oeschger warm events, Paleoceanography, 17, 1014, doi:10.1029/2000PA000571, 2002.
25
Sonett, C. P. and Suess, H. E.: Correlation of bristlecone pine ring widths with atmospheric 14C variations: a climate–sun relation, Nature, 307, 141–143, 1984.
Stuiver, M. and Quay, P. D.: Changes in atmospheric carbon-14 attributed to a variable sun, Science, 207, 11–19, 1980.
Stuiver, M. and Braziunas, T. F.: Atmospheric 14C and century-scale solar oscillations, Nature,
30
CPD
11, 4895–4915, 2015An astronomical correspondence to the 1470 year cycle of
abrupt climate change
A. M. Kelsey et al.
Title Page
Abstract Introduction
Conclusions References
Tables Figures
◭ ◮
◭ ◮
Back Close
Full Screen / Esc
Printer-friendly Version
Interactive Discussion
Discussion
P
a
per
|
Discussion
P
a
per
|
Discussion
P
a
per
|
Discussion
P
a
per
|
Stuiver, M., Grootes, P. M., and Braziunas, T. F.: The GISP2δ18O climate record of the past 16,500 years and the role of the sun, ocean, and volcanoes, Quaternary Res., 44, 341–354, 1995.
Thomson, D. J.: Dependence of global temperatures on atmospheric CO2 and solar irradiance, P. Natl. Acad. Sci. USA, 94, 8370–8377, 1997.
5
Toggweiler, J. R. and Russell, J.: Ocean circulation in a warming climate, Nature, 451, 286–288, 2008.
Turney, C. S. M. and Palmer, J. G.: Does the El Niño–Southern Oscillation control the inter-hemispheric radiocarbon offset?, Quaternary Res., 67, 174–180, 2007.
Turney, C. S. M., Kershaw, A. P., Clemens, S. C., Branch, N., Moss, P. T., and Keith Fifield, L.:
10
Millennial and orbital variations of El Nino/Southern Oscillation and high-latitude climate in the last glacial period, Nature, 428, 306–310, 2004.
CPD
11, 4895–4915, 2015An astronomical correspondence to the 1470 year cycle of
abrupt climate change
A. M. Kelsey et al.
Title Page
Abstract Introduction
Conclusions References
Tables Figures
◭ ◮
◭ ◮
Back Close
Full Screen / Esc
Printer-friendly Version
Interactive Discussion
Discussion
P
a
per
|
Discussion
P
a
per
|
Discussion
P
a
per
|
Discussion
P
a
per
|
Table 1.RRA returns (<2◦
) to the same geographical longitude. Note the presence of important spectral signals, including the Suess de Vries cycle and variations of the∼1470 yr cycle.
Period (yrs) Cycle Return (◦) Precision(◦) Phase Alignment
Sunspot Metonic (yrs)
0 0 0
1868 0.017 0.017
1375 359.82 0.18
493 0.197 0.197 x 494
2361 0.215 0.215 x 2360
882 359.623 0.377
986 0.395 0.395 x 988
2257 359.443 0.557 x 2257
389 359.425 0.575 x 388
1479 0.592 0.592 x x 1482
1764 359.245 0.755
104 0.772 0.772 x 10³
1972 0.789 0.789 x 1972
1271 359.048 0.952
597 0.969 0.969
2465 0.986 0.986
778 358.851 1.149
1090 1.166 1.166
285 358.654 1.346 x x 285
1583 1.364 1.363
2153 358.608 1.392
1660 358.472 1.526
208 1.544 1.542 x x 209
2076 1.561 1.561 x 2075
1167 358.276 1.724
701 1.741 1.741
2542 358.096 1.904
674 358.079 1.921 x 673
CPD
11, 4895–4915, 2015An astronomical correspondence to the 1470 year cycle of
abrupt climate change
A. M. Kelsey et al.
Title Page
Abstract Introduction
Conclusions References
Tables Figures
◭ ◮
◭ ◮
Back Close
Full Screen / Esc
Printer-friendly Version
Interactive Discussion
Discussion
P
a
per
|
Discussion
P
a
per
|
Discussion
P
a
per
|
Discussion
P
a
per
|
Table 2. Perihelion-based Metonic eclipses (1916–2011). Details of these eclipses show eclipse/lunation date, nodal type, and lunar and solar declinations and right ascension (R.A.). Data generated by Skychart III and NOVA 2.13.
Year Date Lunation Node Solar Solar Lunar Lunar type type declination R.A. declination R.A. 2011 4 Jan Partial North −22.73 284.82 −21.75 284.72
eclipse
1992 4 Jan Annular North −22.72 285.05 −22.35 285.00 eclipse
1973 4 Jan Annular North −22.68 285.38 −22.93 285.40 eclipse
1954 5 Jan Annular North −22.68 285.43 −23.58 285.55 eclipse
1935 5 Jan Partial North −22.72 285.15 −24.27 285.33 eclipse
CPD
11, 4895–4915, 2015An astronomical correspondence to the 1470 year cycle of
abrupt climate change
A. M. Kelsey et al.
Title Page
Abstract Introduction
Conclusions References
Tables Figures
◭ ◮
◭ ◮
Back Close
Full Screen / Esc
Printer-friendly Version
Interactive Discussion
Discussion
P
a
per
|
Discussion
P
a
per
|
Discussion
P
a
per
|
Discussion
P
a
per
|