ASSESSMENT OF THE GENERAL PSYCHOLOGICAL AND
FUNC-TIONAL CHARACTERISTICS CAUSED BY VIBRATIONS AT DRIVERS
OF HEAVY MOTOR VEHICLES
In this paper we presented a research that estimates general psychological and functional characteristics of motor vehicle drivers, with the goal of determining the adverse effects of noise and vibration on the drivers. The study was conducted on a sample of 56 participants, professional drivers of motor vehicles, randomly chosen from companies of various types operating in transport of passengers and goods. For the evaluation of the results,we used descriptive and correlational analysis.
The results showed that there were signiicant negative side effects caused by the nature of work of drivers, especially those under the inluence of noise and vibration, which are even more signiicant in older participants and those with more years of service and those who spend more time driving during the interval of 24 hours , as well as those who drive heavier vehicles.
Keywords: drivers of motor vehicles, noise, vibration, psychological and functional characteristics Sanela Čajlaković Kurtalića Original scientiic paper Esad H. Mahmutovića
Admira Behab
Center for Education and Rehabilitation of hearing and speech, Tuzlaa UDC: 613.62:656.13-051 Faculty of Education and Rehabilitation, University of Tuzlab 616-057:656.13-051
Received: 03.06.2014. Accepted: 20.08.2014.
ABSTRACT
1Correspodence to:
Sanela Čajlaković Kurtalić, Center for Education and Rehabilitation of hearing and speech, Tuzla Stupine B9, Tuzla, B&H
Phone: +387 61 392 271 E-mail: [email protected] INTRODUCTION
Drivers due to a seated position at work, the increased number of working hours, often have unhealthy life
-styles, such as lack of exercise, lack of sleep, unhealthy eating habits, obesity, high blood pressure, diabetes, and ulcers. Everyday stress at work which relates to the trafic situation, regulations, rules at the workplace and communication were identiied as the primary top
-ics that are important for the lifestyle of the drivers. Stressful experiences encountered are: long waits for loading and unloading, the pressure of deadlines, traf
-ic jams, the requirements of employers at the short notice, border crossings, mechanical breakdowns, long absences from home, problems with access to healthy foods (diets low in fruits and vegetables and high in saturated fat, calories and salt), working in areas of high trafic pollution, problems with parking space, ines (McDonough and Associates, 2014).
The problem is additionally complicated with con
-tinuous exposure to vibrations. The exposure to the vibrations and lengthy sitting of professional driv
-ers causes a high risk of back pain. Musculoskel
-etal disorders in professional drivers are associated with ergonomic and psychosocial factors. The most common physical factors are: prolonged sitting, vibrations that are transmitted to the whole body, ergonomic: disagreement among drivers, type of vehicle seats and mechanism of the vehicle and driving. Psychosocial factors such as a level of sat
-isfaction with the job, mental requirements, difi
-cult conditions in trafic, passenger dissatisfaction, a short break for lunch, or the unavailability of toi
The Alperovitch-Najenson and Associates Study (2010) demonstrated a statistically signiicant asso
-ciation between the four stressful situations (trafic jams, passenger dissatisfaction, and inadequate use of the day when working in shifts, crowded bus sta
-tion exits and entries) with back pain. Psychological stress contributes to greater muscle tone, causing in
-creased mechanical pressure on the spinal structures. It also creates fatigue that can lead to traumatic in
-jury (Alperovitch-Najenson and Associates, 2010). The vibrations have a harmful effect on the human body, depending on the length of exposure, place of the transmission to the body and individual sensitiv
-ity of the persons. Due to the effect on the neuroveg
-etative system, vibrations are the cause of many dis
-orders such as high blood pressure, diseases of the stomach, peptic ulcer disease, hearing loss, brain is
-chemia, and fatigue, headache, and sleep disturbance. Many people, during their professional activities are exposed to whole-body vibrations, especially driv
-ers of tractors and trucks. The effects of whole-body vibrations are decreased sense of comfort interfered with damaged health and emersion of movement dis
-ease. The vibration of the vehicle has a direct im
-pact on human comfort during the driving, driver’s fatigue, and thus the security. The human body in a sitting position is most sensitive to vibrations caused by low frequencies. However, the subjective experi
-ence of vibration is related to the amount of energy absorbed by the body vibration (Szczepaniak and As
-sociates, 2014).
Exposure to the vibrations at work is regulated by the ISO standards and regulations, which vary from state to state (Hasanbegović, 2013).
By the regulations from 1993., the German Federal Ministry of Labour, in the Oficial Journal of occu
-pational diseases has added a new disease “disease of the lumbar spine” caused by prolonged exposure of the whole-body to the vibrations (Battie and Associ
-ates, 2002).
Noise at the workplace, during the last two decades, has become one of the important social and politi
-cal issues. Noise and vibrations can cause damage to the hearing organs, but also can leave the conse
-quences on the entire personality. The conse-quences are manifested through psychological and functional disorders (Hasanbegović, 2013).
Noise is unwanted sound that in many ways threat
-ens human health. But, what is the noise for the most people may not be for an individual, and vice versa. If a certain limit of the sound level is exceeded, it will
cause a hearing damage – wherever it was considered the noise or not. The sound below the threshold that leads to hearing loss, if it is considered a noise, acts as a hindrance and may have harmful consequences for the health of an individual.
The noise from the environment is a psychologi
-cal and physiologi-cal stress that can affect physi-cal health (Van Camp and Associates, 2012 as per Ba
-bisch and Associates, 2014).
The main causes of death, of more than a quarter of adults, are cardiovascular diseases. One of cardiovas
-cular diseases is hypertension (high blood pressure), and one of the causes of cardiovascular disease is ex
-posure to noise. Stress, acute noise ex-posure triggers autonomic and endocrine systems, which continue to cause temporary changes in blood pressure or vaso
-constriction. There is evidence that continuous noise exposure is associated with an increased risk of de
-veloping hypertension. During three decades of risk assessment has increased from 0.97 in 1980 to 1.28 in 2010 (Banerjee, 2014).
Epidemiological Services have documented the as
-sociation between hypertension and trafic exposure to noise at low and mid-high frequencies to which is the sense of hearing sensitive. The increase of the noise from 50 dB to 65 dB, which is an increase of 13%, leads to irritability, anger. (Istamto and Associ
-ates, 2014).
Chang and Associates (2014) came to the conclusion that exposure to road trafic noise with different fre
-quencies can have a different effect on the incidence of high blood pressure. They found that exposure to noise at a frequency of 125 Hz has a signiicant effect on high blood pressure.
Continuous exposure to noise affects the endocrine and autonomic nervous system. Stress due to the noise causes vasoconstriction, which can be a cause of hypertension during short period of exposure. (Babisch and Associates, 2014).
There is a growing number of hearing loss due to noise exposure in the world. The occurrence of hear
-ing loss due to noise depends on the frequency, in
-tensity and duration of the noise. Hearing loss caused by noise is a slow and progressive disease. Changes usually occur in both ears and include frequencies in the range 3000 to 6000 Hz, while the lower frequen
-cies are cause of hearing loss during a longtime ill
-ness. (Sayapathi and Associates, 2014).
Reactions to noise may depend on the sound charac
The most widespread subjective response to noise is a nuisance, which may include fear and mild anger, which is associated with the belief that one should avoid unpleasantness.
A number of studies have found an association be
-tween chronic aircraft noise exposure and decrease in motivation. The obvious effects of noise on human health are sleeping disorder and disturbances in cog
-nitive abilities. (Stansfeld and Matheson, 2003). According to data from the American Association of safety at work (Occupational Safety and Health Ad
-ministration OSHA) permissible limit for noise expo
-sure is 90 dB during eight hours. As for the National Institute for Occupational Safety and Health (NIOSH) allowed limit of noise exposure that is 85 dB during eight hours. (Sayapathi and Associates, 2014).
Today’s society concept of sleep during 24 hours has changed dramatically. Sleeping is viewed as waste of time and often associated with laziness. Problems with sleep are the medical problem, but a small num
-ber of people with sleep disorder consult a doctor, although poor sleep can lead to decreased quality of life (constant daytime sleepiness, bad mood, changes in behavior, reduced social and recreational activities, increased human errors, loss of productivity, and in
-creased risk of accidents).
Natural human biorhythm is to work during the day and to sleep during the night. That is not the case for the people who work in shifts or who work as drivers. Gallup Organization Study shows that most drivers stop the vehicle to take the sleep - 43% and 15% stop the vehicle when they feel tired. Other activities in case of drowsiness or fatigue included: opening win
-dows (26%), consumption of coffee (17%), listening to the radio (14%). Unfortunately, except the vehi
-cle stopping, other activities provide little beneit for drivers. According to the Gallup Organization, 37% of drivers reported having fallen asleep while driving at least once in their career. The characteristics of those drivers are: they have less than 6 hours of sleep the night before, drove more than 2.9 hours, drove during the night (21,00-06,00). Studies have shown that the increased risk of accidents occurs about 9 hours after the onset of labor. This risk may be increased twice after 12 hours of work and three times after 14 hours of continuous work. Increased rate of accidents oc
-curs after 5 hours of continuous work, and it relates to people who work in shifts and have disturbed sleeping rhythm. National Sleep Foundation (2002) according to Pandi-Perumal and Associates (2006) presents that
91% of respondents agreed that lack of sleep puts a person at risk while driving, and 51% of respondents said they were driving when they were sleepy.
The workers who work shifts and also the drivers encountered: chronic insomnia, loss of sleep, exces
-sive sleepiness, narcolepsy (exces-sive sleepiness and sudden attacks of sleep in inappropriate situations), which directly affects their ability to properly carry out daily activities. (Pandi-Perumal and Associates, 2006).
Exposure to trafic noise may cause interference with cortical and subcortical structures that affect the com
-munication tasks that require a high degree of con
-centration, relaxation and sleep. (Chang, 2014) The job of the drivers is not like an ofice job with a clear time frame and schedule. Mental fatigue of driv
-ers is accepted as part of the job. The driv-ers practice various techniques to avoid sleepiness: opening win
-dows, a longer stay in the fresh air, more smoking, drinking coffee or some energy drink... (McDonough and Associates, 2014).
Aim: Assess the general psychological and functional characteristics of the drivers of motor vehicles (bus
-es, trucks, trailers, excavators and dumper trucks) to identify any adverse effects of noise and vibrations. Hypothesis: Long-term, professional engagement in activities of driving different motor vehicles has a sig
-niicantly negative impact on the psychological and functional characteristics of a driver.
METHODS
The sample of respondents
The sample of respondents (56) consisted of profes
-sional drivers of motor vehicles (buses, trucks, trail
-ers, excavators and dumper trucks), randomly select
-ed from companies that deal with different kinds of transportation of passengers and goods.
Measuring instruments and manner of conducting the research
For the purpose of the research the closed type of questionnaires is used, which consisted of two parts. The irst part covered the most important general in
The second part of the survey consisted of 16 vari
-ables on which it was possible to assess the psycho
-logical and functional characteristics of the driver: irritability, aggression towards the relatives, annoy
-ance by the masses and large gatherings, the need for solitude, memory impairment, appearance of nervousness, the occurrence of nightmares, tired
-ness, loss of concentration, the emersion of high blood pressure, reduce of operating eficiency, feel
-ing muscle pain, feel-ing joint pains, decrease in sex
-ual drive, the loss of interest for any type of work, the appearance of insomnia caused by fatigue. Respondents were provided with answers by Likert scale, with the following possible responses: strong
-ly agree, most-ly agree, I can not decide, most-ly disa
-gree and strongly disa-gree. The respondents by their personal estimate have chosen whether the speciied mental and functional abnormalities are present. The research was conducted with every person separate
-ly, at the workplace of the subjects, and carried out by an audiologist.
Methods of data processing
The obtained data were analyzed using descriptive and correlation analysis. Within a descriptive analy
-sis frequencies and percentages were calculated, and to determine the inluence of driving on the psycho
-logical and functional characteristics of the driver, Pearson's correlation coeficient was calculated. Data were analyzed using the computer program SPSS for Windows and the results are presented in tables.
RESULTS AND DISCUSSION
The description of the results in the applied vari -ables
The sample of respondents for this study was classi
-ied according to age, which may signiicantly affect the psychological and functional disorders caused by exposure to the noise and vibrations. In this sam
-ple the highest percentage of motor vehicle drivers is aged 35 to 45 years of age (44.6%), and signiicant frequencies are present in age from 25 to 35 (25%), and 45 and over (26.8%),(Table 1).
Individual factors such as age, sex, weight, height, body mass index and general health were also asso
-ciated with the occurrence of occupational diseases of the drivers. (Alperovitch-Najenson and Associ
-ates, 2010).
Table 1. Frequencies and percentages for the variable-age of the respondents
Age f %
Till 25 2 3.6
25 to 35 14 25.0
35 to 45 25 44.6
45 and over 15 26.8
Total 56 100.0
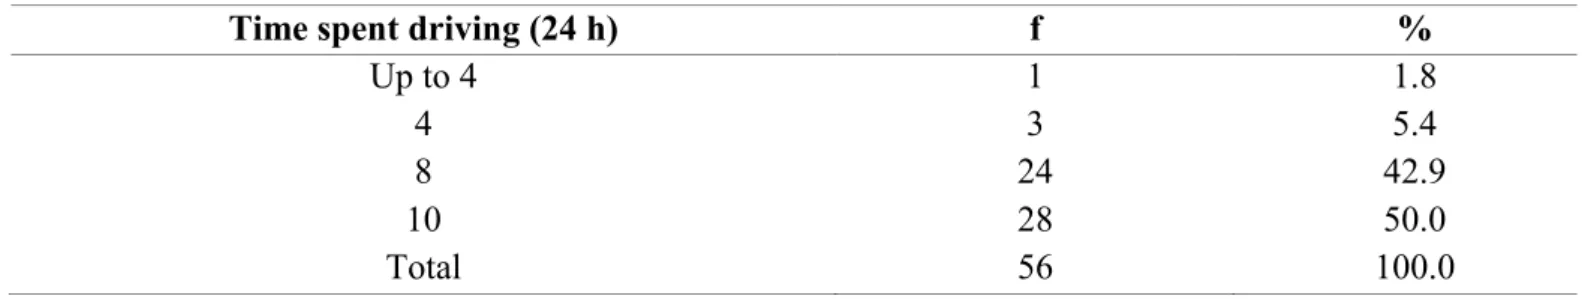
Respondents were classiied according to the time spent behind the wheel during 24 hours. The percent
-age of 50% shows that the largest number of respond
-ents spent behind the wheel more than 10 hours dur
-ing 24 hours. A signiicant percentage of those who were driving for 8 hours is shown (42.9%), (Table 2).
Table 2. Frequencies and percentages for the variable- time spent driving
Time spent driving (24 h) f %
Up to 4 1 1.8
4 3 5.4
8 24 42.9
10 28 50.0
Table 3 shows the frequencies and percentages for the variable "length of service of the respondents." Years of service in the driving profession can signii
-cantly affect the psychological and functional disor
-ders due to long exposure to vibrations and noise. Most of the respondents fells in the category of 10
to 20 years of service (37.5%). A somewhat smaller percentage belongs in the category of 5 to 10 years of service (33.9%). The rest of respondents, approxi
-mately 30%, are allocated to the categories till 5 years of service, 20 to 30 years of service and 30 to 40 years of service.
Table 3. Frequencies and percentages for the variable - years of driving service of respondents
Table 4 shows the frequencies and percentages for the variable "type of trafic" (local or international). The highest percentage, 67.9% of respondents be
-longs to the category of local trafic, while 28.6% of respondents belong to the category of international trafic.
Table 4. Frequencies and percentages for the variable – types of trafic (local or international)
Types of traffic f %
Local 38 67.9
International 16 28.6
Unknown 2 3.6
Total 56 100.0
Table 5 presents the frequency and percentages for variable "type of vehicle". Respondents are classi
-ied into ive categories, depending on whether they are drivers of buses, trucks, trailers, excavators and dumper trucks. The largest number of respondents
(51.8%), were bus drivers, signiicantly fewer re
-spondents (19.6%) were truck drivers, the same num
-ber of respondents were drivers trailers and excava
-tors (10.7%), while a small number of respondents were drivers of dumper trucks.
Table 5. Frequencies and percentages for the variable- “type of vehicles”
Types of vehicles f %
Bus 29 51.8
Truck 11 19.6
Trailer 6 10.7
Excavator 6 10.7
Dumper Truck 4 7.1
Total 56 100.0
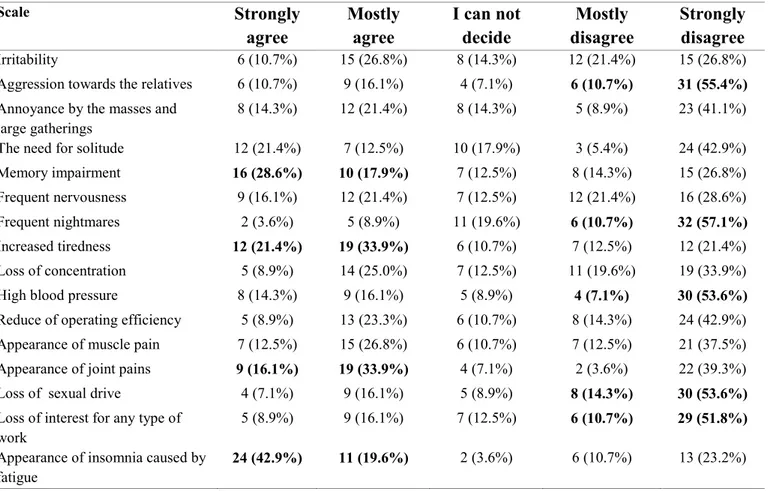
Table 6 gives an overview of frequencies and per
-centages for the 16 variables used in the assessment of psychological and functional characteristics of the drivers. It is evident that the highest percentage (over 60%) of the respondents shows overall pattern deny
-ing the occurrence of negative consequences such as: aggression towards relatives, frequent occurrence of
nightmares, increased blood pressure, decreased sex
-ual drive and decrease of willingness to work, while the highest percentage (over 50 %) conirm: memory impairment, increased fatigue, aches and pain in the joints and the occurrence of insomnia due to fatigue. Other results were equally distributed between the variables.
Years of service f %
do 5 4 7.1
5 do 10 19 33.9
10 do 20 21 37.5
20 do 30 7 12.5
30 do 40 5 8.9
The results show that this is not a very healthy popu
-lation of drivers, given the demands of occupations which are they engaged in, and the evident negative effects may be inluenced by long-term practice in
this profession. Despite the large percentage of re
-spondents who waiver certain dificulties, those dif
-iculties cannot be ignored at the rest of the respond
-ents.
Table 6. Frequencies and percentages for the variable of evaluating psychological and functional characteristics
Scale Strongly
agree
Mostly
agree I can not decide
Mostly disagree
Strongly disagree Irritability 6 (10.7%) 15 (26.8%) 8 (14.3%) 12 (21.4%) 15 (26.8%) Aggression towards the relatives 6 (10.7%) 9 (16.1%) 4 (7.1%) 6 (10.7%) 31 (55.4%) Annoyance by the masses and
large gatherings 8 (14.3%) 12 (21.4%) 8 (14.3%) 5 (8.9%) 23 (41.1%) The need for solitude 12 (21.4%) 7 (12.5%) 10 (17.9%) 3 (5.4%) 24 (42.9%) Memory impairment 16 (28.6%) 10 (17.9%) 7 (12.5%) 8 (14.3%) 15 (26.8%) Frequent nervousness 9 (16.1%) 12 (21.4%) 7 (12.5%) 12 (21.4%) 16 (28.6%) Frequentnightmares 2 (3.6%) 5 (8.9%) 11 (19.6%) 6 (10.7%) 32 (57.1%) Increased tiredness 12 (21.4%) 19 (33.9%) 6 (10.7%) 7 (12.5%) 12 (21.4%) Loss of concentration 5 (8.9%) 14 (25.0%) 7 (12.5%) 11 (19.6%) 19 (33.9%) High blood pressure 8 (14.3%) 9 (16.1%) 5 (8.9%) 4 (7.1%) 30 (53.6%) Reduce of operating efficiency 5 (8.9%) 13 (23.3%) 6 (10.7%) 8 (14.3%) 24 (42.9%) Appearance of muscle pain 7 (12.5%) 15 (26.8%) 6 (10.7%) 7 (12.5%) 21 (37.5%) Appearance of joint pains 9 (16.1%) 19 (33.9%) 4 (7.1%) 2 (3.6%) 22 (39.3%) Loss of sexual drive 4 (7.1%) 9 (16.1%) 5 (8.9%) 8 (14.3%) 30 (53.6%) Loss of interest for any type of
work 5 (8.9%) 9 (16.1%) 7 (12.5%) 6 (10.7%) 29 (51.8%)
Appearance of insomnia caused by
fatigue 24 (42.9%) 11 (19.6%) 2 (3.6%) 6 (10.7%) 13 (23.2%)
Correlation analysis
Descriptive analysis enabled an insight into the glob
-al results which show some negative changes in psy
-chological and functional characteristics of the driv
-ers. However, the actual impact on the occurrence of these changes, and their correlation is determined by the correlation analysis.
The results of correlation analysis, with Pearson’s correlation coeficients which indicate medium and high strength bonds, showed a correlation between the general data that deines the sample of respond
-ents (age, years of service, time spent driving, etc.) , with the consequences related to psychological and functional characteristics, as well as the consequenc
-es within them.
At the level of signiicance p <0.01 statistically sig
-niicant correlations were determined:
- Age with length of service, type of trafic, the weak
-ening of the memory, nightmares, high blood pres
-- Years of service with the kind of trafic, the ap
-pearance of nightmares and reduction of operating effectiveness;
- Aggression towards the closest relatives with nerv
-ousness at mass gatherings and decline of decrease of interest in sexual activity;
- Nervousness at mass gatherings with the need of solitude;
- Frequent nervousness with a growing sense of fa
-tigue;
- Frequent nightmares with reduced of working ef
-iciency, joint pains and reduced in sexual activity; - Increased sense of fatigue with elevated blood
pressure;
- High blood pressure with a decrease in concentra
-tion and labor activity, muscle pain, joint pains, nightmares and insomnia;
- Reduced work eficiency with joint pains and re
-duction of sexual activity; - Joint pain with muscle pain;
At the level of signiicance p <0.05 statistically signii
-cant correlations were determined:
- Age with the appearance of fatigue, muscle pain and a loss of interest in sexual activity;
- Time spent behind the wheel for 24 hours, and high blood pressure;
- Types of trafic and frequent nightmares; - Types of vehicles and muscle pain;
- Irritability with memory impairment, frequent anxi
-ety, high blood pressure, weakening of the willing
-ness for any type work;
- Aggression towards the closest relatives with fre
-quent nightmares, tiredness, decreased willingness to work;
- Nervousness at mass gatherings with increasing fa
-tigue, joint pains and insomnia;
- The need for solitude and lack of will for any type of work;
- Memory impairment with a decrease in operating ef
-iciency and the lack of will for any work;
- Nervousness with the lack of will for any type of work;
- Nightmare with frequent loss of concentration; - Fatigue and insomnia;
- Frequent loss of concentration with reduced working eficiency, joint pains and insomnia;
- High blood pressure with a decrease in interest for sexual activity and the lack of will for any type of work;
- Reduction of operating eficiency with muscle pain; - Joint pains with decrease in interest for sexual activ
-ity;
- The lack of willingness to work and insomnia. The results are consistent with the research and claims of researchers mentioned in the introduction part of the study (van Camp and Associates. 2012; Hasanbegović, 2013; Banerjee, 2014; Istamto and Associates, 2014; Chang and Associates, 2014, and others.), who in simi
-lar way processed the issue and reported a negative in
-luence of workplaces of drivers on their psychological and functional characteristics, especially the inluence of noise and vibrations.
CONCLUSION
The study results or estimates between the relation of variables which relate to general information about re
-spondents - drivers and variables that relate to examined psychological and functional characteristics, indicate that there are the identiied negative effects caused by the nature of work of drivers, especially by the inluence of noise and vibrations. It was found that these consequenc
es are more pronounced in older patients and those with more years in service and those who spent more time driving during 24 hours, as well as those who drive heav
-ier vehicles (excavators and dumpers). Results of corre
-lation analysis also conirmed that negative changes are not isolated cases, but the value of Pearson’s correlation coeficients showed that usually several negative effects on the psychological and functional characteristics were present at each respondent. Most of signiicant connec
-tions belonging to middle and high intensity.
REFERENCES
Alperovitch-Najenson, D., Santo, Y., Masharawi, Y. M., Katz-Leur
-er, M., Ushvaev, D., Kalichman, L. (2010). Low Back Pain among Professional Bus Drivers: Ergonomic and Occupational-Psychoso
-cial Risk Factors. IMAJ Home Page, 12 (1). 26–31.
Babisch, W., Wolf, K., Petz, M., Heinrich, J., Cyrys, J., Peters, A. (2014). Associations between Trafic Noise, Particulate Air Pollu
-tion, Hypertension, and Isolated Systolic Hypertension in Adults: The KORA Study. Environmental Health Perspectives 122 (5). 492–498. DOI:10.1289/ehp.1306981
Banerjee D (2014). Association between transportation noise and cardiovascular disease: A meta-analysis of cross-sectional studies among adult populations from 1980 to 2010. Indian J Public Health
58. 84–91.
Battié, M. C., Videman, T., Gibbons, L. E., Manninen, H., Gill, K., Pope, M., & Kaprio, J. (2002). Occupational driving and lum
-bar disc degeneration: a casecontrol Study. THE LANCET 360 (2). 1369–1374.
Chang, T.Y., Beelen, R., Li, S. F., Chen, T.I., Lin, Y. J., Bao, B.Y., & Liu, C.S. (2014). Road trafic noise frequency and prevalent hy-pertension in Taichung, Taiwan: A cross-sectional study. Chang et
al. Environmental Health. Available from: http://www.ehjournal.net/ content/13/1/37
Hasanbegović, H. (2013). The inluence of noise to stressful disor
-ders and aggressive behavior of industrial workers. Archives Des Sciences 66 (4). 597–613.
Istamto, T., Houthuijs, D., & Lebret, E. (2014). Multi-country will
-ingness to pay study on road-trafic environmental health effects: are people willing and able to provide a number? Environmental Health. Available from: http://www.ehjournal.net/content/13/1/35
McDonough, B., Howard, M., Angeles, R., Dolovich, L., Marzanek-Lefebvre, F., Riva, J. J, Laryea, S. (2014). Lone workers attitudes to-wards their health: views of Ontario truck drivers and their manag-ers. McDonough et al. BMC Research Notes. Available from: http://
www.biomedcentral.com/1756-0500/7/297
Pandi-Perumal, S. R, Verster, J. C, Kayumov, L., Lowe, A. D., San
-tana, M.G., Pires, M. L. N., Tuik, S., & Mello, M. T. (2006). Sleep disorders, sleepiness and trafic safety: a public health menace. Braz J Med Biol Res, 39(7), 863–871.
Sayapathi, B.S, Ting Su, A., & Koh, D. (2014). The Effectiveness of Applying Different Permissible Exposure Limits in Preserving the Hearing Threshold Level: A Systematic Review. J Occup Health, 56. 1–11.