© Author(s) 2009. This work is distributed under the Creative Commons Attribution 3.0 License.
Measurement
Techniques
Seasonal distribution of aerosol properties over Europe and their
impact on UV irradiance
N. Y. Chubarova
Faculty of Geography, Moscow State University, Moscow, Russia
Received: 1 July 2009 – Published in Atmos. Meas. Tech. Discuss.: 4 August 2009 Revised: 1 October 2009 – Accepted: 3 October 2009 – Published: 26 October 2009
Abstract. Using the aerosol optical thickness at 550 nm (τ550) from MODIS (collection 5) for the 2000–2008 pe-riod combined with the aerosol products from the ground-based AERONET network since 1996, monthly mean val-ues of key aerosol parameters have been obtained with 1 de-gree resolution over Europe. Additional tests have revealed a satisfactory quality of the MODIS data, except in a few cases. Quality assured AERONET data are used for evalu-ating the Angstrom exponent, single scattering albedo and asymmetry factor, and for validating the final aerosol opti-cal thickness in the UV spectral region. A method for ex-trapolating the aerosol parameters into the UV spectral re-gion is discussed. The aerosol optical thickness distribu-tions are considered together with meteorological fields from NOAA NCEP CPC CAMS OPI climatology. The τ340 is shown to vary significantly from approximately 0.01 to 0.9 depending on the season and location. Permanent elevated aerosol loading over several industrial areas is observed, which agrees with the output of chemical transport models. Using radiative transfer modeling, monthly mean UV loss due to aerosol was estimated. The absolute decrease in UV indices varies from less than 0.1 to 1.5. The relative UV attenuation has large spatial and temporal variations (−1%– −17%) with a minimum towards the northwest and maxima over several southern local areas (Northern Italy, etc.) during the warm period.
1 Introduction
Atmospheric aerosols are one of the important factors influ-encing solar UV irradiance, which play an important role in the biosphere and have a strong impact on human health (Van
Correspondence to:N. Y. Chubarova (chubarova@imp.kiae.ru)
der Leun et al., 1998). Therefore, it is necessary to have re-liable spatial and temporal distribution of aerosol parameters to get proper UV estimates. The information on aerosol is also necessary for correcting satellite UV retrievals, which can overestimate the measurements up to 40% (McKenzie et al., 2001; Chubarova et al., 2005). The objective of this study is to develop the aerosol climatology over Europe and to characterize the aerosol effects on erythemally-weighted UV irradiance (Qe) reaching the ground.
Aerosol properties of the atmosphere can be obtained from both space and ground. At present several aerosol products are available from different satellite sensors (i.e. AVHRR, OMI, MODIS, CERES, AATSR, MERIS, GLAS, SeaW-iFs, MISR) as well as from ground-based aerosol net-works (AERONET/PHOTONS, SKYNET, AEROSIBNET, GLOBE, etc.) (IPCC, 2007). However, it is necessary to emphasize that the development of the aerosol climatology requires long-term period of observations and should have good spatial resolution. Unfortunately, only several aerosol datasets at present can satisfy these conditions. In addition, since most of aerosol measurements are being carried out in visible spectral range, another problem can arise, how to ex-trapolate the aerosol parameters to UV spectral region. It should be also noted that recently a new aerosol dataset from OMI satellite instrument has been developed providing the estimation of aerosol parameters directly in the UV spec-tral region (Torres et al., 2002). However, not very long period of observations (since 2004) and current problems with cloud screening procedures over Europe with prevail-ing cloudy conditions do not allow us to apply these records in our study.
The approach used in this study is based on the application of the data from satellite measurements ofτλat 550 nm (τ550)
-20 0 20 40 40
60 80
Fig. 1.Distribution of CIMEL sun/sky photometers in Europe and nearby areas. The sites, where the instrument has UV channels (340 and 380 nm), are marked by green crosses.
dataset (collection 5) has a good quality over both land and ocean, except bright surfaces (snow and desert) and is avail-able since 2000. For cloud filtering a standard MODIS cloud mask (MOD/MYD35) is used, which employs a series of vis-ible and infrared threshold and consistency tests. Additional masking has been added, including an internal cloud mask based on spatial variability to identify low clouds and the reflectance in the 1.38µm channel to identify high clouds (http://modis-atmos.gsfc.nasa.gov/MOD35 L2/).
The AERONET/PHOTONS network (http://aeronet.gsfc. nasa.gov/) (Holben et al., 1998) has been in operation since the middle of 1990s and has quite satisfactory spatial cov-erage over Europe. Accurate multi-channel measurements by CIMEL sun/sky photometer through UV to near-infrared spectral region provide the data for evaluating a spectral dependence of aerosol optical thickness as well as many other inversion products including single scattering albedo and asymmetry factor (Dubovik and King, 2000). In addi-tion, AERONET/PHOTONS measurements of aerosol opti-cal thickness at 340 nm can be used for direct validation of the final aerosol product in UV spectral region.
Since both satellite and ground-based measurements re-fer to the middle 1990s – beginning of 2000s period, the influence of Pinatubo volcanic eruption on the increase of total aerosol loading can be neglected. At the same time, we should emphasize the existence of negative trends in aerosol optical thickness of about −0.04–0.05 per decade (at 500 nm), which have been obtained over some areas in Europe (Ruckstuhl et al., 2008), and over the former Soviet Union since the 1980s (Gorbarenko et al., 2006; Makhotk-ina et al., 2005). Their nature is determined by both anthro-pogenic and natural processes and will not be discussed in this paper. However, one should take these trends into ac-count while applying the results to another time period.
2 Data and method description
For estimating the aerosol impact on UV irradiance it is necessary to know several key aerosol characteristics: the aerosol optical thickness (τλ), the single scattering albedo
(ωλ), which characterizes the ratio of scattering to
scatter-ing plus absorption, and asymmetry factor (gλ), which can
be written in the form:
gλ=
1
R
−1
cosθ·P (θ )d(cosθ )
1
R
−1
P (θ )d(cosθ )
(1)
whereθis the scattering angle,P (θ )is the phase function. Spectral dependence of aerosol optical thickness is usu-ally defined by Angstrom parameterα, which is estimated as follows:
α=−dln(τλ)/dln(λ), (2)
The monthly mean MODISτ550have been taken from http: //disc.sci.gsfc.nasa.gov/giovanni/ for the 2000–2008 period with 1◦spatial resolution over the area of 30–80◦N, 28 W– 40◦E, which covers Europe and nearby territories. The mea-surements from both TERRA and AQUA satellite platforms were used to increase the statistics and to account possible aerosol changes during daytime.
The ground-based AERONET/PHOTONS quality assured measurements at level 2 (version 2) were used over the 1994– 2006 period for evaluating the Angstrom parameterαto ac-count spectralτλdependence and for estimating the retrievals
of single scattering albedo and asymmetry factor (Dubovik and King, 2000; Dubovik et al., 2002). Figure 1 presents the spatial distribution of Cimel sun/sky photometers, which data were used in the analysis. To exclude the systematical changes of aerosol parameters with surface elevation, only the data from the sites located lower than 1000 m were pro-cessed. Since overcast cloudy conditions prevent direct sun measurements, the total number of stations with available datasets varies from 73 in summer to 60 in winter. It should be mentioned that the number of Cimel sun/sky photometers with the UV channels is much smaller: the τ340 measure-ments are available from 39 sites in June–July and only from 31 in December (see Fig. 1).
Although the quality of MODIS data may be considered as satisfactory, several additional tests have been fulfilled. Figure 2 presents the difference inτ550and inτ340 between satellite and ground-based datasets. The average uncertainty of monthly mean satelliteτ550retrievals lies within±0.02– 0.03 with small but statistically significant difference in the fall. However, the difference is not large and is much less thanτ550seasonal changes over all European regions. To get
τλ estimates in the UV spectral range two approaches were
-0.2 -0.15 -0.1 -0.05 0 0.05 0.1 0.15 0.2
Jan Fe
b
Ma
rc
h
Ap
ri
l
Ma
y
Jun
e
Jul
y
Au
g
Se
p
t
Oc
t
No
v
De
c
month
∆ τ340
account for the curvature no account for the curvature
-0.1 -0.05 0 0.05 0.1
Jan Fe
b
Ma
rc
h
Ap
ri
l
Ma
y
Jun
e
Jul
y
Au
g
Se
p
t
Oc
t
No
v
De
c
month
∆ τ550
Fig. 2.The difference between MODIS and AERONET/PHOTONS aerosol optical thickness over Europe as a function of month at 550 nm (a)and at 340 nm(b). The confidence intervals were obtained at 95% significant level. The difference with AERONET data at 340 nm is shown with the account and without account for spectral dependence of Angstrom parameter. See the details in the text.
al., 1999; Dubovik et al., 2002), and with the application of a constantαvalue retrieved from 440–870 nm spectral range. The comparisons between theτ340estimated from MODIS data using both methods and direct groundτ340CIMEL mea-surements have revealed the same character of the difference, though with higher deviation (±0.05) for the second one. The difference between the two methods is small and lies within 0.01–0.03 that is close to the uncertainty ofτ340 es-timates. At the same time, due to the much smaller num-ber of CIMEL instruments with UV channels (see Fig. 1) the advantages of accounting for spectral Angstrom curva-ture have been outweighed by the much lower statistics and, hence, larger uncertainty in the resulting Angstrom param-eter spatial distribution. Finally, the application of the con-stantα440−870values was chosen.
The additional analysis has revealed the presence of un-realistically high τ550 values (up to ∼0.7–0.8) observed over some regions in the northern Arctic regions, proba-bly, due to the existence of small spots of snow or ice within the pixel. Note, that according to the measure-ments at AERONET/PHOTONS sites located at high lati-tudes (>58◦N), the averageτ550 values are about 0.1 with the maximum monthly mean value, not exceeding 0.2. This threshold (τ550=0.2) has been chosen as an additional filter, and has been applied to the MODIS data over the northern regions to remove unrealistically highτ550.
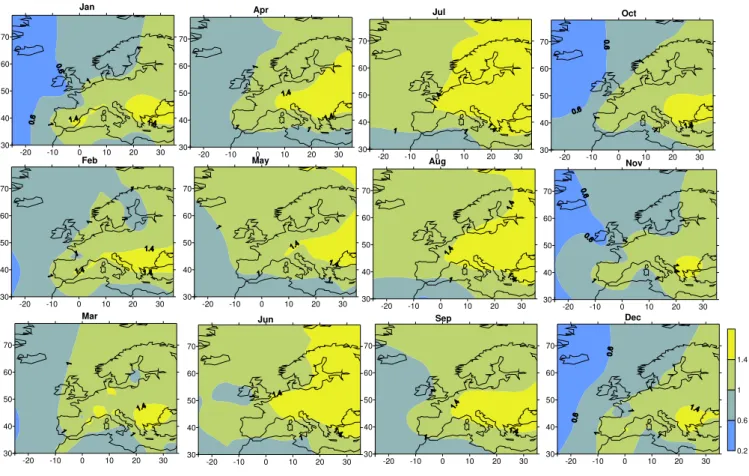
As a result, theτ550climatology over Europe has been ob-tained (Fig. 3), which is used as a base for developing the UV aerosol climatology. Spatial distributions of Angstrom parameter α440−870 have been estimated using geostatisti-cal ordinary Kriging method with a linear type of variogram model. The results are shown in Fig. 4. Using these dis-tributions the final UV aerosol (τ340) climatology has been generated (Fig. 5).
The final distributions of aerosol parameters over Europe are analyzed together with the spatial distribution of meteo-rological parameters. Near-surface wind speed is known to determine the source strength for several aerosols types (for
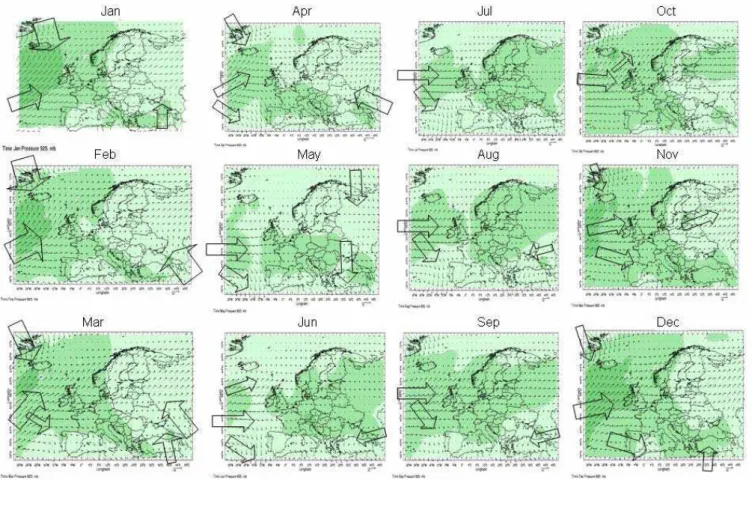
example, sea salt, dust, primary organic particles) (IPCC, 2007). Wet removal of atmospheric aerosols is affected by precipitation, which can also change the soil moisture and vegetation, and, hence, generation of dust particles and bio-genic emission. In order to qualify the possible reasons of aerosol optical thickness changes the data from IRI/LDEO Climate Data Library (http://iridl.ldeo.columbia.edu/) were used to produce maps over Europe with precipitation and wind fields at 925 hPa for the period 1961–1990 on the base of NOAA NCEP CPC CAMS OPI climatology (Janowiak and Xie, 1999; Kalnay et al., 1996). The monthly maps with meteorological fields are presented in Fig. 6.
3 Results
3.1 Distribution of aerosol optical thickness and Angstrom parameter over Europe
The monthly mean distributions of aerosol optical thickness and Angstrom parameter shown in Figs. 3–5 have some typ-ical features in their seasonal and temporal variations. The changes in aerosol optical thickness have a tendency to in-crease towards the south-east, inward the continent, though with different gradients over the year. Theτ340 values vary from ∼0.01 over northern and north-western areas during cold period to τ340∼0.9 over the south, south-eastern re-gions during spring and summer. One should note very pro-nounced seasonalτλ changes, which are sometimes higher
than their difference in space. The Angstrom parameter also increases towards the south-east and has noticeable seasonal changes with maximum in summer over continental area at the south-east and minimum over Atlantic ocean in winter. Figure 7 presents the examples of different seasonalτ340 dis-tributions from both direct AERONET/PHOTONS measure-ments and the developed MODIS/AERONET climatology in the arctic (1), temperate (2), and subtropical (3) climate zones and several of their subtypes. The lowest τλ are
-30 -20 -10 0 10 20 30 40 30
40 50 60 70 80
0 to 0.1 0.1 to 0.2 0.2 to 0.3 0.3 to 0.4 0.4 to 0.6 0.6 to 0.8 0.8 to 1 1 to 2
-30 -20 -10 0 10 20 30 40
30 40 50 60 70 80
-30 -20 -10 0 10 20 30 40
30 40 50 60 70 80
-30 -20 -10 0 10 20 30 40
30 40 50 60 70 80
-30 -20 -10 0 10 20 30 40
30 40 50 60 70 80
-30 -20 -10 0 10 20 30 40
30 40 50 60 70 80
-30 -20 -10 0 10 20 30 40
30 40 50 60 70 80
-30 -20 -10 0 10 20 30 40
30 40 50 60 70 80
-30 -20 -10 0 10 20 30 40
30 40 50 60 70 80
-30 -20 -10 0 10 20 30 40
30 40 50 60 70 80
-30 -20 -10 0 10 20 30 40
30 40 50 60 70 80
-30 -20 -10 0 10 20 30 40
30 40 50 60 70 80
Jan April July Oct
Feb May August Nov
March June Sept Dec
τ
Fig. 3. Monthly spatial distribution ofτ550 over Europe according to MODIS data with account of some corrections in high latitudes according to AERONET/PHOTONS dataset.
which, however, does not exceed τ340∼0.23. Within the temperate climate zone two subtypes can be found over Eu-rope: the area with uniform humidification with one sum-mer τλ maximum (the Oostende site) and the area
transi-tional to continental type, located approximately eastward of ∼15◦E and northward of ∼45◦N with two τ
λ maxima in
spring and summer like at Gotland, Toravere and Moscow sites. One can see much higher τ340 variations there with maxima reaching∼0.4–0.5. In the subtropical zone there is a distinct τλ increase towards inner continental areas from
Spain to Greece with maxima observed during warm period. At the same time the characteristics of the changes inτλare
much more irregular over subtropics, which can be attributed to the effects of the mineral dust aerosol advection to dif-ferent Mediterranean regions from the surrounding deserts. It is necessary to note, that at some sites (for example, in Thessaloniki) the long-termτλdataset obtained from Brewer
measurements provides much better agreement with MODIS data than that obtained between MODIS and AERONET dataset, possibly, due to larger statistics and the application of additional clear-sky filter (Kazadzis, 2007; Koukouli et al., 2007). (It should be noted that the data from the de-veloped MODIS/AERONET climatology have been interpo-lated against the coordinates of the AERONET sites with one
degree resolution dataset. Therefore, this picture should be considered not as the example of the validation but as a pre-sentation of typicalτ340 seasonal features in different areas of Europe obtained both from satellite and ground).
-20 -10 0 10 20 30 30
40 50 60 70
Jan
Feb
Mar Jun Dec
-20 -10 0 10 20 30 30
40 50 60 70
-20 -10 0 10 20 30 30
40 50 60 70
Apr Jul
Aug
Oct
-20 -10 0 10 20 30 30
40 50 60 70
-20 -10 0 10 20 30 30
40 50 60 70
May
-20 -10 0 10 20 30 30
40 50 60 70
-20 -10 0 10 20 30 30
40 50 60 70
-20 -10 0 10 20 30 30
40 50 60 70
Sep
-20 -10 0 10 20 30 30
40 50 60 70
-20 -10 0 10 20 30 30
40 50 60 70
Nov
-20 -10 0 10 20 30 30
40 50 60 70
-20 -10 0 10 20 30 30
40 50 60 70
0.2 0.6 1 1.4
Fig. 4.Monthly spatial distribution of Angstrom parameter according to AERONET/PHOTONS dataset over Europe.
aerosol optical thickness and Angstrom parameter in remote Atlantic area during the TARFOX. In Smirnov et al. (2002) it was also mentioned the noticeable effects of different kinds of fine mode continental aerosol in Atlantic ocean. The in-crease of these aerosol parameters near the European coast can be also explained by the diffusion of polluted air directly from the European continent. All these assumptions should be studied further. During cold period the Angstrom parame-ter has a distinct decrease over almost the whole Europe due to significant enhancing of westerlies and precipitation (see Fig. 6), which result in the growth of the coarse mode sea salt aerosol concentration. However, even in cold period there is a tendency of increasing the fine mode aerosol towards in-ner continental regions at the south. A local α maximum at the south-eastern part of Europe over Balkan peninsula throughout the year can be explained by the joint effect of meteorological factors such as the lack of precipitation and attenuation in wet removal of aerosol, some specific features in air advection (see the discussion below).
Figure 5 demonstrates a permanent elevated aerosol load-ing due to pollution effects over several local areas: North-ern Italy, the coast of the Netherlands, the southNorth-ern re-gions of Poland, and, especially in summer, over the low-lands of the mid and low Danube areas. The qualitative
-30 -20 -10 0 10 20 30 40 30
40 50 60 70 80
0 to 0.1 0.1 to 0.2 0.2 to 0.3 0.3 to 0.4 0.4 to 0.6 0.6 to 0.8 0.8 to 1 1 to 2
-30 -20 -10 0 10 20 30 40
30 40 50 60 70 80
-30 -20 -10 0 10 20 30 40
30 40 50 60 70 80
-30 -20 -10 0 10 20 30 40
30 40 50 60 70 80
-30 -20 -10 0 10 20 30 40
30 40 50 60 70 80
-30 -20 -10 0 10 20 30 40
30 40 50 60 70 80
-30 -20 -10 0 10 20 30 40
30 40 50 60 70 80
-30 -20 -10 0 10 20 30 40
30 40 50 60 70 80
-30 -20 -10 0 10 20 30 40
30 40 50 60 70 80
-30 -20 -10 0 10 20 30 40
30 40 50 60 70 80
-30 -20 -10 0 10 20 30 40
30 40 50 60 70 80
-30 -20 -10 0 10 20 30 40
30 40 50 60 70 80
Jan April July Oct
Feb May August Nov
March June Sept Dec
τ
Fig. 5.Monthly spatial distribution ofτ340according to MODIS/AERONET data.
3.2 Month-to-month variability of aerosol optical thickness and Angstrom parameter
This section is devoted to the detailed analysis of month-to-month variability of aerosol parameters together with the me-teorological fields (see Figs. 3–6).
InJanuarydue to low temperatures and strong westerlies theτλ andαvalues are low all over Europe increasing
to-wards the southeast. These south-easternτλ andαmaxima
can be explained by additional advection of fine mode dust particles from Asia Minor (see Fig. 6), where the substan-tial amount of aerosol is observed. However, theτλ values
there are not very high due to existing of snow cover (My-achkova, 1983), which prevents the formation of additional aerosol particles from ground. At the same time, there are pronounced local maxima over several industrial areas: south of Poland, western coast of Netherlands, Northern Italy. They are not very high (τ340∼0.2–0.3, τ550∼0.1–0.2) but quite distinct. The difference with the nearby unpolluted re-gions comprises about1τ340=0.05–0.15 (1τ550=0.03–0.1). In February, there is an ubiquitous increase in the aerosol optical thickness over almost all Europe, except northern ar-eas higher 58◦N. Central and Eastern Europe are located on the western periphery of Asian anticyclone. Theτλ growth
is associated with the precipitation decrease and with the weakening of circulation processes, which lead to additional
accumulation of aerosol. In addition, one can see a pro-nouncedτλmaximum over the Atlantic ocean near the coast
of Africa and Spain, which can be attributed to the effects of dust aerosol advection from Sakhara desert. Compara-tively high τλ values over the eastern Mediterranean area
can be also explained by predominant advection of air mass from Africa and Arabian deserts with high aerosol loading. One can note the existence of the localτλ maxima over the
same polluted regions which were observed in January. In
MarchEastern Europe is still located on the western periph-ery of Asian anticyclone with strong south-east winds from the steppe and desert areas, which are getting free from snow but still are not covered by grass (Myachkova, 1983) and therefore can be a substantial source of dust. The lack of pre-cipitation to the east of 12–15◦E creates favorable conditions for aerosol accumulation, and, hence, for the increase of the aerosol loading over this area, compared with that over West-ern Europe and, especially, over the Atlantic coast. How-ever, one can see a slight reduce of aerosol loading over the regions located to the east of 30◦E due to the presence of snow cover there. The localτλmaxima over the polluted
ar-eas described above are getting much more pronounced with
Fig. 6.Monthly spatial distribution of climate meteorological parameters (wind characteristics and precipitation) according to NCEP CPC CAMS OPI data from the IRI/LDEO Climate Data Library, 1961–1990.
areas, which is characterized by the lack of precipitation. The beginning of agricultural activity, accompanied usually by the prescribed fires in the Eastern Europe, also creates ad-ditional source of fine-mode aerosol. Altogether these pro-cesses generate a distinct seasonalτλmaximum over Eastern
Europe. One can also see an increase of the area with high Angstrom parameter (α>1.4) over the continental areas in Eastern and Central Europe. Low precipitation and the ad-vection from Central European areas create favorable condi-tions to the accumulation of aerosol over Northern Europe and nearby North Sea area. The snow cover, which is still observed over this area, also reduces the uptake of aerosol by ground and contributes to the increase of the aerosol life-time in the atmosphere, thus creating a seasonal maximum in aerosol optical thickness over Northern Europe. Western Europe is under the influence of the nearby Atlantic ocean, which is characterized by higher precipitation leading to ac-tive wet removal of aerosol. The location of the area with
advection from the south are responsible for distinct local minimum in aerosol optical thickness over the vast territory to the north of 45◦N and to the east of 15◦E. In addition, this local τλ minimum can be attributed to comparatively high
water store in soil and vegetation, which can also prevent active mineral dust aerosol formation. At the same time, at the south and, especially, at the south-eastern areas (the eastern Mediterranean and western region of the Black sea) due to the lack of precipitation the processes of aerosol ac-cumulation are observed. In addition, the air advection from the east (from Asia Minor) provides an additional mineral dust aerosol (see Fig. 6), that was also described in (Kazad-sis et al., 2007). In addition, elevated temperatures and high photolysis rates in the presence of volatile organic precursors create favorable conditions for active generating there differ-ent kinds of fine mode biogenic and anthropogenic aerosols. We can see the increase in the area with fine mode parti-cles over the whole Europe, except its western part and the shores of the Mediterranean Sea, where the influence of the coarse mode sea-salt and mineral dust aerosols from deserts are dominating. As a result, the yearly maximum ofτ340∼0.9 (τ550∼0.4), which is the highest value recorded over Eu-rope, is observed over Northern Italy in June. InJulyaerosol optical thickness is very high over the Mediterranean area and nearby territories, especially over Balkan area: North-ern Greece, Bulgaria, Romania (the lowlands of the mid and low Danube areas) which can be characterized by additional generation of aerosol particles from anthropogenic emissions in conditions of high photolysis rates and elevated tempera-tures in the absence of wet removal of aerosol from the at-mosphere. The local aerosol maxima over the polluted ar-eas mentioned above are also observed. Like in June, one can see a dominating role of fine mode particles over the whole Europe, except areas nearby the Atlantic Ocean and the Mediterranean Sea. InAugustthe high aerosol loading over southern Europe is still observed due to the influence of the Azore anticyclone, which is characterized by hot and dry weather. At the same time, over the northern areas (higher 60◦N) one can see gradual decrease of aerosol optical thick-ness and Angstrom parameter. In summer, aerosol optical thickness undergoes the most strong spatial variability over Europe from the very low values over Skandinavia and Arctic ocean (τ340∼0.1,τ550∼0.05) to the very high ones over the Mediterranean south-eastern area of Europe (τ340∼0.7–0.9,
τ550∼0.3–0.4).
InSeptember lower temperatures and photolysis rates as well as the intensification of westerlies decrease the aerosol loading over the whole Europe area, except its south east-ern part. The local maximum, which is observed over the central regions of Eastern Europe (Russia, Belarus, Poland, Moldova), has been generated due to the strong impact of ex-treme forest and peatbog fires observed in 2002 near Moscow (Chubarova et al., 2009). However, there is a high probabil-ity of such conditions due to the drainage of peatbogs and overall air temperature increase. InOctoberfurther cleaning
of the atmosphere is observed over the whole territory of Eu-rope. This process is consistent with attenuation of theα val-ues over the vast area with a distinct tendency to decreasing towards the Atlantic Ocean. There are still the centers over the south-eastern part of Europe with the high Angstrom pa-rameter and the aerosol optical thickness. The location of the area with higher aerosol loading over central Europe (Czech Republic, Austria and nearby countries) corresponds well with the area with less precipitation. InNovemberthe aerosol optical thickness is quite low (τ340∼<0.2,τ550<0.12) over the whole European territory, except several local areas. The Angstrom parameter continues to decrease, that means fur-ther reduction of the area with the domination of the fine mode particles. Relatively high aerosol loading is observed over the Mediterranean area and, especially, over Northern Italy and the Balkan peninsula. The local area with high Angstrom parameter values (α>1.4) over the Balkan penin-sula might be attributed to the joint effect of favorable con-ditions for generating the biogenic as well as anthropogenic aerosols from both natural and industrial emissions. In De-cemberthe aerosol loading is the lowest in seasonal cycle due to the active removal of aerosol and the absence of its active generation in the atmosphere. However, the elevated aerosol optical thickness can be observed over several areas: the east-ern part of the Mediterranean, which is under the influence of mineral dust advection from the deserts, over the lowlands of the mid and low Danube areas, over the industrial zones in Northern Italy, etc. Theαvalues are also the lowest ones, and they are characterized by a pronounced increase towards the southeast. Unfortunately, it is impossible to retrieve the aerosol optical thickness over the large northern area due to bright snow conditions, where MODIS algorithm does not work properly. However, the data available from ground-based AERONET/PHOTONS network confirm the existence of low aerosol optical thickness over snow cover areas at the north.
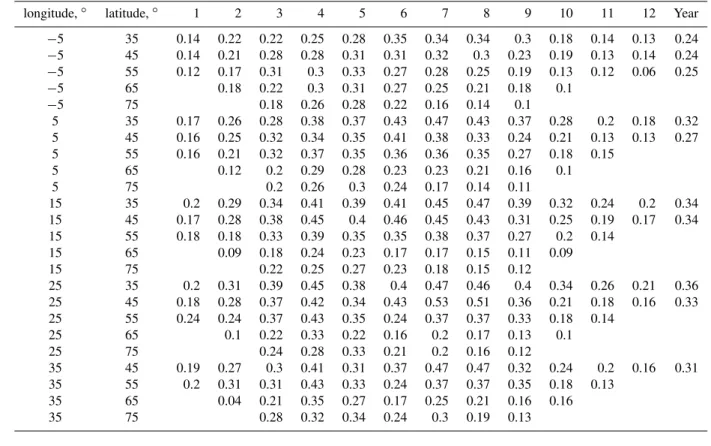
Table 1 presents monthly mean and yearly meanτ340over Europe averaged with 10×10◦grid over 10◦W–40◦E 30◦– 80◦N region. The data over Africa and Asia continents were excluded from the statistics. It summarizes the main features of seasonal behavior of aerosol optical thickness showed above.
It should be stated that the analysis of the aerosol sources and transport based on the wind and precipitation climatol-ogy can be considered as the first approach to explain the observed spatial distribution of aerosol optical thickness in Europe. The continuation of aerosol measurements together with model studies is necessary for better clarifying this is-sue.
3.3 Aerosol single scattering albedo and factor of asymmetry
Table 1. Monthly mean and yearly meanτ340 over Europe according to the developed MODIS/AERONET climatology averaged with 10×10 grid.
longitude,◦ latitude,◦ 1 2 3 4 5 6 7 8 9 10 11 12 Year
−5 35 0.14 0.22 0.22 0.25 0.28 0.35 0.34 0.34 0.3 0.18 0.14 0.13 0.24 −5 45 0.14 0.21 0.28 0.28 0.31 0.31 0.32 0.3 0.23 0.19 0.13 0.14 0.24 −5 55 0.12 0.17 0.31 0.3 0.33 0.27 0.28 0.25 0.19 0.13 0.12 0.06 0.25 −5 65 0.18 0.22 0.3 0.31 0.27 0.25 0.21 0.18 0.1
−5 75 0.18 0.26 0.28 0.22 0.16 0.14 0.1
5 35 0.17 0.26 0.28 0.38 0.37 0.43 0.47 0.43 0.37 0.28 0.2 0.18 0.32
5 45 0.16 0.25 0.32 0.34 0.35 0.41 0.38 0.33 0.24 0.21 0.13 0.13 0.27
5 55 0.16 0.21 0.32 0.37 0.35 0.36 0.36 0.35 0.27 0.18 0.15
5 65 0.12 0.2 0.29 0.28 0.23 0.23 0.21 0.16 0.1
5 75 0.2 0.26 0.3 0.24 0.17 0.14 0.11
15 35 0.2 0.29 0.34 0.41 0.39 0.41 0.45 0.47 0.39 0.32 0.24 0.2 0.34
15 45 0.17 0.28 0.38 0.45 0.4 0.46 0.45 0.43 0.31 0.25 0.19 0.17 0.34
15 55 0.18 0.18 0.33 0.39 0.35 0.35 0.38 0.37 0.27 0.2 0.14
15 65 0.09 0.18 0.24 0.23 0.17 0.17 0.15 0.11 0.09
15 75 0.22 0.25 0.27 0.23 0.18 0.15 0.12
25 35 0.2 0.31 0.39 0.45 0.38 0.4 0.47 0.46 0.4 0.34 0.26 0.21 0.36
25 45 0.18 0.28 0.37 0.42 0.34 0.43 0.53 0.51 0.36 0.21 0.18 0.16 0.33
25 55 0.24 0.24 0.37 0.43 0.35 0.24 0.37 0.37 0.33 0.18 0.14
25 65 0.1 0.22 0.33 0.22 0.16 0.2 0.17 0.13 0.1
25 75 0.24 0.28 0.33 0.21 0.2 0.16 0.12
35 45 0.19 0.27 0.3 0.41 0.31 0.37 0.47 0.47 0.32 0.24 0.2 0.16 0.31
35 55 0.2 0.31 0.31 0.43 0.33 0.24 0.37 0.37 0.35 0.18 0.13
35 65 0.04 0.21 0.35 0.27 0.17 0.25 0.21 0.16 0.16
35 75 0.28 0.32 0.34 0.24 0.3 0.19 0.13
0 0.1 0.2 0.3 0.4 0.5 0.6 0.7 0.8 0.9
1 2 3 4 5 6 7 8 9 10 11 12 month
aer
os
ol
opti
c
al
thi
c
k
nes
s
at
340nm
Hornsund Hornsund Longyearbyen Longyearbyen
0 0.1 0.2 0.3 0.4 0.5 0.6 0.7 0.8 0.9
1 2 3 4 5 6 7 8 9 10 11 12
month
aer
os
ol
opti
c
al
thi
c
k
nes
s
at
340nm
Gotland Gotland
Oostende Oostende
Moscow_MSU_MO Moscow_MSU_MO
Toravere Toravere
0 0.1 0.2 0.3 0.4 0.5 0.6 0.7 0.8 0.9
1 2 3 4 5 6 7 8 9 10 11 12 month
aeros
ol
opt
ic
al
t
h
ic
k
n
e
s
s
a
t
34
0 nm
Ispra Ispra
Thessaloniki Thessaloniki Carpentras Carpentras
(1)
(2)
(3)
τ
τ
°
°
°
°
°
°
°
°
°
°
°
°
°
°
°
°
°
°
Fig. 7. Seasonal differencesτ340in the arctic(1), temperate(2)and subtropical(3)climate zones. The MODISτ340retrievals are shown by solid lines and AERONET/PHOTONS data - by dotted lines. The coordinates of the sites: Hornsund (15.55◦E, 77◦N), Longyear-byen (15.649◦E 78.2◦N), Gotland (19.0◦E 57.9◦N), Moscow MSU MO (37.5◦E, 55.7◦N), Oostende (2.9◦E 51.2◦N), Toravere (26.5◦E, 58.3◦N), Ispra (8.6◦E, 45.8◦N), Carpentras (5.1◦E, 44.1◦N), Thessaloniki (23.0◦N, 40.6◦E).
UV estimates in the aerosol atmosphere. In our approach they were retrieved through the special inversion algorithm (Dubovik et al., 2000) developed for sun/sky CIMEL pho-tometers AERONET network. However, the method has some constraints. The most important ones are the existence of clear sky conditions during a series of observations and
high aerosol loading (τ440>0.4). As a result, during cold period over for the most of European territory there are no estimates of single scattering albedo due to low aerosol opti-cal thickness and dominating of cloudy conditions. Theωλ
0.6 0.65 0.7 0.75 0.8 0.85 0.9 0.95 1
Ja
n
Fe
b
Ma
rc
h
Ap
ri
l
Ma
y
Ju
ne
Jul
y
Au
g
Se
p
t
Oc
t
No
v
De
c
si
n
g
le
sca
tt
e
ri
ng
al
b
e
d
o
0.6 0.65 0.7 0.75 0.8 0.85
asym
m
e
tr
y f
a
ct
or
single scattering albedo asymmetry factor
ω Fig. 8. Month-to-month variations of single scattering albedo (ω440) and asymmetry factor (g440) according to CIMEL sun/sky photometer measurements over Europe. The confidence intervals are shown at 95% level.
in summer the statistics is quite poor: the data are avail-able from approximately 40–50 sites, which monthly aver-age values can be based sometimes only on 1–2 observations per month. The lack of statistics and the uncertainty of the
ωλretrievals (1ω=±0.03) do not allow us to generate
spa-tial distributions of these parameters. Instead, a study of their month-to-month variability has been conducted. The month-to-month variations of both single scattering albedo and factor of asymmetry at 440 nm retrieved, using a stan-dard AERONET algorithm, are shown in Fig. 8. No seasonal change in these characteristics could be detected at the 95% confidence level, except some small difference (about 0.01) in asymmetry factor values, which are higher in February, March and October. However, the difference is rather small and can be of random character that should be studied further. It should be emphasized that the absence of seasonal varia-tions in single scattering albedo, which has been obtained, corresponds to the situations with high aerosol loading, that is the constraint for theωretrieval procedure. At the same time, it is high aerosol loading that influences significantly the solar irradiance reaching the surface, while solar irradi-ance is not so sensitive to the changes inωat small aerosol optical thickness. Therefore, these retrievals can be chosen in the first approach for estimating UV irradiance in Europe. As a result, yearly mean single scattering albedo at 440 nm over European region is aboutω440=0.93 with standard de-viation of 0.03 varying from 0.77 to 0.99. Asymmetry factor comprises g440=0.71 with standard deviation of 0.02 varying from 0.58 to 0.79.
Then, it was necessary to make spectral adjustments and to re-evaluate single scattering albedo and asymmetry factor in UV range. This has been made with the application of Mie theory with accounting for the characteristics of volume par-ticle size distribution and refractive indices at 440 nm, which in turn are the standard products of AERONET CIMEL sun/sky photometer network. The assumption of the same values of refractive indices in visible and UV spectra will not
work properly in some cases, especially in smoke aerosol conditions (Chubarova et al., 2009). However, we can use this approximate approach due to the large statistics and the low frequency of fire smoke conditions in the overall dataset. As a result, the adjustment factors of1ω∼0.01 and of1g∼0.04 have been obtained to provide the average es-timates ofω∼0.94 and of g∼0.75 in the UV region of the spectrum. These values were taken as constants within the whole UV range. In order to obtain more accurate retrievals of these aerosol parameters one should use additional spec-tral or UV-MFRSR measurements and follow more sophisti-cated methods described, for example, in (Bais et al., 2005; Krotkov et al., 2005). Unfortunately, at present there is no spread network of these measurements to give good spatial distribution of these parameters.
3.4 Validation against measurements
The examination of the proposed method for evaluation the UV single scattering albedo and factor of asymmetry has been made by comparing model UV estimates with the ex-perimental data in clear sky conditions with different aerosol properties in Moscow. For this purpose a Troposphere Ultra-violet and Visible (TUV) radiative transfer model version 4.1 has been used (Madronich and Flocke, 1998) with 8 stream DISORT solver and pseudo spherical corrections.
The measurements of erythemally weighted irradiance (Qe) in Moscow State University Meteorological
Observa-tory are being carried out by broadband YES UVB-1 pyra-nometer (Chubarova, 2008). The instrument is regularly tested against the reference instrument, which in turn is regu-larly calibrated in erythemally-weighted units against the ul-traviolet spectroradiometer Bentham DTM-300 of the Medi-cal University of Innsbruck in 1999, 2005, 2008 (courtesy of M. Blumthaler). The additional corrections on solar zenith angle and ozone content are applied following the WMO rec-ommendations (Seckmeyer et al., 2006) and cosine charac-teristics of the instrument have been also taken into account. The clear sky conditions were chosen from hourly visual ob-servations. In addition, the account of typical NO2 gas ab-sorption, which is the most important absorber in Moscow conditions, has been considered in model calculations ac-cording to the available surface NO2 measurements com-bined with its model profile.
The comparisons of model and measured Qe at low
aerosol optical thickness (τ340<0.1), where the effects of uncertainty in single scattering albedo and factor of asym-metry are negligible, has revealed the existence of some model overestimation of about 6%. After taking this shift into consideration, we estimated the Qe loss due
a/. b/.
-60% -50% -40% -30% -20% -10% 0%
0 0.5 1 1.5 2
AOT 340
rel
at
ive U
V
I
l
o
ss
model, SSA=0.87 model SSA=0.94 measurements SSA=0.87 measurements SSA= 0.94 -60%
-50% -40% -30% -20% -10% 0% -60% -50% -40% -30% -20% -10% 0%
measurements
m
o
d
e
ll
in
g
Fig. 9. The comparison between model and measured erythemally-weighted irradiance losses in clear sky conditions with the values of single scattering albedo and factor of asymmetry derived from the AERONET dataset(a)and relative UV loss as a function of aerosol optical thickness at 340 nm(b). Moscow. Snow-free conditions.
scattering albedo (ω=0.8÷0.97) obtained from AERONET measurements according to the approach described above. One can see quite satisfactory agreement between modelled and measured Qe aerosol loss with correlation coefficient
r=0.91. Even in typical, non-smoke conditions the attenu-ation by aerosol can be very significant and exceed 50% due to comparatively smallωvalues and the episodes with high AOT loading. The effects of aerosol on UV attenuation based on spectral measurements as well as model simulations have been discussed in many papers (see, for example, Arola et al., 2003; Badosa et al., 2007; Balis et al., 2004; Fr¨uh et al., 2003; Jaroslawski and Krzy’scin, 2005; Krotkov et al., 2005, etc.). For most cases the agreement between model and observed values lies within 10%. This uncertainty can be observed due to non accounting in simulations for some aerosol properties, and due to possible effects of gas absorp-tion. However, aerosol optical thickness and single scatter-ing albedo remain the most important characteristics, which knowledge is essential for UV retrievals.
In addition, using model calculations a simple equation can been obtained to quantify the dependence of relativeQe
loss on aerosol optical thickness (forτ340<0.8), single scat-tering albedo (forω≥0.8), and airmass (form≤2):
1Qe
Qe
=τ340[(0.42m+0.93) ω+(−0.49m−0.97)]
R2=0.99 (3)
The equation in the brackets is the attenuation coefficient, which characterizes the attenuation atτ340=1 and is a func-tion of airmassmand single scattering albedoω. For typi-cal European summer conditions withω∼0.94 and atm=1.2, andτ340=0.4 this attenuation is about−0.08. The uncertainty of this equation is less than 1%, except the cases with high
aerosol loading and low single scattering albedo, when the uncertainty can reach 2–3%.
Our estimations have shown that the changes in asymme-try factor within±2σ lead to less than±1% variations in erythemally-weighted irradiance. Therefore it is possible not to use it as an independent parameter in the Eq. (3).
The effects of single scattering albedo on UV attenuation can be quite pronounced. Unfortunately, due to the lack of statistics it is impossible to generate the maps with spa-tial distribution of this characteristic. However, we evalu-ated the range of UV relative changes due to±2σ variations in single scattering albedo observed over Europe. The esti-mations were fulfilled for aerosol optical thickness averaged over 10×10◦ from Table 1 using the Eq. (3). As a result, mean uncertainty inQe attenuation due to single scattering
albedo is about 5% varying from 2 to 8%.
Figure 9b presents the dependence of relativeQe loss on
aerosol optical thickness. The data were combined into two groups with differentωvalues in order to test the ability of the proposed method to reveal the effects of single scattering albedo. One can see quite pronounced distinction due to dif-ferentωin both observed and modelled L values and a good agreement between their values. In conditions with relatively high single scattering albedo (ω∼0.94) theQeaerosol loss is
3.5 UV changes due to aerosol
The TUV model has been also applied for estimating the
Qe aerosol loss over Europe. Model simulations were
ful-filled for noon conditions (minimum solar zenith angle) in aerosol and in aerosol free situations. In addition, seasonal and spatial changes in total ozone content retrieved from TOMS ozone climatology dataset (http://jwocky.gsfc.nasa. gov/) have been also accounted.
Both relative and absolute changes of UV irradiance due to aerosol have been evaluated for central months of the sea-sons. The absolute changes due to aerosol are shown in UV indices (UVI) , which are defined by simple multiply-ing theQe(W/m2) by 40 (Vanicek et al., 2000). Figure 10a
presents a significant variation of monthly meanQerelative
losses over Europe due to aerosol loading, which lie within ∼−1–−17%. Here, theQe attenuation is mainly regulated
by aerosol optical thickness and has a small negative depen-dence on airmassm(see the Eq. 3). As a result, the most significantQe loss of about−15–17% was estimated over
Northern Italy in spring and in autumn due to high aerosol loading and lower solar elevations compared with summer conditions. The minimum Qe attenuation (>−3%) is
ob-served over the North Atlantic ocean, Scandinavia in autumn and in winter, where the aerosol loading is small (τ340∼0.1) and over some other clean regions like, for example, western coast of Spain in January. On average, there is a tendency of increasing theQe loss towards inner continental regions,
especially during warm period.
In winter, in spite of relatively small aerosol optical thick-ness, the Qe attenuation over Europe is quite pronounced
varying within−3–−10% and increases on 3–5% over urban polluted areas (i.e. the coast of Netherlands, south of Poland) and towards the south. It is necessary to note that due to relatively higher solar elevation over the Mediterranean area, compared with North Europe, the loss ofQe over the
pol-luted Northern Italy is not so large. In spring, due to the increase in aerosol loading one can see the enhancement of
Qeloss over the whole Europe. The attenuation ofQevaries
within−5–15% with a pronounced drop up to−15% over Central, Eastern and North-Eastern Europe. The distinct shifting of highQe loss to the north in spring, where the
aerosol optical thickness is not so high, is also attributed to smaller solar elevations there. In summer, the maximum loss inQereaching−10–−15% is observed at the southern and
south-eastern European areas including several local polluted regions like over the lowlands of the mid and low Danube ar-eas, Northern Italy, south of Poland, etc. In autumn, there is a pronounced decrease ofQe loss over the whole European
territory, and, especially over the north Atlantic area, except several polluted areas and, especially, Northern Italy.
Figure 10b represents the spatial distribution of abso-lute reduction in monthly meanUV indices (1UVI) due to aerosol over Europe. Since absolute UVI loss has a posi-tive correlation with both aerosol optical thickness and solar
elevation, one can see a different picture. Over the south-ern regions with high aerosol loading the1UVI is enhanced, while over northern areas, especially in winter, it is quite neg-ligible in spite of their relative significant loss. As a result, in winter a typical absolute decrease of UV indices due to aerosol varies from less than1UVI∼−0.1 over northern and central European territory to1UVI∼−0.3 over southern re-gions. However, significant changes in aerosol loading can provide large variations inUVI. For example, at the same lat-itude (∼40◦N) in spring the absoluteUVIdifference varies within the order of magnitude (from−0.1 to−1.0). In sum-mer the absoluteUVI loss can exceed−1.0 over the south-eastern areas, where the aerosol loading is extremely high. The maximum effect of aerosol is observed over Northern Italy, where the difference in UV indices due to aerosol load-ing can reach 1.5. At high latitudes, where the absolute level of UV irradiance is not so high, the absolute changes inUVI
also do not exceed 0.5. In autumn one can see typical de-crease of less than 0.5 over the whole Europe, except North-ern Italy, where aerosol optical thickness is still high.
4 Discussions and conclusions
In the paper we have shown that the combined MODIS/AERONET datasets can be used for the de-velopment of the UV aerosol climatology over Europe. The comparisons with direct ground-based CIMEL mea-surements at 340 nm have revealed the uncertainty of
1τ340=±0.05, which is much less than the seasonal τ340 variations over the most territory of Europe. (It should be noted that the same approach has been used for evaluating the aerosol optical thickness climatology at 308 nm over Europe within the frame of the COST726 project. The dataset can be found at the site www.cost726.org).
The analysis of aerosol optical thickness and Angstrom parameter spatial distribution over Europe has been carried out together with the analysis of meteorological fields, which have revealed several interesting features in seasonal and spa-tial distribution:
1. Increasing of the aerosol optical thickness from the north-west towards south-east is observed withτλ
max-ima during warm period. The existence of spring aerosol maximum over northern arctic areas has been confirmed. Summer τλ maximum is typical for the
western coastal zone of Europe as well as over the south and south-east European areas which, however, is much stronger. The bimodal seasonal distribution in aerosol optical thickness with spring and summer maxima and the pronounced drop ofτλ in June refers to the large
a.
b.
c.
d.
-30 -20 -10 0 10 20 30 40
30 40 50 60 70
-30 -20 -10 0 10 20 30 40
30 40 50 60 70
-30 -20 -10 0 10 20 30 40
30 40 50 60 70
-30 -20 -10 0 10 20 30 40
30 40 50 60 70
-30 -20 -10 0 10 20 30 40
30 40 50 60 70
-30 -20 -10 0 10 20 30 40
30 40 50 60 70
-30 -20 -10 0 10 20 30 40
30 40 50 60 70
-30 -20 -10 0 10 20 30 40
30 40 50 60 70
-2 to -1.5 -1.5 to -1 -1 to -0.5 -0.5 to -0.3 -0.3 to -0.1 -0.1 to 0
-25 to -20 -20 to -15 -15 to -10 -10 to -5 -5 to -3 -3 to 0
Legends:
∆
Fig. 10.Relative (in percent) attenuation (left) and absolute (dimensionless) reduction (right) of UV indices (1UVI) due to aerosol in January (a), April(b), July(c)and October(d)over Europe. Noon conditions.
local areas. The highest monthly mean aerosol optical thickness values (up toτ340∼0.9) have been obtained during warm period over several local areas mostly at the southern, south-eastern part of Europe.
features can be explained by joint effects of air advec-tion, lack of precipitation and vegetation activity, which determines the photochemical generation of different types of fine mode aerosol.
3. There have been revealed several local polluted centers with elevated aerosol optical thickness. The most signif-icant ones are located in Northern Italy, over the coast of the Netherlands, the southern regions of Poland (car-boniferous basin, and different industries), and , in sum-mer, over the lowlands of the mid and low Danube ar-eas. These areas are consistent with the areas with high concentration of PM2.5particles obtained from chemi-cal transport model LOTOS-EUROS.
The average estimates of single scattering albedo and asym-metry factor (ω∼0.94, g∼0.75) have been obtained in UV spectral region on the base on AERONET/PHOTONS re-trievals. No seasonal dependence has been revealed for these parameters. However, it should take into account the con-straints of the inversion method, which can be only applied for largeτλ.
Satisfactory agreement between UV measurements and model estimates in conditions with different aerosol prop-erties has confirmed a possibility of the retrievals of single scattering albedo and asymmetry factor from AERONET in-version products and its extrapolation to UV range using the Mie theory in the absence of fire conditions.
It should be emphasized that the obtained spatial distribu-tion of aerosol parameters can be used for the descripdistribu-tion of the latest period, since, as it is mentioned in the Introduction, there are the pronounced negative trends in aerosol optical thickness of about−0.04–0.05 per decade since 1980s.
The estimates of UV irradiance reduction due to aerosol have been obtained for different seasons. It has been shown that the absolute loss of UV indices due to a positive corre-lation with both aerosol optical thickness and solar elevation is most pronounced over southern areas. The1UVI varies from less than 0.1 over the northern areas in winter up to 1.5 over polluted areas at the south (Northern Italy). However, significant variations in1UVI (within the order of magni-tude) can be observed only due toτλvariations, especially at
the south of Europe.
The analysis of relative changes inQe due to aerosol has
revealed large spatial and temporal variations within∼−1– −17% with minimumQe attenuation (>−3%) during cold
period over the North Atlantic area, Scandinavia, etc. The most significantQe loss (−15–−17%) was estimated over
Northern Italy in spring and in autumn due to high aerosol loading and lower solar elevations compared with summer conditions. In winter theQeattenuation over Europe varies
within 10% and increases on 3–5% over the polluted cen-ters. In spring and summerQe attenuation can reach−10–
15% over the Central, Eastern and North-Eastern Europe. In autumn, there is a pronounced decrease inQeloss over the
whole European territory, except Northern Italy.
Due to the existence of different dependence on solar el-evation one can see a pronounced shift to the north for the relativeQe attenuation and to the south for the absoluteQe
attenuation.
The effects of aerosol loading on UV irradiance can be compared with total ozone influence. The same aerosol loading at high latitudes can provide much stronger relative changes inQe while there is vice versa situation with total
ozone, which has less effects onQeat low elevations (high
latitudes) than at low latitudes (see, for example, Fioletov et al., 2001). In other words, in spring at high latitudes the po-tential UVI growth due to the total ozone decrease can be much more effectively cancelled by the aerosol loading. In addition, at high latitudes theQe variations due to aerosol
are much more pronounced and can significantly influence theQeyear-to-year variability, that should be taken into
ac-count while revealing the ozone component inQelong-term
trend. This is possible to fulfill, using spectral measurements as described for example, in Glandorf et al. (2004).
Acknowledgements. The paper was inspired by the tasks of the COST 726 Action “Long term changes and climatology of UV radiation over Europe”. The author wishes to thank the MODIS and AERONET/PHOTONS aerosol team for support in accessing and using their data products. I would like to thank the PI investigators of the AERONET/PHOTONS and their staff for establishing and maintaining all the sites over Europe and nearby territories, which were used in this investigation. MODIS data were produced with the Giovanni online data system, developed and maintained by the NASA Goddard Earth Sciences (GES) Data and Information Services Center (DISC). The work has been partially supported by the RSFBR grants #07-05-00860, and #09-05-00582.
Edited by: A. A. Kokhanovsky
References
Andreae, M. O. and Crutzen, P. J.: Atmospheric Aerosols: Biogeo-chemical Sources and Role in Atmospheric Chemistry, Science, 276, 1052–1058, 1997.
Arola, A., Lakkala, K., Bais, A., Kaurola, J., Meleti, C., and Taalas, P.: Factors affecting short- and long-term changes of spectral UV irradiance at two European stations, J. Geophys. Res., 108(D17), 4549, doi:10.1029/2003JD003447, 2003.
Badosa, J., McKenzie, R. L., Kotkamp, M., Calb´o, J., Gonz´alez, J. A., Johnston, P. V., O’Neill, M., and Anderson, D. J.: Towards closure between measured and modelled UV under clear skies at four diverse sites, Atmos. Chem. Phys., 7, 2817–2837, 2007, http://www.atmos-chem-phys.net/7/2817/2007/.
Bais, A. F., Kazantzidis, A., Kazadzis, S., Balis, D. S., Zerefos, C. S., and Meleti, C.: Deriving an effective aerosol single scatter-ing albedo from spectral surface UV irradiance measurements, Atmos. Environ., 39(6), 1093–1102, 2005.
during EARLINET, Atmos. Chem. Phys., 4, 307–321, 2004, http://www.atmos-chem-phys.net/4/307/2004/.
Chubarova, N. Y. and Sviridenkov, M. A.: The differences in opti-cal thicknesses due to aerosol and NO2signatures obtained from parallel CIMEL sun photometers measurements in Moscow and at Zvenigorod, Preprint of IAE-6506/16, The Publishing House of Russian Research Centre “Kurchatov Institute”, Moscow, 45– 51, 2008.
Chubarova, N. Y., Nezval, Y. I., Verdebout, J., Krotkov, N., and Herman, J.: Long-term UV irradiance changes over Moscow and comparisons with UV estimates from TOMS and METEOSAT, in: Ultraviolet Ground- and Space-based Measurements, Mod-els, and Effects V, edited by: Bernhard, G., Slusser, J.R., Her-man, J.R., and Gao, W., SPIE, 63–73, 2005.
Chubarova, N. Y., Prilepsky, N. G., Rublev, A. N., and Riebau, A. R.: A Mega-Fire Event in Central Russia: Fire Weather, Ra-diative, and Optical Properties of the Atmosphere, and Conse-quences for Subboreal Forest Plants, in: Developments in En-vironmental Science, edited by: Bytnerowicz, M., Arbaugh, A., Riebau, A., and Andersen, C., Elsevier B. V., Volume 8 249 A, 249–267, 2009.
Chubarova, N. Y.: UV variability in Moscow according to long-term UV measurements and reconstruction model, Atmos. Chem. Phys., 8, 3025–3031, 2008,
http://www.atmos-chem-phys.net/8/3025/2008/.
Denman, K. L., Brasseur, G., Chidthaisong, A., Ciais, P., Cox, P. M., Dickinson, R. E., Hauglustaine, D., Heinze, C., Holland, E., Jacob, D., Lohmann, U., Ramachandran, S., da Silva Dias, P. L., Wofsy, S. C., and Zhang, X.: Couplings Between Changes in the Climate System and Biogeochemistry, in: Climate Change 2007: The Physical Science Basis, Contribution of Working Group I to the Fourth Assessment Report of the Intergovernmental Panel on Climate Change, edited by: Solomon, S., Qin, D., Manning, M., Chen, Z., Marquis, M., Averyt, K. B., Tignor, M., and Miller, H. L., Cambridge University Press, Cambridge, UK and New York, NY, USA, 2007.
Dubovik, O. and King, M. D.: A flexible inversion algorithm for retrieval of aerosol optical properties from Sun and sky radiance measurements, J. Geophys. Res., 105(D16), 20673–20696, 2000. Dubovik, O., Smirnov, A., Holben, B. N., King, M. D., Kauf-man, Y. J., Eck, T. F., and Slutsker, I.: Accuracy assessments of aerosol optical properties retrieved from Aerosol Robotic Net-work (AERONET) Sun and sky radiance measurements, J. Geo-phys. Res., 105(D8), 9791–9806. 2000.
Dubovik, O., Holben, B. N., Eck, T. F., Smirnov, A., Kaufman, Y. J., King, M. D., Tanre, D., and Slutsker, I.: Variability of ab-sorption and optical properties of key aerosol types observed in worldwide locations, J. Atmos. Sci., 59, 590–608, 2002. Eck, T., Holben, B., Reid, J., Dubovik, O., Smirnov, A., O’Neill,
N., Slutsker, I., and Kinne, S.: Wavelength dependence of the optical depth of biomass burning, urban, and desert dust aerosols, J. Geophys. Res., 104(D24), 31333–31349, 1999.
Fioletov, V., McArthur, L., Kerr, J., and Wardle, D.: Long-term vari-ations of UV-B irradiance over Canada estimated from Brewer observations and derived from ozone and pyranometer measure-ments, J. Geophys. Res., 106(D19), 23009–23027, 2001. Fr¨uh, B., Eckstein, E., Trautmann, T., Wendisch, M., Fiebig,
M., and Feister, U.: Ground-based measured and calculated spectra of actinic flux density and downward UV irradiance
in cloudless conditions and their sensitivity to aerosol mi-crophysical properties, J. Geophys. Res., 108(D16), 4509, doi:10.1029/2002JD002933, 2003.
Glandorf, M., Arola, A., Bais, A., and Seckmeyer, G.: Possibilities to detect trends in spectral UV irradiance, Theor. Appl. Climatol., 81(1–2), 33–44, 2005.
Gorbarenko, E. V., Yerokhina, E., and Lukin, A. B.: Long- Period changes in Aerosol Optical Thickness of the Atmosphere in Rus-sia, Russ. Meteorol. Hydrol., 7, 25–31. 2006.
Holben, B. N., Eck, T. F., Slutsker, I., Tanre, D., Buis, J. P., Set-zer, A., Vermote, E., Reagan, J. A., Kaufman, Y. J., Nakajima, T., Lavenu, F., Jankowiak, I., and Smirnov, A.: AERONET – A federated instrument network and data archive for aerosol char-acterization, Remote Sens. Environ., 66, 1–16, 1998.
IPCC Climate Change 2007: The Physical Science Basis, Con-tribution of Working Group I to the Fourth Assessment Report of the Intergovernmental Panel on Climate Change, edited by: Solomon, S., Qin, D., Manning, M., Chen, Z., Marquis, M., Av-eryt, K. B., Tignor, M., and Miller, H. L., Cambridge University Press, Cambridge, UK and New York, NY, USA, 2007. Janowiak, J. E. and Xie, P.: CAMS OPI: A Global Satellite-Rain
Gauge Merged Product for Real-Time Precipitation Monitoring Applications, J. Climate, 12, 3335–3342, 1999.
Kalnay, E., Kanamitsu, M., Kistler, R., Collins, W., Deaven, D., Gandin, L., Iredell, M., Saha, S., White, G., Woollen, J., Zhu, Y., Leetmaa, A., Reynolds, B., Chelliah, M., Ebisuzaki, W., Higgins, W., Janowiak, J., Mo, K. C., Ropelewski, C., Wang, J., Jenne, R., and Joseph, D.: The NCEP/NCAR 40-Year Reanalysis Proct, B. Am. Meteorol. Soc., March, 1996.
Jaroslawski, J. P. and Krzy’scin, J. W.: Importance of aerosol variations for surface UV-B level: Analysis of ground-based data taken at Belsk, Poland, 1992–2004, J. Geophys. Res., 110, D16201, doi:10.1029/2005JD005951, 2005.
Kazadzis, S., Bais, A., Amiridis, V., Balis, D., Meleti, C., Kouremeti, N., Zerefos, C. S., Rapsomanikis, S., Petrakakis, M., Kelesis, A., Tzoumaka, P., and Kelektsoglou, K.: Nine years of UV aerosol optical depth measurements at Thessaloniki, Greece, Atmos. Chem. Phys., 7, 2091–2101, 2007,
http://www.atmos-chem-phys.net/7/2091/2007/.
Koukouli, M. E., Kazadzis, S., Amiridis, V., Ichoku, C., and Balis, D. S.: Comparisons of Satellite Derived Aerosol Optical Depth Over a Variety of Sites in the Southern Balkan Region as an In-dicator of Local Air Quality, Remote Sensing of Clouds and the Atmosphere XII, edited by: Comer´on, A., Picard, R. H., Sch¨afer, K., Slusser, J. R., and Amodeo, A., Proc. of SPIE, 67451V-1,, doi:10.1117/12.737681, 2007.
Krotkov, N., Bhartia, P. K., Herman, J., Slusser, J., Scott, G., Labow, G., Vasilkov, A. P., Eck, T. F., Dubovik, O., and Holben, B. N.: Aerosol ultraviolet absorption experiment (2002 to 2004), part 2: absorption optical thickness, refractive index, and single scat-tering albedo, Opt. Eng., 44, 041005; doi:10.1117/1.1886819, 2005.
Madronich, S. and Flocke, S.: The role of solar radiation in at-mospheric chemistry, in: Handbook of environmental chemistry, Springer-Verlag, Heidelberg, 1–26, 1998.
McKenzie, R., Seckmeyer, G., Bais, A. F., Kerr, J. B., and Madronich, S.: Satellite retrievals of erythemal UV dose com-pared with ground-based measurements at northern and southern midlatitudes, J. Geophys. Res., 106, 24051–24062, 2001. Myachkova, N. A.: Climates of the USSR, Moscow University
Pub-lishing House, 192, 1983.
Remer, L. A., Kleidman, R. G., Levy, R. C., Kaufman, Y. J., Tanr´e, D., Mattoo, S., Martins, J. V., Ichoku, C., Koren, I., Yu, H., and Holben, B. N.: Global aerosol climatology from the MODIS satellite sensors, J. Geophys. Res., 113, D14S07, doi:10.1029/2007JD009661, 2008.
Ruckstuhl, C., Philipona, R., Behrens, K., Coen, M., Du¨rr, B., Heimo, A., Ma¨tzler, C., Nyeki, S., Ohmura, A., Vuilleumier, L., Weller, M., Wehrli, C., and Zelenka, A.: Aerosol and cloud ef-fects on solar brightening and the recent rapid warming Geophys-ical Research Letters, 35, L12708, doi:10.1029/2008GL034228, 2008.
Schaap, M., Renske, M. A., Timmermans, R. M. A., Roemer, M., Boersen, G. A. C., Builtjes, P., Sauter, F., Velders, G., and Beck, J.: The LOTOS-EUROS model: description, validation and latest developments, Int. J. Environ. Pollut., 32(2), 270–290, 2008.
Seckmeyer, G., Bais, A., Bernhard, G., Blumthaler, M., Booth, C. R., Lantz, K., and McKenzie, R. L.: Instruments to measure so-lar ultraviolet irradiance, Part 2: Broadband instruments measur-ing erythemally weighted solar irradiance, WMO, Global Atmo-spheric Watch No. WMO TD, 1289, 51, 2006.
Smirnov, A., Holben, B. N., Kaufman, Y. J., Dubovik, O., Eck, T. F., Slutsker, I., Pietras, C., and Halthore, R.: Optical Properties of Atmospheric Aerosol in Maritime Environments, J. Atmos. Sci., 59, 501–523, 2002.
Smirnov, A., Holben, B. N., Dubovik, O., O’Neill, N. T., Remer, L. A., Eck, T. F., Slutsker, I., and Savoie, D.: Measurement of atmospheric optical parameters on US Atlantic coast sites, ships and Bermuda during TARFOX, J. Geophys. Res., 105, 9887– 9901, 2000.
Torres, O., Bhartia, P. K., Herman, J. R., Sinyuk, A., Ginoux, P., and Holben, B.: A long-term record of aerosol optical depth from TOMS observations and comparison to AERONET mea-surements, J. Atmos. Sci., 59, 398–413, 2002.
Van der Leun, J. C., Tang, X., and Tevini, M.: Environmental ef-fects of ozone depletion 1998 Assessment, Executive summary, in the book “Environmental effects of ozone depletion 1998 As-sessment”, J. Photoch. Photobio. B, 46, 103, 1998.