ACPD
14, 23913–23947, 2014Sources of humic-like substances in the
Pearl River Delta
B. Y. Kuang et al.
Title Page
Abstract Introduction
Conclusions References
Tables Figures
◭ ◮
◭ ◮
Back Close
Full Screen / Esc
Printer-friendly Version Interactive Discussion
Discussion
P
a
per
|
Discus
sion
P
a
per
|
Discussion
P
a
per
|
Discussion
P
a
per
|
Atmos. Chem. Phys. Discuss., 14, 23913–23947, 2014 www.atmos-chem-phys-discuss.net/14/23913/2014/ doi:10.5194/acpd-14-23913-2014
© Author(s) 2014. CC Attribution 3.0 License.
This discussion paper is/has been under review for the journal Atmospheric Chemistry and Physics (ACP). Please refer to the corresponding final paper in ACP if available.
Sources of humic-like substances in the
Pearl River Delta, China: positive matrix
factorization analysis of PM
2.5
major
components and source markers
B. Y. Kuang1, P. Lin1, X. H. H. Huang2, and J. Z. Yu1,2
1
Department of Chemistry, Hong Kong University of Science and Technology, Clear Water Bay, Kowloon, Hong Kong, China
2
Institute of Environment, Hong Kong University of Science and Technology, Clear Water Bay, Kowloon, Hong Kong, China
Received: 15 August 2014 – Accepted: 4 September 2014 – Published: 16 September 2014
Correspondence to: J. Z. Yu (jian.yu@ust.hk)
ACPD
14, 23913–23947, 2014Sources of humic-like substances in the
Pearl River Delta
B. Y. Kuang et al.
Title Page
Abstract Introduction
Conclusions References
Tables Figures
◭ ◮
◭ ◮
Back Close
Full Screen / Esc
Printer-friendly Version Interactive Discussion
Discussion
P
a
per
|
Discus
sion
P
a
per
|
Discussion
P
a
per
|
Discussion
P
a
per
|
Abstract
HUmic-LIke Substances (HULIS), the hydrophobic part of water soluble organic carbon (WSOC), account for a significant fraction of PM2.5 mass. Their source studies are so
far largely qualitative. In this study, HULIS and WSOC were determined in 100 PM2.5 samples collected in 2009 at an urban site (Guangzhou) and a suburban site (Nansha)
5
in the Pearl River Delta in South China. The annual average concentration of HULIS was 4.83 and 4.71 µg m−3, constituting 8.5 and 10.2 % of the PM2.5mass, while HULIS-C (the carbon component of HULIS) contributed 48 and 57 % of WSOHULIS-C at the two sites, respectively. HULIS was found to correlate with biomass burning (BB) tracers (i.e., lev-oglucosan and K) and secondary species (e.g., sulfate and ammonium), suggesting its
10
association with BB emissions and secondary formation processes. Sources of HULIS were investigated using positive matrix factorization analysis of PM2.5chemical
compo-sition data, including major components and source markers. In addition to secondary formation process and BB emissions, residual oil combustion related to shipping was identified for the first time as a significant source of HULIS. Secondary formation
pro-15
cess contributed the most, accounting for 49–82 % of ambient HULIS at the two sites in different seasons. BB emissions contributed a seasonal average of 8–28 %, with more contributions observed in the winter months (November–February) due to crop residue burning during harvest season. Residual oil combustion was revealed to be an impor-tant source at the suburban site in summer (44 % of HULIS-C) due to its proximity to
20
one of the ports and the shipping lane in the region. Vehicle emissions were found to contribute little to HULIS but had contributions to the hydrophilic WSOC fraction. The contrast in contributions from different combustion sources to HULIS and hydrophilic WSOC suggests that primary sources of HULIS are linked to inefficient combustion. This source analysis suggests further study of HULIS be focused on secondary
forma-25
ACPD
14, 23913–23947, 2014Sources of humic-like substances in the
Pearl River Delta
B. Y. Kuang et al.
Title Page
Abstract Introduction
Conclusions References
Tables Figures
◭ ◮
◭ ◮
Back Close
Full Screen / Esc
Printer-friendly Version Interactive Discussion
Discussion
P
a
per
|
Discus
sion
P
a
per
|
Discussion
P
a
per
|
Discussion
P
a
per
|
1 Introduction
HUmic-LIke Substances (HULIS) is a mixture of organic species extracted from atmo-spheric aerosol particles with characteristics similar to humic and fulvic acids (Graber and Rudich, 2006). It is operationally defined by procedures used for its isolation from the bulk water-soluble aerosol components by removing inorganic salts and
low-5
molecular weight hydrophilic organic compounds (e.g., oxalate). HULIS is therefore the hydrophobic part of water soluble organic carbon (WSOC). Solid phase extrac-tion (SPE) methods have been widely used to isolate HULIS (e.g., Varga et al., 2001; Lin et al., 2010a, b). The advantage of SPE is the collection of the pure organic frac-tion, facilitating subsequent characterization of the chemical and physical properties
10
of HULIS. Other methods have also been utilized, such as capillary electrophoresis (Havers et al., 1998a), ultrafiltration (Havers et al., 1998b), ion-exchange chromatogra-phy (Decesari et al., 2000), and size-exclusion chromatograchromatogra-phy (Krivacsy et al., 2000; Samburova et al., 2005a, b).
HULIS is a significant component of particulate matter (PM) (Lin et al., 2010a). It
15
accounted for around half or more of WSOC in previous studies (e.g., Krivacsy et al., 2008). Due to its abundant presence and its affinity for water, HULIS plays an important role in the atmosphere by affecting the hygroscopic growth of aerosols and reducing surface tension (Kiss et al., 2005; Dinar et al., 2006; Graber and Rudich, 2006). HULIS could also be an important contributor to light absorption by particles in the atmosphere
20
(Hoffer et al., 2006; Lukacs et al., 2007). More recently, HULIS has been demonstrated to be redox-active. It catalyzes the generation of reactive oxygen species under simu-lated physiological conditions, thereby likely contributing to PM-induced health effects (Lin and Yu, 2011; Verma et al., 2012).
Previous studies have identified biomass burning (BB) (Mayol-Bracero et al., 2002;
25
ACPD
14, 23913–23947, 2014Sources of humic-like substances in the
Pearl River Delta
B. Y. Kuang et al.
Title Page
Abstract Introduction
Conclusions References
Tables Figures
◭ ◮
◭ ◮
Back Close
Full Screen / Esc
Printer-friendly Version Interactive Discussion
Discussion
P
a
per
|
Discus
sion
P
a
per
|
Discussion
P
a
per
|
Discussion
P
a
per
|
best of our knowledge, there is not yet a quantitative source apportionment study of HULIS. The objective of this study is to identify major sources of HULIS and quantify their contributions in PM2.5samples in the Pearl River Delta (PRD). The approach taken
is through positive matrix factorization (PMF) analysis of PM2.5 chemical composition data including inorganic and organic tracers for key sources.
5
2 Experimental section
2.1 Aerosol sampling
Ambient aerosol samples were collected at an urban site (GZ: Guangzhou) and a sub-urban site (NS: Nansha) in PRD (Fig. 1). The GZ site (23◦7′51.08′′N, 113◦17′51.19′′E) is located on the roof of the Guangdong Meteorology Bureau building in downtown
10
Guangzhou. The NS site (22◦45′08.90′′N, 113◦36′09.17′′E) is located in the middle of the PRD, 50 km south of the GZ site and∼15 km north of Nansha Port. NS is situated
at the estuary of the Pearl River on the shipping lane from Hong Kong/Shenzhen to Guangzhou Downtown Port (Fig. 1).
Twenty-four-hour PM2.5 sampling was conducted at each site once every 6 days
15
throughout the year of 2009. A MetOne SASS (Speciation Air Sampling System) mid-volume sampler was used at each site to collect aerosols onto one Teflon, one Nylon and three pre-baked quartz filters through five separate sampling channels. A high-volume aerosol sampler (TE-6070V-BL, Tisch Environmental Inc., USA) was employed at each site to collect PM2.5samples on prebaked quartz filters. The Teflon, nylon, and 20
ACPD
14, 23913–23947, 2014Sources of humic-like substances in the
Pearl River Delta
B. Y. Kuang et al.
Title Page
Abstract Introduction
Conclusions References
Tables Figures
◭ ◮
◭ ◮
Back Close
Full Screen / Esc
Printer-friendly Version Interactive Discussion
Discussion
P
a
per
|
Discus
sion
P
a
per
|
Discussion
P
a
per
|
Discussion
P
a
per
|
2.2 Chemical analysis
Chemical species analysed in the PM2.5samples include nine ionic species (Cl
−
, NO−3, SO24−, oxalate, Na+, NH+4, K+, Mg2+, and Ca2+), EC, OC, elements (Al, Si, K, Ca, Ti, V, Mn, Fe, Ni, Zn, Pb), HULIS, WSOC, three sugar compounds (levoglucosan, mannosan, and galactosan), and hopanes. Ionic species were quantified using an ion
chromatog-5
raphy (IC) system (DX500, Dionex, Sunnyvale, CA, USA), and the experimental details were reported in our earlier papers (Yang et al., 2005; Lin et al., 2010a). EC and OC were determined using a thermal/optical transmittance aerosol carbon analyser (Sun-set Laboratory, Tigard, OR, USA) and the analysis protocol followed the ACE-Asia protocol, which is derived from the better known NIOSH protocol (Wu et al., 2012).
Ele-10
ments were measured using an X-ray fluorescence (XRF) spectrometer (Huang et al., 2014).
For the analysis of WSOC and HULIS, portions of the quartz filters were extracted using ultrapure water (>18 MΩcm) with the ratio of 1 mL water per 1 cm2filter. The ex-tracts were filtered with a 0.45 µm Teflon filter (Millipore, Billerica, MA, USA) to remove
15
insoluble materials before analysis. The WSOC content was determined using a TOC analyser equipped with a non-dispersive infrared (NDIR) detector (Shimadzu TOC-VCPH, Japan). The detector response was calibrated with standard solutions of sucrose.
Water-insoluble OC (WISOC) is then calculated to be the difference between OC and WSOC. The quantification of HULIS was described in detail in our previous studies
20
(Lin et al., 2010a, b). Briefly, the HULIS fraction was isolated from the bulk aerosol wa-ter extract using a SPE cartridge (Oasis HLB, 30 µm, 60 mg/cartridge, Wawa-ters, USA). HULIS was retained on the SPE cartridge while the majority of inorganic ions, low molecular weight organic acids, and sugars were not retained. The HULIS fraction was then eluted from the SPE cartridge with methanol containing 2 % (w/w) NH3, followed 25
ACPD
14, 23913–23947, 2014Sources of humic-like substances in the
Pearl River Delta
B. Y. Kuang et al.
Title Page
Abstract Introduction
Conclusions References
Tables Figures
◭ ◮
◭ ◮
Back Close
Full Screen / Esc
Printer-friendly Version Interactive Discussion
Discussion
P
a
per
|
Discus
sion
P
a
per
|
Discussion
P
a
per
|
Discussion
P
a
per
|
HULIS-C was calculated from HULIS mass divided by a factor of 1.9, as determined in previous studies (Kiss et al., 2002; Lin et al., 2010b). We note that HULIS-C in con-centration unit of µg C m−3, instead of HULIS mass concentration (µg m−3) was used as input in the PMF analysis and consequently the source apportionment results are in reference to HULIS-C.
5
The concentrations of levoglucosan, mannosan, and galactosan were measured by high-performance anion-exchange chromatography (HPAEC) with a pulsed ampero-metric detection (PAD) method (Engling et al., 2006). The measurement was carried out on a Dionex DX-500 series ion chromatograph (Sunnyvale, CA, USA), consisting of a LC30 Chromatography Oven, a GP40 Gradient Pump, and an ED40 Electrochemical
10
Detector (with an Electrochemical Cell and a conventional gold electrode). The sepa-ration was achieved on a Dionex CarboPac PA10 analytical column (4×250 mm) with aqueous sodium hydroxide (NaOH) as eluent at a flow rate of 0.5 mL min−1 (Engling et al., 2006). The chromatographic conditions were: 10 % of aqueous solution contain-ing 180 mM NaOH (A) and 90 % of ultrapure water (B) for 10 min; eluate A increased
15
from 10 to 70 % in 20 min, then from 70 to 100 % in 0.1 min and maintained at 100 % for 9 min to wash the electrode. At the end of the analysis cycle, eluate A was decreased to 10 % in 0.1 min and kept at 10 % for 14 min to condition the column for the next sample. The detector was operated in integrating amperometric mode and its response was calibrated by authentic standards of the three sugars.
20
Hopanes, together with other nonpolar organic compounds (i.e., alkanes, polycyclic aromatic compounds), were quantified using a method that couples in-injection port thermal desorption with Gas Chromatography/Mass Spectrometric (TD-GC/MS) detec-tion (Ho and Yu, 2004; Ho et al., 2008). A 2 cm2filter punch from each filter collected with the high-volume samplers was removed and used in the TD-GC/MS analysis.
25
ACPD
14, 23913–23947, 2014Sources of humic-like substances in the
Pearl River Delta
B. Y. Kuang et al.
Title Page
Abstract Introduction
Conclusions References
Tables Figures
◭ ◮
◭ ◮
Back Close
Full Screen / Esc
Printer-friendly Version Interactive Discussion
Discussion
P
a
per
|
Discus
sion
P
a
per
|
Discussion
P
a
per
|
Discussion
P
a
per
|
2.3 PMF analysis
PMF has been used to identify and apportion sources of ambient aerosols in Hong Kong (Lee et al., 1999; Yuan et al., 2006a, b; Hu et al., 2010) and other locations around the world (e.g., Maykut et al., 2003; Kim and Hopke, 2004; Liu et al., 2005; Shrivastava et al., 2007; Wagener et al., 2012). EPA PMF 3.0 (Norris et al., 2008; Kim
5
and Hopke, 2007; Kim et al., 2010) was used in this study. PMF relies on source trac-ers to associate resolved factors with known sources or processes. A total of 27 fitting species are used as input observable parameters, including HULIS-C, WSOC_h, three sugar species (levoglucosan, mannosan, and galactosan), hopane, norhopane, EC, OC, seven major ions (SO24−, NO−3, Cl−, oxalate, NH+4, Na+, and Mg2+), and eleven
el-10
ements (Al, Si, K, Ca, Ti, V, Mn, Fe, Ni, Zn, Pb). Elements K and Ca measured by XRF were used as PMF inputs because of better accuracy than ionic K+and Ca2+measured with the IC system. Levoglucosan is a tracer highly specific for BB emissions (Simoneit et al., 1999; Nolte et al., 2001; Engling et al., 2006). It has been widely used to es-timate the contributions of BB emission to ambient aerosols in source apportionment
15
studies (e.g., Wang et al., 2007; Holden et al., 2011; Harrison et al., 2012). Hopane and norhopane are specific tracers for vehicle emissions (e.g., Simoneit et al.,. 1984). Sulfate is a marker species for secondary formation processes (e.g. Yu et al., 2005; Huang et al., 2006). Na+ and Mg2+ are tracers for sea salt aerosols. Ni and V are often used as tracers of ship emissions (Guo et al., 2009; Mooibroek et al., 2011). Al, Ca
20
and Fe are components of crustal materials, tracking dust aerosols (Zota et al., 2009; Khan et al., 2012).
The uncertainties for individual species were calculated as (Si j+DL/3), whereSi j is the analytical uncertainty of the species j in ith sample and DL is method detection limit (Reffet al., 2007). For data below their respective DLs, the concentration was set
25
to be 0.5×DL and the corresponding uncertainty was set at (5/6)×DL (Polissar et al.,
ACPD
14, 23913–23947, 2014Sources of humic-like substances in the
Pearl River Delta
B. Y. Kuang et al.
Title Page
Abstract Introduction
Conclusions References
Tables Figures
◭ ◮
◭ ◮
Back Close
Full Screen / Esc
Printer-friendly Version Interactive Discussion
Discussion
P
a
per
|
Discus
sion
P
a
per
|
Discussion
P
a
per
|
Discussion
P
a
per
|
3 Results and discussion
3.1 Overview of the concentrations of aerosol speciation
Table 1 shows the statistic summary for the concentrations of species measured for the PMF analysis in a total of 100 samples collected in 2009. Among them, 51 were collected from GZ and 49 were from NS. The individual sampling days are listed in
5
Supplement Table S1, together with the concentrations of PM2.5, WSOC and HULIS in each sample.
3.1.1 Major PM2.5components
Sulfate, ammonium and oxalate are mainly from secondary formation processes. Their average concentrations were comparable at GZ and NS. The average concentration of
10
EC was higher in GZ (2.89±1.66 µg C m−3) than in NS (2.12±1.11 µg C m−3). This is
consistent with the characteristics of the two sites and the fact that EC is mainly from vehicular emissions in urban areas. GZ is an urban site and the influence of vehicular emissions is more prominent than NS, the suburban site.
3.1.2 WSOC and HULIS
15
The concentrations of OC and WSOC were both higher at GZ than NS (Table 1). Annual average concentrations of OC were 12.22 and 9.13 µg C m−3 in GZ and NS, and average concentrations of WSOC were 4.86 and 3.94 µg C m−3in GZ and NS, re-spectively. Figure 2 shows the temporal variation of the three sub-components of OC (i.e., WSOC_h, HULIS-C, and WISOC) and the fraction of WSOC in OC. WSOC was
20
a significant fraction of OC, accounting for as high as 61 % of OC at GZ and 96 % at NS. On annual average, WSOC made up 41.1±9.3 % of OC in GZ and 47.1±15.6 % of OC in NS. The slightly higher WSOC proportion at NS than GZ was consistent with their suburban and urban location characteristics, respectively. Obvious seasonal variation of WSOC was observed for both sites, as shown in the time series plots
ACPD
14, 23913–23947, 2014Sources of humic-like substances in the
Pearl River Delta
B. Y. Kuang et al.
Title Page
Abstract Introduction
Conclusions References
Tables Figures
◭ ◮
◭ ◮
Back Close
Full Screen / Esc
Printer-friendly Version Interactive Discussion
Discussion
P
a
per
|
Discus
sion
P
a
per
|
Discussion
P
a
per
|
Discussion
P
a
per
|
of the two components of WSOC (i.e., HULIS-C and WSOC_h) (Fig. 2): WSOC was higher in autumn and winter (GZ seasonal averages, 5.95 and 6.01 µg C m−3; and NS, 5.32 and 4.96 µg C m−3) than spring and summer (GZ seasonal averages, 4.34 and 3.56 µg C m−3; and NS, 3.95 and 2.52 µg C m−3). The variation of WSOC_h and WISOC among different samples will be discussed later in this paper (Sect 3.2.4).
5
Unlike OC and WSOC that exhibit a concentration gradient between GZ and NS, the concentrations of HULIS were similar at both sites (Table 1). Annual average concen-trations of HULIS were 4.83 and 4.71 µg m−3 in GZ and NS, respectively. The lack of an urban-suburban gradient in HULIS concentration indicates that nonurban sources dominated ambient HULIS. This finding was consistent with results from our previous
10
study (Lin et al., 2010a), where the annual average HULIS concentration in the subur-ban site NS was higher than Tsuen Wan (an ursubur-ban site in Hong Kong) in year 2007/08. The difference in spatial variation of HULIS and WSOC indicates HULIS and WSOC may differ in their major contributing sources.
The annual contribution of HULIS to PM2.5 was significant, 8.5±3.5 % and 10.2± 15
4.5 % in GZ and NS, respectively. In our previous study (Lin et al., 2010a), the annual average HULIS/PM2.5 ratio was ∼10 % at both NS and Tsuen Wan for a one-year
period from July 2007 to August 2008. The similar results obtained in this work confirm that HULIS is abundant in PM2.5. The fraction of HULIS-C in WSOC was fairly stable
across all the samples at these two sites: 48±13 % for GZ and 57±16 % for NS. These 20
results are in broad agreement with other studies showing that HULIS-C accounts for about half of WSOC (Krivacsy et al., 2008 and references therein).
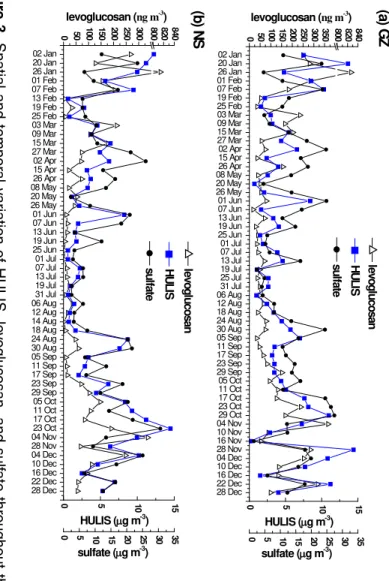
The time series of HULIS concentration in GZ and NS are shown in Fig. 3, together with those of levoglucosan and sulfate. The temporal variation trend of HULIS is roughly similar to, but not exactly the same as, that of levoglucosan (Fig. 3). In winter, the trends
25
ACPD
14, 23913–23947, 2014Sources of humic-like substances in the
Pearl River Delta
B. Y. Kuang et al.
Title Page
Abstract Introduction
Conclusions References
Tables Figures
◭ ◮
◭ ◮
Back Close
Full Screen / Esc
Printer-friendly Version Interactive Discussion
Discussion
P
a
per
|
Discus
sion
P
a
per
|
Discussion
P
a
per
|
Discussion
P
a
per
|
level at both GZ and NS. In comparison, HULIS tracked sulfate well in summer as well as in winter. This indicates that secondary formation process is an important source of HULIS, especially in summer when biomass burning emissions were very low.
3.1.3 Biomass burning tracer compounds
The yearly average concentrations of levoglucosan were 115 and 75 ng m−3in GZ and
5
NS, respectively, which means that the influence of BB emissions was more intense in GZ. Similar temporal variations were observed in both locations (Fig. 3). January to March and November to December were the periods when biomass burning was intense, with levoglucosan concentration usually higher than 50 ng m−3 and the aver-age concentration was 216 ng m−3 at GZ, and 166 ng m−3 at NS. The levoglucosan
10
concentrations were high because during the harvest season, BB in the form of agri-cultural waste combustion emits large amount of aerosols into the atmosphere (Wang et al., 2007). From April to August, BB activities were reduced, and levoglucosan con-centration was usually around 50 ng m−3in GZ, and below 25 ng m−3in NS. Wash-out of particles by increased precipitation in summer may also be an important reason
15
for decrease of levoglucosan concentration. Ding et al. (2012) reported similar tem-poral variation of levoglucosan in the PRD region in 2008, with a summer average of 81.0 ng m−3and an average of 310 ng m−3in autumn and winter.
Two samples of very high levoglucosan concentration (>800 ng m−3) were observed: 827 and 814 ng m−3in GZ and NS respectively on 26 January. The two isomers,
man-20
nosan and galactosan, were also higher on that day than all the other samples (Sup-plement Fig. S1). In addition, elemental K was 3.19 and 5.25 µg m−3 in GZ and NS respectively, the highest among all sampling days. High concentrations of all these BB tracers suggest that there may be local BB activities on that day. That day was Chinese New Year, and we suspect festival-related activities (e.g., fireworks) could also make
25
significant contributions to PM2.5.
ACPD
14, 23913–23947, 2014Sources of humic-like substances in the
Pearl River Delta
B. Y. Kuang et al.
Title Page
Abstract Introduction
Conclusions References
Tables Figures
◭ ◮
◭ ◮
Back Close
Full Screen / Esc
Printer-friendly Version Interactive Discussion
Discussion
P
a
per
|
Discus
sion
P
a
per
|
Discussion
P
a
per
|
Discussion
P
a
per
|
NOAA HYSPLIT model (http://ready.arl.noaa.gov/HYSPLIT.php). They were classified into three categories: marine, continental, and transitional, according to whether their routes traveled over the South China Sea, the continent, or in-between. A total of 25 sampling days fell in the marine air mass cateogory, 12 sampling days in the continental air mass category and 16 sampling days in the transitional air mass cateogory. The
5
average concentration of levoglucosan was generally lower on “marine days” (51 and 19 ng m−3 in GZ and NS, respectively) than “continental days” (222 and 179 ng m−3 in GZ and NS, respectively).
Levoglucosan, mannosan and galactosan are isomers co-emitted from biomass burning. The excellent correlations of these three species (R2>0.80, Fig. S1 in the
10
Supplement) confirm similar sources of the three isomers.
3.2 Source identification and apportionment
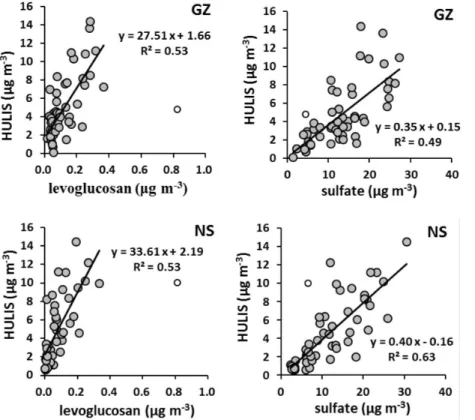
3.2.1 Interspecies relationships between HULIS and other PM2.5constituents
Interspecies relationships between HULIS and other PM2.5constituents were examined
to facilitate identification of HULIS sources and the coefficients of correlation (R2) are
15
listed in Supplement Table S2. HULIS shows moderate positive correlation (R2≥0.4)
with the BB tracers and with the secondary inorganic species (i.e., SO24−, NO−3, and NH+4), The correlations of HULIS with levoglucosan and sulfate are also displayed in Fig. 4. Such positive correlation relationships are consistent with the similar tempo-ral variation trends seen in the time series plots of HULIS, levoglucosan and sulfate
20
ACPD
14, 23913–23947, 2014Sources of humic-like substances in the
Pearl River Delta
B. Y. Kuang et al.
Title Page
Abstract Introduction
Conclusions References
Tables Figures
◭ ◮
◭ ◮
Back Close
Full Screen / Esc
Printer-friendly Version Interactive Discussion
Discussion
P
a
per
|
Discus
sion
P
a
per
|
Discussion
P
a
per
|
Discussion
P
a
per
|
3.2.2 Determination of factors and source identification in PMF analysis
The PMF analysis was based on the combined data set of 100 samples at GZ and NS. The day, 26 January, when levoglucosan was over 800 ng m−3 at both sites, was excluded from the PMF input in order not to distort the result of source apportionment. Two methods were used to determine the number of factors (source profiles). First,
5
the IM value (maximum Individual column Mean), i.e., the maximum mean of the scaled residual of each species, was calculated for all thensamples (Lee et al., 1999):
IM= max
j=1,...,m
1
n
n X
i=1
ei j
si j
!
(1)
whereei j is the residual of the concentration ofjth species in theith sample andsi j
10
is the input uncertainty of thejth species’ concentration of theith sample. IM indicates the least fit species. If IM drops dramatically when the number of factors is increased by 1, it indicates that the larger number of factors is more appropriate. For our data set, IM dropped dramatically when the number of factors increased from 5 to 6, and dropped slightly when the factor number was further increased from 6 to 9 (Fig. S2 in
15
the Supplement). Thus, the more suitable number of factors should be higher than 5. The interpretability of the source profile and explained variation (EV) was another criterion, and this criterion was regarded as a key basis for determining the number of factors (Liu et al., 2005; Shrivastava et al., 2007; Wang et al., 2012). Five to nine fac-tors were tested and the six-factor solution was found to be optimum, yielding the most
20
reasonable source profiles. The six-factor solution was verified to be stable through performing 100 bootstrap runs, as more than 88 % of the runs produced the same fac-tors. The EV profiles of the six factors are shown in Fig. 5. They are associated with the following six sources: (1) dust as signified by the dominant presence of Al, Si, Ca, Fe, and Ti, (2) chloride and nitrate dominant source, (3) mixed ship emissions and sea
25
ACPD
14, 23913–23947, 2014Sources of humic-like substances in the
Pearl River Delta
B. Y. Kuang et al.
Title Page
Abstract Introduction
Conclusions References
Tables Figures
◭ ◮
◭ ◮
Back Close
Full Screen / Esc
Printer-friendly Version Interactive Discussion
Discussion
P
a
per
|
Discus
sion
P
a
per
|
Discussion
P
a
per
|
Discussion
P
a
per
|
biomass burning source indicated by the three anhydrosugars and K, (6) vehicle emis-sions identified by EC, hopane, and norhopane. For the chloride and nitrate dominant source, 37 % of NH+4 is present in this factor. In this data set, cloride is moderately correlated with NH+4 (R2 =0.31 at GZ and 0.30 in NS). Considering this, we suggest that this factor is possibly associated with the following partitioning reaction:
5
HCl(g)+NH3⇋NH4Cl(s, aq) HNO3(g)+NH3⇋NH4NO3(s, aq) (R1)
The interoperability of the resolved PMF factors is also examined by inspecting the ap-portionment of the major PM2.5components (EC, OC, SO
2−
4 , NO
−
3, and NH +
4) in the six
resolved factors. The factor contributions to individual major PM2.5 components were
averaged for each site and presented and compared with the observed concentrations
10
in Supplement Table S3. The modeled average concentrations of these major species deviate less than 7 % from the measured values. The apportioned source categories for the different major components are overall reasonable. Take EC as an example, the EC concentrations are mostly accounted for by the three combustion factors, i.e., vehic-ular emissions (GZ: 45 %, NS: 14 %), biomass burning (GZ: 22 %, NS: 23 %), and ship
15
emissions (GZ: 18 %, NS: 43 %). We also note that the HULIS-C/OC ratio in the BB factor was 0.16, in excellent agreement with the measured ratio (0.19±0.03) reported for emissions of rice straw burning in a number of field and chamber experiments (Lin et al., 2010b).
3.2.3 Source apportionment of HULIS-C
20
HULIS is present in three of the six fractors resolved by PMF, that is, secondary pro-cess, biomass burning, and ship emissions and sea salt aerosols. The other three factors did not contribute to HULIS. Table 2 shows the average factor contributions of HULIS-C. Figure 6 shows the spatial and temporal variation of individual factor contri-butions to HULIS-C.
25
ACPD
14, 23913–23947, 2014Sources of humic-like substances in the
Pearl River Delta
B. Y. Kuang et al.
Title Page
Abstract Introduction
Conclusions References
Tables Figures
◭ ◮
◭ ◮
Back Close
Full Screen / Esc
Printer-friendly Version Interactive Discussion
Discussion
P
a
per
|
Discus
sion
P
a
per
|
Discussion
P
a
per
|
Discussion
P
a
per
|
and 55 % (1.37 µg C m−3) to HULIS-C in GZ and NS, and the seasonal average was in the range of 49–82 % at the two sites, consistent with the high correlation between HULIS and the secondary inorganic species shown earlier.
Biomass burning was also a significant contributor to HULIS-C with strong seasonal variation. Its percent contributions in winter (GZ: 28 %, NS: 20 %) were roughly 2–
5
3 times those in summer (GZ: 11 %, NS: 8 %) while the mass contributions in win-ter (GZ: 1.02, NS: 0.68 µg C m−3) were 5–6 time those in summer (GZ: 0.17, NS: 0.10 µg C m−3). The seasonal contrast of BB contributions was a reflection of the sea-sonal patterns of BB activities in this region. BB contributions were also significant in spring 2009 (GZ: 25 %, NS: 21 %).
10
The above source apportionment results are consistent with qualitative evidence by other studies reporting that secondary formation process and BB were important HULIS sources (Altieri et al., 2008; El Haddad et al., 2011; Lin et al., 2010a). However, it is an unexpected result that this PMF analysis identifies ship emissions and sea salt factor as a source for HULIS-C. There were no prior studies reporting such a HULIS
15
source. Nor was this hinted by the interspecies correlation analysis (Table S2 in the Supplement).
The PMF analysis apportioned a seasonal average of HULIS-C in the range of 0.21– 0.35 µg C m−3 (7–19 %) at GZ and 0.52–0.84 µg C m−3 (21–44 %) at NS to the ship emissions and sea salt aerosols factor. The factor contributions at NS were
consis-20
tently higher than those at GZ in all seasons. As marked in Fig. 1, a shipping lane links the few large coastal ports (Kwai Chung Port in Hong Kong, Yantian and Shekou Ports in Shenzhen, Nansha Port in the estuary of the Pearl River) and extends along the Pearl River to the further inland ports (Xinsha Port, Huangpu Port and the Guangzhou Downtown Port). Ocean-going vessels usually stop at the coastal ports in Hong Kong
25
ACPD
14, 23913–23947, 2014Sources of humic-like substances in the
Pearl River Delta
B. Y. Kuang et al.
Title Page
Abstract Introduction
Conclusions References
Tables Figures
◭ ◮
◭ ◮
Back Close
Full Screen / Esc
Printer-friendly Version Interactive Discussion
Discussion
P
a
per
|
Discus
sion
P
a
per
|
Discussion
P
a
per
|
Discussion
P
a
per
|
river vessels due to their larger size and numbers. The closer proximity of the NS site to the shipping lane supports the finding of the higher contributions of shipping emissions at this site.
Chemical information also confirms that ship emissions contributed to HULIS when summer NS sampling days under marine air mass influence were pooled together for
5
examination. This subset of sampling days were choosen as the they were least in-fluenced by the other two sources of HULIS (i.e., secondary formation and BB ac-tivities). This can be seen in Fig. 7, which shows the average factor contributions to HULIS-C under influence of different air masses. The contribution from secondary for-mation process was much lower on “marine” days (GZ: 1.05 µg m−3, NS: 0.44 µg m−3)
10
than on “continental” days (GZ: 2.35 µg m−3, NS: 2.22 µg m−3). BB contribution was also much lower on “marine” days (GZ: 0.13 µg m−3, NS: 0.06 µg m−3) than on “con-tinental” days (GZ: 0.69 µg m−3, NS: 0.58 µg m−3). Both results could be explained as a result of the clean marine air mass low in secondary aerosol precursor and in pollu-tion from BB sources. For the summer “marine” days at NS, the correlapollu-tion coefficient
15
(R2) of HULIS-C vs. V (a tracer of residual oil combustion that is characteristic of ship emissions) was 0.51 while the correlation between HULIS-C and Na+ was very weak (R2=0.16) (Fig. 8). We note that the HULIS-C vs. V correlation was nearly zero when the whole data set was considered, as contribution of shipping emissions was masked by the other samples due to more significant contributions from the secondary process
20
and BB source. The significant positive correlation between HULIS-C and V and lack of correlation between HULIS-C and Na+in the subset of the NS samples (n=16) clearly implicates shipping emissions, not sea salt, as a source of HULIS.
The contribution from the ship emissions and sea salt source in GZ, was higher un-der the influence of marine air masses (0.29 µg m−3) than under continental air masses
25
ACPD
14, 23913–23947, 2014Sources of humic-like substances in the
Pearl River Delta
B. Y. Kuang et al.
Title Page
Abstract Introduction
Conclusions References
Tables Figures
◭ ◮
◭ ◮
Back Close
Full Screen / Esc
Printer-friendly Version Interactive Discussion
Discussion
P
a
per
|
Discus
sion
P
a
per
|
Discussion
P
a
per
|
Discussion
P
a
per
|
Formation of HULIS during combustion of residue oil could be broadly envisioned as a result of incomplete combustion, similar to formation of HULIS during BB. The HULIS-C/OC ratios in these two combustion sources as resolved by the PMF analysis were similar (∼0.16), suggesting the HULIS contents in OC from these two types of
combustion aerosols are similar. It is interesting to note that vehicular emissions, the
5
other combustion source, had little contribution to HULIS. This could be explained as a result of much more complete combustion and more advanced emission controls in vehicles. HULIS presence in coal combustion source samples is also detected (un-published result from our group), supporting the suggestion that HULIS is commonly formed as a result of incomplete combustion.
10
3.2.4 Source apportionment of WSOC_h and WISOC
In the PMF analysis, WSOC_h and OC were included as input and consequently their source apportionment can be derived. The source apportionment of WSOC and WISOC are indirectly computed from individual factor source contributions of HULIS-C, WSOC_h, and OC. Figure 7 shows the source apportionment results for HULIS-HULIS-C,
15
WSOC_h, WSOC, and WISOC averaged for samples categorized by influencing air mass origins.
Hydrophilic WSOC was apportioned to all but one (the Cl− and NO−3 dominated factor) factors resolved by PMF. Unlike HULIS-C, vehicular emissions were identified to be a significant source to WSOC_h. The mass contribution of this source had
lit-20
tle dependence on air mass origins while significant urban-suburban gradient was recorded, with its levels at GZ (0.81–0.83 µg C m−3, 31–47 %) much higher than at NS (0.17–0.23 µg C m−3, 9–18 %), consistent with the site characteristics. The source contribution contrast of vehicular emissions to HULIS-C and WSOC_h may reflect that high combustion efficiencies in vehicles more likely produce smaller and
there-25
fore more hydrophilic WSOC. Ship emissions and sea salt aerosol factor contributed similar amounts of WSOC_h (GZ: 0.21–0.43; NS:∼0.55 µg C m−3) and HULIS-C (GZ:
ACPD
14, 23913–23947, 2014Sources of humic-like substances in the
Pearl River Delta
B. Y. Kuang et al.
Title Page
Abstract Introduction
Conclusions References
Tables Figures
◭ ◮
◭ ◮
Back Close
Full Screen / Esc
Printer-friendly Version Interactive Discussion
Discussion
P
a
per
|
Discus
sion
P
a
per
|
Discussion
P
a
per
|
Discussion
P
a
per
|
and WSOC_h among samples influenced by air masses of the same origin, with the contributions much higher on “continental” days (GZ:∼0.69 µg C m−3 and NS: ∼
0.58 µg C m−3) and “transitional” days (GZ:∼0.70 µg C m−3 and NS:∼0.56 µg C m−3) than on “marine” days (GZ:∼0.13 µg C m−3and NS:∼0.06 µg C m−3). The WSOC_h
from secondary formation process was∼0.7 at NS and∼0.74 µg C m−3at GZ on
“con-5
tinental”/“transitional” days and 0.14 at NS and 0.33 µg C m−3at GZ on “marine” days. Secondary formation process produced more WSOC as HULIS-C than WSOC_h, with HULIS-C approximately three times WSOC_h for all three types of sampling days. This finding was in agreement with the observation by Miyazaki et al. (2009). They reported that when aerosols aged for 10 h (the age was based on the NOx/NOy ratio),
hydropho-10
bic WSOC (roughly equivalent to HULIS-C in this work) increased by a factor of 5, while hydrophilic WSOC increased by only a factor of 2 to 3.
WSOC, the sum of HULIS-C and WSOC_h, was more frequently measured in past studies (e.g., Huang et al., 2006; Kondo et al., 2007; Duong et al., 2011; Zhang et al., 2012; Li et al., 2013). Secondary formation and BB are two commonly recognized
15
sources for WSOC through field measurements. Our results confirm this consensus, with 32–56 % of WSOC accounted for by secondary formation and 6–25 % by BB on sampling days under influence of different air masses (Fig. 7).
Water-insoluble OC was apportioned to all factors resolved by PMF. The dust factor was a very minor contributor (<3 %). The contributions from the other five factors were
20
roughly comparable on “continental”/“transitional” days while more varied on “marine” days (Fig. 7). WISOC had moderate correlations with EC, with R2=0.51 at GZ and 0.74 at NS (Supplement Fig. S4), suggesting primary combustion sources as the main suppliers of WISOC in PM2.5. We note that a sizable portion of WISOC was apportioned
to the Cl− and NO−3 dominated factor. We are unclear about the underlying source or
25
ACPD
14, 23913–23947, 2014Sources of humic-like substances in the
Pearl River Delta
B. Y. Kuang et al.
Title Page
Abstract Introduction
Conclusions References
Tables Figures
◭ ◮
◭ ◮
Back Close
Full Screen / Esc
Printer-friendly Version Interactive Discussion
Discussion
P
a
per
|
Discus
sion
P
a
per
|
Discussion
P
a
per
|
Discussion
P
a
per
|
4 Summary and conclusions
This study is the first of its kind to apportion sources contributing to HULIS through PMF modelling of PM2.5 major constituents and key source tracers. The observation
sites are one urban (GZ) and one suburban location (NS) in the Pearl River Delta, one of the economically most developed region in China and also a region home to an
5
active shipping industry. Six source factors were identified. Among them, secondary process, biomass burning and residual oil combustion (ship emissions) were found to contribute to HULIS. The secondary process factor contributed most to HULIC-C, with an average seasonal contribution of 49–82 % or an average of ∼70 % on sampling days under influences of continental or transitional air masses. Biomass burning was
10
an important contributor in winter, contributing 20 and 28 % of HULIS-C in Nansha and Guangzhou, respectively. Residual oil combustion from shipping was for the first time identified to be an important primary source for HULIS, its contributions comparable or exceeding those from BB at NS site due to its proximity to the container ports and shipping lane in the region.
15
Vehicular emissions, unlike the other two combustion sources (i.e., residual oil com-bustion and BB), was not a contributor to HULIS while this source was a supplier of the hydrophilic WSOC. The contrast in contributions to HULIS by different combustion sources led us to postulate that HULIS is a common group of products of inefficient combustion processes while more efficient combution processes (such as internal
com-20
bution in vehicles) produces little HULIS. Future studies are suggested to focus on the mechanism of HULIS formation and chemical characteristics from the three identified sources.
The Supplement related to this article is available online at doi:10.5194/acpd-14-23913-2014-supplement.
ACPD
14, 23913–23947, 2014Sources of humic-like substances in the
Pearl River Delta
B. Y. Kuang et al.
Title Page
Abstract Introduction
Conclusions References
Tables Figures
◭ ◮
◭ ◮
Back Close
Full Screen / Esc
Printer-friendly Version Interactive Discussion
Discussion
P
a
per
|
Discus
sion
P
a
per
|
Discussion
P
a
per
|
Discussion
P
a
per
|
Acknowledgements. This work was partially supported by Natural Science Foundation of China (21177031) and the Research Grants Council of Hong Kong (621312). We gratefully ac-knowledge the Fok Ying Tung Foundation for funding to the Atmospheric Research Center (ARC) at HKUST Fok Ying Tung Graduate School, enabling sample collection at Nansha and Guangzhou. We thank the sampling and analysis team at ARC for sample collection and anal-5
ysis of aerosol major constituents, Q. Q. Wang for assisting with the TD-GCMS analysis and S. Griffith for editing the paper.
References
Altieri, K. E., Seitzinger, S. P., Carlton, A. G., Turpin, B. J., Klein, G. C., and Marshall, A. G.: Oligomers formed through in-cloud methylglyoxal reactions: chemical composition, proper-10
ties, and mechanisms investigated by ultra-high resolution FT-ICR mass spectrometry, At-mos. Environ., 42, 1476–1490, doi:10.1016/j.atmosenv.2007.11.015, 2008.
Cavalli, F., Facchini, M. C., Decesari, S., Mircea, M., Emblico, L., Fuzzi, S., Ceburnis, D., Yoon, Y. J., O’Dowd, C. D., Putaud, J. P., and Dell’Acqua, A.: Advances in characteriza-tion of size-resolved organic matter in marine aerosol over the North Atlantic, J. Geophys. 15
Res.-Atmos., 109, D24215, doi:10.1029/2004jd005137, 2004.
Decesari, S., Facchini, M. C., Fuzzi, S., and Tagliavini, E.: Characterization of water-soluble organic compounds in atmospheric aerosol: a new approach, J. Geophys. Res.-Atmos., 105, 1481–1489, doi:10.1029/1999jd900950, 2000.
Dinar, E., Taraniuk, I., Graber, E. R., Katsman, S., Moise, T., Anttila, T., Mentel, T. F., and 20
Rudich, Y.: Cloud Condensation Nuclei properties of model and atmospheric HULIS, Atmos. Chem. Phys., 6, 2465–2482, doi:10.5194/acp-6-2465-2006, 2006.
Ding, X., Wang, X. M., Gao, B., Fu, X. X., He, Q. F., Zhao, X. Y., Yu, J. Z., and Zheng, M.: Tracer-based estimation of secondary organic carbon in the Pearl River Delta, south China, J. Geophys. Res.-Atmos., 117, D05313, doi:10.1029/2011jd016596, 2012.
25
Duong, H. T., Sorooshian, A., Craven, J. S., Hersey, S. P., Metcalf, A. R., Zhang, X. L., Weber, R. J., Jonsson, H., Flagan, R. C., and Seinfeld, J. H.: Water-soluble organic aerosol in the Los Angeles Basin and outflow regions: airborne and ground measure-ments during the 2010 CalNex field campaign, J. Geophys. Res.-Atmos., 116, D00V04, doi:10.1029/2011JD016674, 2011.
ACPD
14, 23913–23947, 2014Sources of humic-like substances in the
Pearl River Delta
B. Y. Kuang et al.
Title Page
Abstract Introduction
Conclusions References
Tables Figures
◭ ◮
◭ ◮
Back Close
Full Screen / Esc
Printer-friendly Version Interactive Discussion
Discussion
P
a
per
|
Discus
sion
P
a
per
|
Discussion
P
a
per
|
Discussion
P
a
per
|
El Haddad, I., Marchand, N., Temime-Roussel, B., Wortham, H., Piot, C., Besombes, J.-L., Baduel, C., Voisin, D., Armengaud, A., and Jaffrezo, J.-L.: Insights into the secondary fraction of the organic aerosol in a Mediterranean urban area: Marseille, Atmos. Chem. Phys., 11, 2059–2079, doi:10.5194/acp-11-2059-2011, 2011.
Engling, G., Carrico, C. M., Kreldenweis, S. M., Collett, J. L., Day, D. E., Malm, W. C., Lincoln, E., 5
Hao, W. M., Iinuma, Y., and Herrmann, H.: Determination of levoglucosan in biomass com-bustion aerosol by high-performance anion-exchange chromatography with pulsed amper-ometric detection, Atmos. Environ., 40, S299–S311, doi:10.1016/j.atmosenv.2005.12.069, 2006.
Guo, H., Ding, A. J., So, K. L., Ayoko, G., Li, Y. S., and Hung, W. T.: Receptor modeling of source 10
apportionment of Hong Kong aerosols and the implication of urban and regional contribution, Atmos. Environ., 43, 1159–1169, doi:10.1016/j.atmosenv.2008.04.046, 2009.
Graber, E. R. and Rudich, Y.: Atmospheric HULIS: How humic-like are they? A comprehensive and critical review, Atmos. Chem. Phys., 6, 729–753, doi:10.5194/acp-6-729-2006, 2006. Harrison, R. M., Beddows, D. C. S., Hu, L., and Yin, J.: Comparison of methods for evaluation of 15
wood smoke and estimation of UK ambient concentrations, Atmos. Chem. Phys., 12, 8271– 8283, doi:10.5194/acp-12-8271-2012, 2012.
Havers, N., Burba, P., Klockow, D., and Klockow-Beck, A.: Characterization of humic-like sub-stances in airborne particulate matter by capillary electrophoresis, Chromatographia, 47, 619–624, doi:10.1007/Bf02467443, 1998a.
20
Havers, N., Burba, P., Lambert, J., and Klockow, D.: Spectroscopic characterization of humic-like substances in airborne particulate matter, J. Atmos. Chem., 29, 45–54, doi:10.1023/A:1005875225800, 1998b.
Ho, S. S. H. and Yu, J. Z.: In-injection port thermal desorption and subsequent gas chromatography-mass spectrometric analysis of polycyclic aromatic hydrocarbons and 25
n-alkanes in atmospheric aerosol samples, J. Chromatography A, 1059, 121–129, doi:10.1016/j.chroma.2004.10.013, 2004.
Ho, S. S. H., Yu, J. Z., Chow, J. C., Watson, J. G., Zielinska, B., Watson, J. G., Sit, E. H. L., and Schauer, J. J.: Evaluation of an in-injection port thermal desorption GC-MS method for analysis of non-polar organic compounds in ambient aerosol samples, J. Chromatography 30
ACPD
14, 23913–23947, 2014Sources of humic-like substances in the
Pearl River Delta
B. Y. Kuang et al.
Title Page
Abstract Introduction
Conclusions References
Tables Figures
◭ ◮
◭ ◮
Back Close
Full Screen / Esc
Printer-friendly Version Interactive Discussion
Discussion
P
a
per
|
Discus
sion
P
a
per
|
Discussion
P
a
per
|
Discussion
P
a
per
|
Hoffer, A., Gelencsér, A., Guyon, P., Kiss, G., Schmid, O., Frank, G. P., Artaxo, P., and Andreae, M. O.: Optical properties of humic-like substances (HULIS) in biomass-burning aerosols, Atmos. Chem. Phys., 6, 3563–3570, doi:10.5194/acp-6-3563-2006, 2006.
Holden, A. S., Sullivan, A. P., Munchak, L. A., Kreidenweis, S. M., Schichtel, B. A., Malm, W. C., and Collett, J. L.: Determining contributions of biomass burning and other sources to fine 5
particle contemporary carbon in the western United States, Atmos. Environ., 45, 1986–1993, doi:10.1016/j.atmosenv.2011.01.021, 2011.
Hu, D., Bian, Q. J., Lau, A. K. H., and Yu, J. Z.: Source apportioning of primary and sec-ondary organic carbon in summer PM2.5 in Hong Kong using positive matrix factorization of secondary and primary organic tracer data, J. Geophys. Res.-Atmos., 115, D16204, 10
doi:10.1029/2009jd012498, 2010.
Huang, X. F., Yu, J. Z., He, L. Y., and Yuan, Z. B.: Water-soluble organic carbon and oxalate in aerosols at a coastal urban site in China: size distribution characteristics, sources, and formation mechanisms, J. Geophys. Res.-Atmos., 111, D22212, doi:10.1029/2006jd007408, 2006.
15
Huang, X. H. H., Bian, Q., Ng, W. M., Louie, P. K. K., and Yu, J. Z.: Characterization of PM2.5 major components and source investigation in suburban Hong Kong: a one year monitoring study, Aerosol Air Qual. Res., 14, 237–250, doi:10.4209/aaqr.2013.01.0020, 2014.
Khan, M. F., Hirano, K., and Masunaga, S.: Assessment of the sources of suspended par-ticulate matter aerosol using US EPA PMF 3.0, Environ. Monit. Assess., 184, 1063–1083, 20
doi:10.1007/s10661-011-2021-y, 2012.
Kim, E. and Hopke, P. K.: Source apportionment of fine particles in Washington, DC, utilizing temperature-resolved carbon fractions, J. Air Waste Manage., 54, 773–785, doi:10.1080/10473289.2004.10470948, 2004.
Kim, E. and Hopke, P. K.: Source identifications of airborne fine particles using positive matrix 25
factorization and US environmental protection agency positive matrix factorization, J. Air Waste Manage., 57, 811–819, 2007.
Kim, E., Turkiewicz, K., Zulawnick, S. A., and Magliano, K. L.: Sources of fine particles in the South Coast area, California, Atmos. Environ., 44, 3095–3100, doi:10.1016/j.atmosenv.2010.05.037, 2010.
30
ACPD
14, 23913–23947, 2014Sources of humic-like substances in the
Pearl River Delta
B. Y. Kuang et al.
Title Page
Abstract Introduction
Conclusions References
Tables Figures
◭ ◮
◭ ◮
Back Close
Full Screen / Esc
Printer-friendly Version Interactive Discussion
Discussion
P
a
per
|
Discus
sion
P
a
per
|
Discussion
P
a
per
|
Discussion
P
a
per
|
Kiss, G., Tombacz, E., and Hansson, H. C.: Surface tension effects of humic-like sub-stances in the aqueous extract of tropospheric fine aerosol, J. Atmos. Chem., 50, 279–294, doi:10.1007/s10874-005-5079-5, 2005.
Kondo, Y., Miyazaki, Y., Takegawa, N., Miyakawa, T., Weber, R. J., Jimenez, J. L., Zhang, Q., and Worsnop, D. R.: Oxygenated and water-soluble organic aerosols in Tokyo, J. Geophys. 5
Res.-Atmos., 112, D01203, doi:10.1029/2006JD007056, 2007.
Krivacsy, Z., Kiss, G., Varga, B., Galambos, I., Sarvari, Z., Gelencser, A., Molnar, A., Fuzzi, S., Facchini, M. C., Zappoli, S., Andracchio, A., Alsberg, T., Hansson, H. C., and Persson, L.: Study of humic-like substances in fog and interstitial aerosol by size-exclusion chromatog-raphy and capillary electrophoresis, Atmos. Environ., 34, 4273–4281, doi:10.1016/S1352-10
2310(00)00211-9, 2000.
Krivacsy, Z., Kiss, G., Ceburnis, D., Jennings, G., Maenhaut, W., Salma, I., and Shooter, D.: Study of water-soluble atmospheric humic matter in urban and marine environments, Atmos. Res., 87, 1–12, doi:10.1016/j.atmosres.2007.04.005, 2008.
Lee, E., Chan, C. K., and Paatero, P.: Application of positive matrix factorization in source 15
apportionment of particulate pollutants in Hong Kong, Atmos. Environ., 33, 3201–3212, doi:10.1016/S1352-2310(99)00113-2, 1999.
Li. Y. C., Yu, J. Z., Ho, S. S. H., Schauer, J. J., Yuan, Z. B., Lau, A. K. H., and Louie, P. K. K.: Chemical characteristics and source apportionment of fine particulate organic carbon in Hong Kong during high particulate matter episodes in winter 2003, Atmos. Res., 120–121, 20
88–98, 2013.
Lin, P. and Yu, J. Z.: Generation of Reactive Oxygen Species Mediated by Humic-like Substances in Atmospheric Aerosols, Environ. Sci. Technol., 45, 10362–10368, doi:10.1021/Es2028229, 2011.
Lin, P., Huang, X. F., He, L. Y., and Yu, J. Z.: Abundance and size distribution of 25
HULIS in ambient aerosols at a rural site in South China, J. Aerosol. Sci., 41, 74–87, doi:10.1016/j.jaerosci.2009.09.001, 2010a.
Lin, P., Engling, G., and Yu, J. Z.: Humic-like substances in fresh emissions of rice straw burning and in ambient aerosols in the Pearl River Delta Region, China, Atmos. Chem. Phys., 10, 6487–6500, doi:10.5194/acp-10-6487-2010, 2010b.
30
ACPD
14, 23913–23947, 2014Sources of humic-like substances in the
Pearl River Delta
B. Y. Kuang et al.
Title Page
Abstract Introduction
Conclusions References
Tables Figures
◭ ◮
◭ ◮
Back Close
Full Screen / Esc
Printer-friendly Version Interactive Discussion
Discussion
P
a
per
|
Discus
sion
P
a
per
|
Discussion
P
a
per
|
Discussion
P
a
per
|
Lukacs, H., Gelencser, A., Hammer, S., Puxbaum, H., Pio, C., Legrand, M., Kasper-Giebl, A., Handler, M., Limbeck, A., Simpson, D., and Preunkert, S.: Seasonal trends and possible sources of brown carbon based on 2-year aerosol measurements at six sites in Europe, J. Geophys. Res.-Atmos., 112, D23s18, doi:10.1029/2006jd008151, 2007.
Maykut, N. N., Lewtas, J., Kim, E., and Larson, T. V.: Source apportionment of PM2.5 at 5
an urban IMPROVE site in Seattle, Washington, Environ. Sci. Technol., 37, 5135–5142, doi:10.1021/Es030370y, 2003.
Mayol-Bracero, O. L., Guyon, P., Graham, B., Roberts, G., Andreae, M. O., Decesari, S., Fac-chini, M. C., Fuzzi, S., and Artaxo, P.: Water-soluble organic compounds in biomass burning aerosols over Amazonia – 2. Apportionment of the chemical composition and importance 10
of the polyacidic fraction, J. Geophys. Res.-Atmos., 107, 8091, doi:10.1029/2001jd000522, 2002.
Miyazaki, Y., Kondo, Y., Shiraiwa, M., Takegawa, N., Miyakawa, T., Han, S., Kita, K., Hu, M., Deng, Z. Q., Zhao, Y., Sugimoto, N., Blake, D. R., and Weber, R. J.: Chemical characterization of water-soluble organic carbon aerosols at a rural site in the Pearl River Delta, China, in the 15
summer of 2006, J. Geophys. Res.-Atmos., 114, D14208, doi:10.1029/2009JD011736, 2009 Mooibroek, D., Schaap, M., Weijers, E. P., and Hoogerbrugge, R.: Source apportionment and
spatial variability of PM2.5using measurements at five sites in the Netherlands, Atmos. Env-iron., 45, 4180–4191, doi:10.1016/j.atmosenv.2011.05.017, 2011.
Ng, S. K. W., Lin, C., Chan, J. W. M., Yip, A. C. K., Lau, A. K. H., Fung, J. C. H., Wu, D., 20
and Li, Y.: Marine Vessel Smoke Emissions in Hong Kong and the Pearl River Delta, Final Report, available at: http://shipsairpollution.cleartheair.org.hk/wp-content/uploads/2013/08/ 201209FinalReport_hkust.pdf (last access: 7 August 2014), 2012.
Nolte, C. G., Schauer, J. J., Cass, G. R., and Simoneit, B. R. T.: Highly polar organic compounds present in wood smoke and in the ambient atmosphere, Environ. Sci. Technol., 35, 1912– 25
1919, doi:10.1021/Es001420r, 2001.
Norris, G., Vedantham, R., Wade, K., Brown, S., Prouty, J., and Foley, C.: EPA Positive Matrix Factorization (PMF) 3.0 Fundamentals & User Guide, EPA 600/R-08/108 ed., available at: www.epa.gov (last access: 22 September 2012), 2008.
Polissar, A. V., Hopke, P. K., and Paatero, P.: Atmospheric aerosol over Alaska – 30
ACPD
14, 23913–23947, 2014Sources of humic-like substances in the
Pearl River Delta
B. Y. Kuang et al.
Title Page
Abstract Introduction
Conclusions References
Tables Figures
◭ ◮
◭ ◮
Back Close
Full Screen / Esc
Printer-friendly Version Interactive Discussion
Discussion
P
a
per
|
Discus
sion
P
a
per
|
Discussion
P
a
per
|
Discussion
P
a
per
|
Reff, A., Eberly, S. I., and Bhave, P. V.: Receptor modeling of ambient particulate matter data using positive matrix factorization: review of existing methods, J. Air Waste Manage., 57, 146–154, doi:10.1080/10473289.2007.10465319, 2007.
Samburova, V., Szidat, S., Hueglin, C., Fisseha, R., Baltensperger, U., Zenobi, R., and Kalberer, M.: Seasonal variation of high-molecular-weight compounds in the water-5
soluble fraction of organic urban aerosols, J. Geophys. Res.-Atmos., 110, D23210, doi:10.1029/2005jd005910, 2005a.
Samburova, V., Zenobi, R., and Kalberer, M.: Characterization of high molecular weight compounds in urban atmospheric particles, Atmos. Chem. Phys., 5, 2163–2170, doi:10.5194/acp-5-2163-2005, 2005b.
10
Shrivastava, M. K., Subramanian, R., Rogge, W. F., and Robinson, A. L.: Sources of or-ganic aerosol: positive matrix factorization of molecular marker data and comparison of results from different source apportionment models, Atmos. Environ., 41, 9353–9369, doi:10.1016/j.atmosenv.2007.09.016, 2007.
Simoneit, B. R. T.: Organic matter of the troposphere – III. Characterization and sources of 15
petroleum and pyrogenic residues in aerosols over the western united states. Atmos. Envi-ron., 18, 51–67, doi:10.1016/0004-6981(84)90228-2, 1984.
Simoneit, B. R. T., Schauer, J. J., Nolte, C. G., Oros, D. R., Elias, V. O., Fraser, M. P., Rogge, W. F., and Cass, G. R.: Levoglucosan, a tracer for cellulose in biomass burning and atmospheric particles, Atmos. Environ., 33, 173–182, doi:10.1016/S1352-2310(98)00145-9, 20
1999.
Varga, B., Kiss, G., Ganszky, I., Gelencser, A., and Krivacsy, Z.: Isolation of water-soluble organic matter from atmospheric aerosol, Talanta, 55, 561–572, doi:10.1016/S0039-9140(01)00446-5, 2001.
Verma, V., Rico-Martinez, R., Kotra, N., King, L., Liu, J. M., Snell, T. W., and Weber, R. J.: 25
Contribution of water-soluble and insoluble components and their hydrophobic/hydrophilic subfractions to the reactive oxygen species-generating potential of fine ambient aerosols, Environ. Sci. Technol., 46, 11384–11392, doi:10.1021/Es302484r, 2012.
Wagener, S., Langner, M., Hansen, U., Moriske, H. J., and Endlicher, W. R.: Source appor-tionment of organic compounds in Berlin using positive matrix factorization – assessing the 30
ACPD
14, 23913–23947, 2014Sources of humic-like substances in the
Pearl River Delta
B. Y. Kuang et al.
Title Page
Abstract Introduction
Conclusions References
Tables Figures
◭ ◮
◭ ◮
Back Close
Full Screen / Esc
Printer-friendly Version Interactive Discussion
Discussion
P
a
per
|
Discus
sion
P
a
per
|
Discussion
P
a
per
|
Discussion
P
a
per
|
Wang, Q. Q., Shao, M., Liu, Y., William, K., Paul, G., Li, X. H., Liu, Y. A., and Lu, S. H.: Impact of biomass burning on urban air quality estimated by organic tracers: Guangzhou and Beijing as cases, Atmos. Environ., 41, 8380–8390, doi:10.1016/j.atmosenv.2007.06.048, 2007. Wang, Y. G., Hopke, P. K., Xia, X. Y., Rattigan, O. V., Chalupa, D. C., and Utell, M. J.: Source
apportionment of airborne particulate matter using inorganic and organic species as tracers, 5
Atmos. Environ., 55, 525–532, doi:10.1016/j.atmosenv.2012.03.073, 2012.
Wu, C., Ng, W. M., Huang, J. X., Wu, D., and Yu, J. Z.: Determination of elemental and organic carbon in PM2.5in the Pearl River Delta region: inter-instrument (Sunset vs. DRI Model 2001 thermal/optical carbon analyzer) and inter-protocol comparisons (IMPROVE vs. ACE-Asia Protocol), Aerosol Sci. Tech., 46, 610–621, doi:10.1080/02786826.2011.649313, 2012. 10
Yang, H., Yu, J. Z., Ho, S. S. H., Xu, J. H., Wu, W. S., Wan, C. H., Wang, X. D., Wang, X. R., and Wang, L. S.: The chemical composition of inorganic and carbonaceous materials in PM2.5 in Nanjing, China, Atmos. Environ., 39, 3735–3749, doi:10.1016/j.atmosenv.2005.03.010, 2005.
Yu, J. Z., Huang, X. F., Xu, J. H., and Hu, M.: When aerosol sulfate goes up, so does oxalate: 15
implication for the formation mechanisms of oxalate, Environ. Sci. Technol., 39, 128–133, doi:10.1021/es049559f, 2005.
Yuan, Z. B., Lau, A. K. H., Zhang, H. Y., Yu, J. Z., Louie, P. K. K., and Fung, J. C. H.: Identification and spatiotemporal variations of dominant PM10sources over Hong Kong, Atmos. Environ., 40, 1803–1815, doi:10.1016/j.atmosenv.2005.11.030, 2006a.
20
Yuan, Z. B., Yu, J. Z., Lau, A. K. H., Louie, P. K. K., and Fung, J. C. H.: Application of positive matrix factorization in estimating aerosol secondary organic carbon in Hong Kong and its relationship with secondary sulfate, Atmos. Chem. Phys., 6, 25–34, doi:10.5194/acp-6-25-2006, 2006b.
Zhang, X., Liu, Z., Hecobian, A., Zheng, M., Frank, N. H., Edgerton, E. S., and Weber, R. J.: 25
Spatial and seasonal variations of fine particle water-soluble organic carbon (WSOC) over the southeastern United States: implications for secondary organic aerosol formation, Atmos. Chem. Phys., 12, 6593–6607, doi:10.5194/acp-12-6593-2012, 2012.
Zota, A. R., Willis, R., Jim, R., Norris, G. A., Shine, J. P., Duvall, R. M., Schaider, L. A., and Spengler, J. D.: Impact of mine waste on airborne respirable particulates in Northeast-30
ACPD
14, 23913–23947, 2014Sources of humic-like substances in the
Pearl River Delta
B. Y. Kuang et al.
Title Page
Abstract Introduction
Conclusions References
Tables Figures
◭ ◮
◭ ◮
Back Close
Full Screen / Esc
Printer-friendly Version Interactive Discussion
Discussion
P
a
per
|
Discus
sion
P
a
per
|
Discussion
P
a
per
|
Discussion
P
a
per
|
Table 1.Statistic summary for the ambient concentrations of major aerosol constituents, HULIS, elements and organic tracer compounds used in the PMF analysis.
Species name GZ NS
(µg C m−3for WSOC, WSOC_h, WISOC, OC, and EC and µg m−3for other species)
PM2.5 55.5±29.8 (8.5–131.9)a 44.3±26.6 (3.82–103.0)
OC 12.22±7.12 (2.73–39.58) 9.13±6.01 (1.36–21.43)
WSOC 4.86±2.53 (0.96–10.71) 3.94±2.50 (0.99–10.43)
HULIS 4.83±3.39 (0.12–14.38) 4.71±3.64 (0.59–14.47)
WSOC_h 2.31±0.98 (0.88–4.63) 1.46±0.80 (0.10–3.66)
WISOCb 7.36±5.01 (1.76–28.87) 5.20±3.92 (0.23–13.36)
EC 2.89±1.66 (1.03–11.91) 2.12±1.11 (0.19–4.58)
Na+ 0.39±0.25 (BD-1.26)c 0.39±0.21 (0.10–1.02)
NH+4 6.81±4.23 (0.59–19.42) 5.55±3.59 (0.49–13.19)
Mg2+ 0.06±0.06 (BD-0.34) 0.04±0.03 (BD-0.14)
Cl−
1.24±1.04 (BD-4.38) 1.23±1.19 (BD-5.18)
NO−
3 6.71±6.25 (0.60–29.25) 4.85±4.43 (0.41–18.95)
SO2−
4 13.39±6.79 (1.41–27.35) 12.15±7.21 (2.35–30.55)
C2O2
−
4 0.37±0.17 (BD-0.81) 0.41±0.17 (BD-0.78)
Al 0.49±0.63 (0.06–4.68) 0.37±0.35 (0.05–2.25)
Si 0.92±1.54 (0.14–11.35) 0.68±0.83 (0.06–5.50)
K 0.91±0.57 (0.22–2.89) 0.78±0.62 (0.05–2.22)
Ca 0.23±0.25 (0.03–1.85) 0.15±0.13 (0.03–0.70)
Ti 0.04±0.05 (0.01–0.35) 0.03±0.03 (0.00–0.17)
V 0.02±0.01 (BD-0.04) 0.02±0.01 (0.01–0.05)
Mn 0.05±0.03 (BD-0.12) 0.03±0.02 (BD-0.09)
Fe 0.49±0.48 (0.09–3.54) 0.30±0.26 (0.03–1.63)
Ni 0.01±0.00 (BD-0.02) 0.01±0.00 (0.00–0.02)
Zn 0.38±0.20 (0.07–1.01) 0.27±0.17 (BD-0.67)
Pb 0.13±0.07 (0.02–0.36) 0.09±0.07 (BD-0.31)
Biomass burning and vehicle emission organic tracers (ng m−3)
Levoglucosan 115.4±89.6 (17.90–366.5) 75.0±79.1 (2.64–336.2)
Mannosan 14.9±12.9 (2.79–55.9) 10.7±10.5 (BD-43.4)
Galactosan 6.68±6.10 (BD-26.25) 5.63±5.03 (BD-21.5)
Norhopane 1.48±1.03 (0.26–4.24) 0.43±0.26 (0.06–1.48)
Hopane 1.62±0.94 (0.36–4.47) 0.68±0.35 (0.16–2.17)
a
mean±standard deviation (min– max). A total of 100 samples were included for the calculation of the statistic summary, excluding 2 samples (GZ Jan 26, NS Jan 26) not used in the PMF due to extremely high concentration of biomass burning tracers;
b
WISOC: water-insoluble organic carbon; c
ACPD
14, 23913–23947, 2014Sources of humic-like substances in the
Pearl River Delta
B. Y. Kuang et al.
Title Page
Abstract Introduction
Conclusions References
Tables Figures
◭ ◮
◭ ◮
Back Close
Full Screen / Esc
Printer-friendly Version Interactive Discussion
Discussion
P
a
per
|
Discus
sion
P
a
per
|
Discussion
P
a
per
|
Discussion
P
a
per
|
Table 2.Contribution to HULIS-C from individual sources and percentage of the total modelled HULIS-C.
Site Average HULIS-C Biomass Secondary sulfate Ship emissions
measured burning formation process and sea salt
µg C m−3
µg C m−3
µg C m−3
µg C m−3
Mar–Apr GZ 2.17±0.77 0.54 (25±20 %) 1.36 (63±16 %) 0.27 (12±14 %)
NS 2.45±0.65 0.52 (21±15 %) 1.41 (58±14 %) 0.52 (21±9 %)
May–Aug GZ 1.60±0.99 0.17 (11±10 %) 1.12 (70±21 %) 0.30 (19±12 %)
NS 1.32±1.37 0.10 (8±11 %) 0.64 (49±25 %) 0.58 (44±21 %)
Sep–Oct GZ 2.98±1.39 0.33 (11±7 %) 2.44 (82±7 %) 0.21 (7±8 %)
NS 3.62±2.22 0.32 (9±6 %) 2.50 (69±16 %) 0.80 (22±21 %)
Nov–Feb GZ 3.63±2.44 1.02 (28±14 %) 2.26 (62±13 %) 0.35 (10±13 %)
NS 3.32±2.02 0.68 (20±14 %) 1.80 (54±25 %) 0.84 (25±32 %)
Whole year GZ 2.54±1.78 0.45 (18±15 %) 1.76 (69±17 %) 0.33 (13±13 %)
ACPD
14, 23913–23947, 2014Sources of humic-like substances in the
Pearl River Delta
B. Y. Kuang et al.
Title Page
Abstract Introduction
Conclusions References
Tables Figures
◭ ◮
◭ ◮
Back Close
Full Screen / Esc
Printer-friendly Version Interactive Discussion
Discussion
P
a
per
|
Discus
sion
P
a
per
|
Discussion
P
a
per
|
Discussion
P
a
per
|
Hong Kong Guangzhou
Shenzhen
GZ site
Kwai Chung Port Yantian Port
Shekou Port Nansha Port
NS site Xinsha Port Huangpu Port Guangzhou
Downtown Port
40km