ACPD
12, 8183–8224, 2012Real-time, controlled OH-initiated oxidation
of biogenic SOA
J. G. Slowik et al.
Title Page
Abstract Introduction
Conclusions References
Tables Figures
◭ ◮
◭ ◮
Back Close
Full Screen / Esc
Printer-friendly Version Interactive Discussion
Discussion
P
a
per
|
Dis
cussion
P
a
per
|
Discussion
P
a
per
|
Discussio
n
P
a
per
|
Atmos. Chem. Phys. Discuss., 12, 8183–8224, 2012 www.atmos-chem-phys-discuss.net/12/8183/2012/ doi:10.5194/acpd-12-8183-2012
© Author(s) 2012. CC Attribution 3.0 License.
Atmospheric Chemistry and Physics Discussions
This discussion paper is/has been under review for the journal Atmospheric Chemistry and Physics (ACP). Please refer to the corresponding final paper in ACP if available.
Real-time, controlled OH-initiated
oxidation of biogenic secondary organic
aerosol
J. G. Slowik1,2, J. P. S. Wong1, and J. P. D. Abbatt1
1
Department of Chemistry, University of Toronto, Toronto, ON, Canada
2
Laboratory of Atmospheric Chemistry, Paul Scherrer Institute, Villigen, Switzerland
Received: 12 March 2012 – Accepted: 19 March 2012 – Published: 26 March 2012
Correspondence to: J. G. Slowik (jay.slowik@psi.ch)
ACPD
12, 8183–8224, 2012Real-time, controlled OH-initiated oxidation
of biogenic SOA
J. G. Slowik et al.
Title Page
Abstract Introduction
Conclusions References
Tables Figures
◭ ◮
◭ ◮
Back Close
Full Screen / Esc
Printer-friendly Version Interactive Discussion
Discussion
P
a
per
|
Dis
cussion
P
a
per
|
Discussion
P
a
per
|
Discussio
n
P
a
per
|
Abstract
The chemical complexity of atmospheric organic aerosol (OA) requires novel methods for characterization of its components and description of its atmospheric processing-induced transformations. We present the first field deployment of the Toronto Pho-tooxidation Tube (TPOT), a field-deployable flow reactor for the controlled exposure of
5
ambient aerosol to OH radicals. The system alternates between sampling of (1) un-reacted ambient aerosol, (2) aerosol subjected to a∼4◦C temperature increase, and
(3) aerosol that is both heated and oxidized by OH. This allows both characterization of the aging process and classification of aerosol in terms of its volatility and reaction-based properties. Summertime measurements by an aerosol mass spectrometer
cou-10
pled to the TPOT were performed in the remote forest of Western Canada, resulting in aerosol dominated by biogenic secondary organic aerosol. Volatilization resulted in an approximately 10 to 25 % decrease in organic mass and resulted in a slight increase in oxygenation. OH oxidation resulted in a further organic mass decrease (additional
∼25 %) and yielded an aerosol with O:C values comparable to those characteristic
15
of low volatility, highly oxygenated OA. Most OH-induced changes occurred within the equivalent of∼3 days of atmospheric processing, with further reactions generally
pro-ceeding at a greatly reduced rate. Positive matrix factorization (PMF) analysis of the TPOT data yielded five factors. One factor is related to primary biomass burning or-ganic aerosol, while the others describe oxygenated oror-ganic aerosol (OOA)
compo-20
nents in terms of reactivity and volatility: (1) volatile and reactive; (2) non-volatile and reactive; (3) non-volatile and reactive early-generation product; (4) non-volatile and non-reactive product. This PMF classification of aerosol components directly in terms of reactivity and volatility is enabled by the TPOT-modulated perturbation of aerosol composition, and is not otherwise accessible. The particle-phase reaction end
prod-25
ACPD
12, 8183–8224, 2012Real-time, controlled OH-initiated oxidation
of biogenic SOA
J. G. Slowik et al.
Title Page
Abstract Introduction
Conclusions References
Tables Figures
◭ ◮
◭ ◮
Back Close
Full Screen / Esc
Printer-friendly Version Interactive Discussion
Discussion
P
a
per
|
Dis
cussion
P
a
per
|
Discussion
P
a
per
|
Discussio
n
P
a
per
|
1 Introduction
Atmospheric aerosols have important effects on climate, visibility, and human health. However, quantification of such effects remains highly uncertain due in part to chal-lenges in characterizing the organic aerosol (OA) fraction. Such difficulties include the large number of atmospheric organic compounds, many of which cannot presently be
5
identified or isolated, wide range of emissions sources, and myriad pathways for atmo-spheric OA production and/or processing.
OA can be directly emitted (primary organic aerosol, POA) from sources such as biomass burning and anthropogenic combustion. Alternatively, volatile organic com-pounds (VOCs) may be emitted by biogenic sources, biomass burning, or
anthro-10
pogenic activities, and are then oxidized in the atmosphere to form lower-volatility products that partition to the particle phase, forming secondary organic aerosol (SOA) (Kanakidou et al., 2005; de Gouw and Jimenez, 2009; Hallquist et al., 2009). POA and SOA from different sources can mix and become further oxidized by heterogeneous reaction with oxidizing species such as OH radicals. Further, a significant fraction of
15
ambient OA, whether POA or SOA, is semivolatile and may partition back to the gas phase in response to dilution and/or temperature changes, become further oxidized through gas-phase reactions, and then re-enter the particle phase. All the while, the preexisting OA is subject to continuous injections of fresh POA, SOA, and SOA precur-sors, which in turn undergo the atmospheric processing described above. The resulting
20
OA is a highly complex mixture formed from disparate sources and affected by a wide array of atmospheric processing mechanisms.
Several strategies have been introduced to simplify, isolate, and/or deconvolve these sources and processes. Factor analysis techniques applied to aerosol composition are frequently used for source apportionment. Such approaches include chemical mass
25
ACPD
12, 8183–8224, 2012Real-time, controlled OH-initiated oxidation
of biogenic SOA
J. G. Slowik et al.
Title Page
Abstract Introduction
Conclusions References
Tables Figures
◭ ◮
◭ ◮
Back Close
Full Screen / Esc
Printer-friendly Version Interactive Discussion
Discussion
P
a
per
|
Dis
cussion
P
a
per
|
Discussion
P
a
per
|
Discussio
n
P
a
per
|
Zhao and Hopke, 2006; Lanz et al., 2007; Ulbrich et al., 2009), which utilizes mea-surement uncertainties and does not require a priori knowledge of the factor profiles. Hybrid approaches, such as PMF with one or more fixed factors, have also been utilized (Lanz et al., 2008), as have custom models based on known tracers, variable factors, etc. (Wahlin 2003; Zhang et al., 2005; Christensen et al., 2006). For all of these
ap-5
proaches, a central challenge is the source complexity and constantly changing nature (via gas/particle partitioning and chemical reactivity) of the measured aerosol. Descrip-tions of SOA generation and/or aging are particularly challenging. For example, PMF of data from the Aerodyne aerosol mass spectrometer (AMS), typically describes SOA as a linear combination of semivolatile and low-volatility oxygenated organic aerosol,
10
however more detailed information about reactivity, volatility, sources, etc. is unavail-able in the absence of other integrated measurements, such as VOCs (Slowik et al., 2010) or with an online thermodenuder (Huffman et al., 2009).
In contrast, laboratory-based methods potentially allow for controlled aging pro-cesses and emission sources, but can be challenging to extrapolate to the
atmo-15
sphere. Smog chambers provide a laboratory-based method for controlled exposure of model compounds or selected source emissions to oxidizing species. Common model compounds studied include isoprene, α-pinene, or other terpenes as surrogates for biogenic emissions, and aromatic species such as toluene as surrogates for anthro-pogenic combustion. Alternatively, source emissions such as wood burning and diesel
20
vehicles may be injected directly into the smog chamber, and then aged under con-trolled conditions (Grieshop et al., 2009; Mentel et al., 2009; Chirico et al., 2010). Such analysis of model compounds and specific sources allows for isolation of particular reaction systems, however simplification of the reactive system and/or increased con-centrations relative to ambient conditions make it challenging to directly extrapolate
25
such results to the atmosphere.
ACPD
12, 8183–8224, 2012Real-time, controlled OH-initiated oxidation
of biogenic SOA
J. G. Slowik et al.
Title Page
Abstract Introduction
Conclusions References
Tables Figures
◭ ◮
◭ ◮
Back Close
Full Screen / Esc
Printer-friendly Version Interactive Discussion
Discussion
P
a
per
|
Dis
cussion
P
a
per
|
Discussion
P
a
per
|
Discussio
n
P
a
per
|
complexity of ambient measurements while allowing a controlled aging environment. Similar flowtube systems have previously been used to measure the reactivity of ambi-ent urban aerosol (George et al., 2008), estimate the SOA-forming potambi-ential of model compounds (Kang et al., 2011), and characterize the evolution of laboratory biomass burning emissions (Cubison et al., 2011). They have also been applied to studies of
5
oxidative aging of laboratory aerosol (George et al., 2007; Kroll et al., 2009; George and Abbatt, 2010; Kessler et al., 2010; Lambe et al., 2011a,b). In the TPOT, aging is conducted in a flowtube with a residence time on the order of minutes and the sys-tem rapidly switches between reacted and unreacted conditions, which enables highly time-resolved measurements of aerosol aging. The resulting mass spectral changes
10
due to oxidative processing are characterized in terms of selectedm/z and using the PMF analysis technique. Changes to particle CCN properties are described in a sepa-rate publication (Wong et al., 2011). Here we discuss deployment of the TPOT during summer in a forested region known for high levels of biogenic aerosol formation without significant anthropogenic pollution. We address the following questions: (1) Does OH
15
oxidation lead to mass loss of biogenic organic aerosol? (2) What is the character of the mass spectral response, and what insight does it provide regarding the oxidation mechanism? (3) Can PMF analysis demonstrate how different fractions of the biogenic aerosol respond to OH oxidation?
2 Materials and methods
20
2.1 Sampling location
Measurements were conducted as part of the Whistler Aerosol and Cloud Study (WACS 2010, 15–28 July 2010). The TPOT system was deployed at the Raven’s Nest station (1320 m a.s.l.) on Whistler Mountain in Whistler, BC, Canada (50.08◦N, 122.95◦W). Whistler is located in the remote Canadian forest, approximately 120 km 25
ACPD
12, 8183–8224, 2012Real-time, controlled OH-initiated oxidation
of biogenic SOA
J. G. Slowik et al.
Title Page
Abstract Introduction
Conclusions References
Tables Figures
◭ ◮
◭ ◮
Back Close
Full Screen / Esc
Printer-friendly Version Interactive Discussion
Discussion
P
a
per
|
Dis
cussion
P
a
per
|
Discussion
P
a
per
|
Discussio
n
P
a
per
|
450 m below treeline. A detailed overview of the WACS 2010 campaign is presented elsewhere (Macdonald et al., 2012). Organic aerosol in the Whistler area has pre-viously been shown to be strongly influenced by biogenic emissions during the late spring and early summer (e.g., Leaitch et al., 2009; Sun et al., 2009; Schwartz et al., 2010; Takahama et al., 2011; Leaitch et al., 2011). Later in the summer, regional
for-5
est fire emissions can also influence the site (McKendry et al., 2011; Takahama et al., 2011). The sampling period for WACS 2010 was chosen to maximize biogenic influ-ences, while minimizing biomass burning ones. As discussed in the results section, this strategy was mostly successful, with the exception of a regional biomass burning event during the last few days of the study. A large biogenic event with organic aerosol
10
levels approaching 6.5 µg m−3
was observed from 6 to 10 July, while significant local formation of SOA from monoterpene oxidation observed in the diurnal cycles of 13 to 21 July (Macdonald et al., 2012).
The TPOT was housed in an unused single-story restaurant at the Raven’s Nest site. The sampling inlet was located approximately 0.5 m above the roof of the building. Air
15
was continuously sampled through this inlet at 1100 sccm, passing through 3 m of 6 mm o.d. stainless steel tubing before being introduced into the TPOT. The sampling lines were electrochemically coated with amorphous silicon (SilcoTek, Bellefonte, PA, USA) to minimize adsorptive losses of volatile organic compounds. Controlled OH-initiated oxidation was performed in the TPOT system (see Sect. 2.2), and the resulting particle
20
composition was measured by aerosol mass spectrometry (see Sect. 2.3).
2.2 Toronto Photooxidation Tube (TPOT)
The TPOT is conceptually based on flow reactor systems previously described and characterized in the literature (George et al., 2007; Lambe et al., 2011a). A schematic of the system is shown in Fig. 1. All surfaces in the system that contact ambient air are
25
ACPD
12, 8183–8224, 2012Real-time, controlled OH-initiated oxidation
of biogenic SOA
J. G. Slowik et al.
Title Page
Abstract Introduction
Conclusions References
Tables Figures
◭ ◮
◭ ◮
Back Close
Full Screen / Esc
Printer-friendly Version Interactive Discussion
Discussion
P
a
per
|
Dis
cussion
P
a
per
|
Discussion
P
a
per
|
Discussio
n
P
a
per
|
TPOT system at 40 % RH, and a mixed N2/O2 flow are combined in a Pyrex mix-ing volume (residence time∼1 min). The N2/O2 flow is either irradiated by a lamp at
185 nm to produce O3, or bypasses the lamp system. The N2/O2path is controlled by
an automatic 4-way valve system that switches between conditions every 12 min. To maintain system stability, flow is continuously maintained through both the lamp and
5
lamp-bypass lines, with one line introduced into the TPOT and the other exhausted to a pump. Ozone concentrations are monitored in the exhaust line using a Model 202 Ozone Analyzer (2B Technologies, Inc., Boulder, CO, USA).
After the mixing chamber, particles pass into the reaction zone. This consists of a silicon-coated stainless steel tube (11 cm o.d.×29 cm length) with 4-point injection
10
and sampling configurations on the entrance and exit flanges. A UV lamp emitting at 254 nm is located on the center axis of the tube, and is surrounded by a quartz housing. A∼20 slpm flow of air is maintained between the lamp and the housing to prevent lamp
overheating and minimize lamp-induced temperature increases in the flowtube. During WACS 2010, the lamp subjected the sampled air to a temperature increase of∼4◦C.
15
Residence time in the reaction zone is approximately 1 min. Alternatively, a manual 3-way valve can be used to send particles through a bypass flow tube system that is identical in all ways to the reaction zone, except that the quartz housing contains no lamp. After passing through the reaction zone or reaction bypass, particles were sampled by an aerosol mass spectrometer (C-ToF-AMS, see Sect. 2.3), as well as
20
a differential mobility analyzer coupled to a condensation particle counter and a cloud condensation nuclei counter, as discussed elsewhere (Wong et al., 2011).
The OH concentration in the TPOT is controlled by varying the O3concentration in the N2/O2 flow. Steady-state OH concentrations are determined by calibration
exper-iments in which the decay of methyl-ethyl-ketone (MEK) is measured using a
time-25
of-flight proton transfer reaction mass spectrometer (ToF-PTRMS, Ionicon Analytik, Innsbruck, Austria). This allowed formation of an empirical relationship between O3
ACPD
12, 8183–8224, 2012Real-time, controlled OH-initiated oxidation
of biogenic SOA
J. G. Slowik et al.
Title Page
Abstract Introduction
Conclusions References
Tables Figures
◭ ◮
◭ ◮
Back Close
Full Screen / Esc
Printer-friendly Version Interactive Discussion
Discussion
P
a
per
|
Dis
cussion
P
a
per
|
Discussion
P
a
per
|
Discussio
n
P
a
per
|
sebacate (C26H50O4, BES) particles into the TPOT immediately before or after an MEK calibration at the same conditions. BES is an organic liquid with well-characterized het-erogeneous OH reactivity (George et al., 2007). This calibration allowed the generation of an empirical relationship between OH exposure (and O3concentration) and BES re-action as described by the frre-actional increase in AMSm/z44. Periodic BES calibrations
5
throughout the campaign were used to confirm the stability of the O3concentration/OH
exposure relationship. Control experiments indicated negligible reactivity with O3 at TPOT concentrations (2×10¹² to 2×10¹³molec cm−3) (see Fig. S1). OH exposures
calculated from the MEK calibrations were reproducible to within∼30 %.
2.3 Aerosol mass spectrometer
10
The Aerodyne time-of-flight aerosol mass spectrometer (C-ToF-AMS, Aerodyne Re-search, Inc., Billerica, MA, USA) provides the non-refractory composition of particles with vacuum aerodynamic diameter between approximately 60 and 600 nm (Drewnick et al., 2005). Instrument characteristics and operating/analysis procedures are de-scribed in detail in the literature (e.g., Jayne et al., 2000; Allan et al., 2003; Canagaratna
15
et al., 2007). Particles are continuously sampled from atmosphere through a 100 µm critical orifice (∼100 cm3min−1) into an aerodynamic lens (∼2 Torr), which focuses
the particles into a narrow beam. The particles impact on a resistively-heated tungsten surface (600◦C, 10−7Torr), where they flash vaporize. The resulting gas is ionized by electron impact (70 eV) and the ions are detected by a time-of-flight mass
spectrom-20
eter (Tofwerk AG, Thun, Switzerland). The AMS also has particle sizing capabilities, but these were not utilized during the present study. Mass spectra were recorded with 1 min time resolution.
During normal operation, the particle beam is alternately blocked, yielding the in-strument background, and unblocked. The difference between these two
measure-25
ments is the mass spectrum of the sampled particles, together with signal from the major gases in air (primarily N2, O2, H2O, Ar, and CO2). Contributions from these
ACPD
12, 8183–8224, 2012Real-time, controlled OH-initiated oxidation
of biogenic SOA
J. G. Slowik et al.
Title Page
Abstract Introduction
Conclusions References
Tables Figures
◭ ◮
◭ ◮
Back Close
Full Screen / Esc
Printer-friendly Version Interactive Discussion
Discussion
P
a
per
|
Dis
cussion
P
a
per
|
Discussion
P
a
per
|
Discussio
n
P
a
per
|
through the ToF-AMS Toolkit v1.51 data analysis package (D. Sueper, U. of Colorado-Boulder, Colorado-Boulder, CO, USA) for Igor Pro v6.22A (Wavemetrics, Inc., Lake Oswego, OR, USA) based on the mass spectral fragmentation analysis algorithm developed by Al-lan et al. (2003). These algorithms are also used to quantitatively separate organic ion signals from other species. Gaseous fragmentation patterns were characterized using
5
regular filter measurements to zero the particle signal. A collection efficiency of 0.5 is assumed throughout the AMS transmission window. However, the analysis herein utilizes normalized values or ratios and is therefore unaffected by this assumption.
2.4 Positive matrix factorization
The AMS organic mass spectral time series was analyzed using positive matrix
fac-10
torization (PMF) (Paatero and Tapper, 1994; Paatero 1997). PMF represents the AMS time series as a linear combination of static factor profiles and their time-dependent intensities according to the matrix equationX=GF+E, whereXis the data matrix (i time points×jm/z), theGmatrix contains the factor time series matrix (i time points×p
factors), theF matrix contains the factor mass spectra (p factors vs. j m/z) and Eis
15
the residual matrix (i time points×jm/z). PMF requires as inputs the AMS mass
spec-tral time series and associated uncertainties, which are calculated according to Allan et al. (2003). The first application of PMF to AMS datasets was conducted by Lanz et al. (2007), and many other studies have followed.
For the TPOT data during WACS 2010, the AMS datasetX consists of 20 778 time
20
points (i.e. 1-min mass spectra) and 270m/z. A minimum error corresponding to mea-surement of a single ion was applied to the dataset and m/z assumed in AMS data analysis procedures to be proportional tom/z 44 were downweighted as described in Ulbrich et al. (2010). No further downweighting was applied to the dataset.
PMF allows the user to determine the number of factors in the output solution; here
25
solutions containing 1 to 12 factors were investigated. Matrix rotations were explored by varying thefPeakparameter from−2 to 2. The selected solution (see Sect. 3.3) was
ACPD
12, 8183–8224, 2012Real-time, controlled OH-initiated oxidation
of biogenic SOA
J. G. Slowik et al.
Title Page
Abstract Introduction
Conclusions References
Tables Figures
◭ ◮
◭ ◮
Back Close
Full Screen / Esc
Printer-friendly Version Interactive Discussion
Discussion
P
a
per
|
Dis
cussion
P
a
per
|
Discussion
P
a
per
|
Discussio
n
P
a
per
|
and 0 were not convergent, and the negativefPeaksolutions provided more clearly
dis-tinguished factors than the positivefPeakones. Each factor in the 5-factor solution could
be interpreted meaningfully, making it preferable to lower-order solutions. Higher order solutions provided uninterpretable factors and/or split/mixed factors, which frequently indicate an excessive number of factors (Ulbrich et al., 2010). The possibility of local
5
minima in the PMF solution was explored by initiating the PMF algorithm from 150 dif-ferent random starting points (“seeds”); no solutions with significant differences from the selected solution were found.
3 Results and discussion
The Whistler site is in a forested region with strong monoterpene emissions. A
sum-10
mary of the major results from the WACS 2010 campaign is provided elsewhere (Mac-donald et al., 2012). During the periods of TPOT sampling, the aerosol can mostly be classified as biogenic SOA resulting from gas-phase oxidation of monoterpenes. The primary exception to this classification occurred near the end of the campaign (26 to 27 July), when the site was influenced by transported aerosol from regional forest fires.
15
Strong diurnal cycles of organic mass, biogenic VOC emissions and oxidizing species are observed, which can be attributed both to both upslope/downslope flow and local chemical reactions.
As discussed in Sect. 2.2, aerosol passing through the TPOT is subjected to one of four conditions: (1) unreacted ambient aerosol (ambient condition, “Amb”); (2)
expo-20
sure to O3(ambient+O3condition, “AmbO3”); (3) exposure to UV light (ambient+heat
condition, “AmbHt”); and (4) exposure to O3 and light, resulting in exposure to OH
radicals (ambient+heat+OH condition, “AmbHtOH”). Control experiments comparing conditions (1) and (2) to determine the effects of O3 exposure showed no changes
above detection limit to either the total organic mass or individualm/z within the
spec-25
ACPD
12, 8183–8224, 2012Real-time, controlled OH-initiated oxidation
of biogenic SOA
J. G. Slowik et al.
Title Page
Abstract Introduction
Conclusions References
Tables Figures
◭ ◮
◭ ◮
Back Close
Full Screen / Esc
Printer-friendly Version Interactive Discussion
Discussion
P
a
per
|
Dis
cussion
P
a
per
|
Discussion
P
a
per
|
Discussio
n
P
a
per
|
both as the “Amb” condition. For the AmbHt condition, we cannot distinguish the effects of volatilization and irradiation by 254 nm light, but expect volatility to be the dominant effect. We further note that although only a 4◦C temperature increase was measured for the AmbHt condition, some larger local increases in temperature may occur within the TPOT, especially near the quartz tube. Effects of volatilization and OH oxidation on
5
the mass spectra are treated separately below in Sects. 3.1 and 3.2. Because repeated perturbation of the ambient aerosol by the TPOT forces mass spectral variability based on particle volatility and reactivity, factor analysis describes the particle composition in terms of these properties. This is illustrated via PMF analysis of the TPOT AMS data in Sect. 3.3. The duration of Amb, AmbHt, and AmbHtOH periods varies throughout the
10
study in response to changes in selected OH exposure and observed ambient aerosol composition. Listings of the averaging periods used are presented in the Supplement (Table S1 for Amb, Table S2 for AmbHt and AmbHtOH).
3.1 Volatilization
Figure 2 shows a sample time series of TPOT data, with ambient (“Amb”), ambient+
15
heat (“AmbHt”), and ambient+heat+OH (“AmbHtOH”) conditions labelled. The figure shows a decrease in organic mass on the order of 15 % between the ambient and ambient+heat conditions. Note that the ambient+heat condition represents only a∼
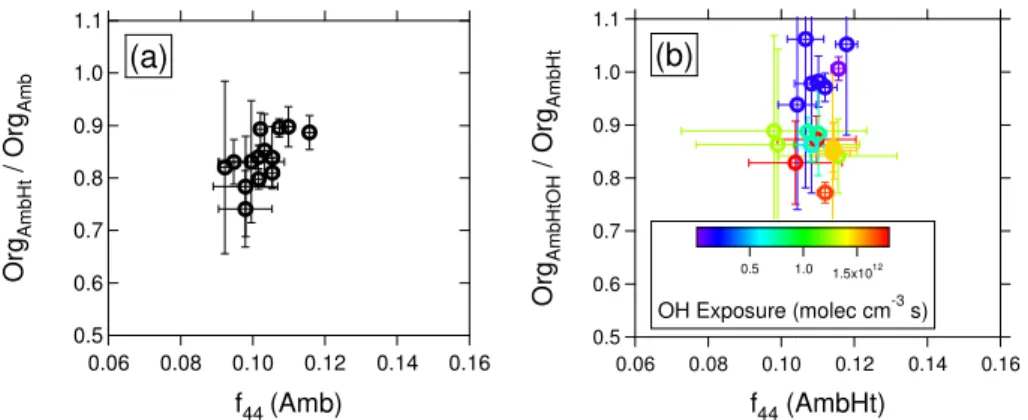
4◦C increase in temperature, indicating that the particles are quite volatile. Figure 3a shows the fraction of mass lost as a result of this volatilization as a function off44 over 20
the entire campaign, wheref44 is defined as the fraction of organic mass occurring at
m/z44. (Averaging periods for the data points in this and similar figures are reported in Table S1.) For each point in Fig. 3a, the OrgAmb is calculated as the mean of a single
ambient measurement period, as denoted by one of the labelled periods in Fig. 2. The corresponding OrgAmbHt data is drawn from the average of the two nearest flanking 25
AmbHt periods (12 min). The signal atm/z 44 is dominated by the CO+2 ion, which in the AMS is frequently observed from organic acids (e.g., Duplissy et al., 2011).f44can
ACPD
12, 8183–8224, 2012Real-time, controlled OH-initiated oxidation
of biogenic SOA
J. G. Slowik et al.
Title Page
Abstract Introduction
Conclusions References
Tables Figures
◭ ◮
◭ ◮
Back Close
Full Screen / Esc
Printer-friendly Version Interactive Discussion
Discussion
P
a
per
|
Dis
cussion
P
a
per
|
Discussion
P
a
per
|
Discussio
n
P
a
per
|
volatilization causes a loss of 10 to 25 % of the organic signal. As shown in Fig. 3a, the fraction of volatilized organics decreases with increasingf44, suggesting that particle
volatility is inversely related to oxygenation, which is consistent with previous studies (e.g., Huffman et al., 2009). While the correlation shows significant scatter, the trend is evident. Quite striking is the significant fraction of volatilized organic mass, despite
5
the very small temperature change. This indicates that freshly-formed biogenic SOA is sufficiently volatile to engage readily in gas/particle partitioning. Note also that some volatilized OA may recondense on the particles, so the mass loss in Fig. 3a is in fact a lower limit for the aerosol volatility. Sample mass spectra comparing the Amb and AmbHt conditions are shown in Fig. S2.
10
3.2 OH oxidation
Exposure of aerosol to OH radicals (i.e. the AmbHtOH) condition causes a further de-crease in organic mass relative to OrgAmbHt. As shown in Fig. 3b, the magnitude of
this decrease depends primarily on OH exposure, with the extent of oxidation of the unprocessed particle (as represented by f44) having little effect. (Averaging periods 15
for this and similar figures are given in Table S2.) A crucial feature of this plot is that an organic mass increase beyond experimental uncertainties is not observed for any OH exposure. This suggests that chemistry in the TPOT is dominated by heteroge-neous reactions and/or gas-phase reactions of semivolatile species partitioning from the particle phase, and that SOA formation is not significant. This is consistent with the
20
flowtube intercomparison study of Lambe et al. (2011a), which showed the SOA yield from a system decreases with an increasing ratio of wall surface area to volume. Peak monoterpene concentrations during the period of TPOT sampling were on the order of 0.5 ppbv (Macdonald et al., 2012); at these levels, significant TPOT SOA formation is not expected (Lambe et al., 2011a). SOA yields also decrease with decreasing VOC
25
ACPD
12, 8183–8224, 2012Real-time, controlled OH-initiated oxidation
of biogenic SOA
J. G. Slowik et al.
Title Page
Abstract Introduction
Conclusions References
Tables Figures
◭ ◮
◭ ◮
Back Close
Full Screen / Esc
Printer-friendly Version Interactive Discussion
Discussion
P
a
per
|
Dis
cussion
P
a
per
|
Discussion
P
a
per
|
Discussio
n
P
a
per
|
Figure 4 describes the changes in the AMS mass spectra due to volatilization and OH oxidation using the framework developed by Ng et al. (2010). Ambient SOA typi-cally falls within the triangle denoted by the solid lines in the figure, with more aged (and typically less volatile) SOA lying in the upper left. PMF analyses of AMS spectra often resolve two SOA-related factors, termed low-volatility and semi-volatile oxygenated
or-5
ganic aerosol (LV-OOA and SV-OOA), which, respectively fall in the upper left and lower sections of this triangle. As shown in the figure, the ambient particles begin in the SV-OOA region of the triangle. Volatilization (AmbHt condition) moves them only slightly upwards and to the left. However, a strong effect is seen from OH oxidation. At the low-est OH exposure levels (∼1.5×10¹¹molec cm−3s), only a slight movement towards the
10
upper left is observed. However, the highest OH exposures (∼1.5×10¹²molec cm−3s)
move the composition well into the LV-OOA region of the triangle. These OH expo-sures correspond to approximately 0.85 and 10 days of atmospheric aging, respec-tively, assuming a 24-h mean OH concentration of 2×10⁶molec cm−3. Note,
how-ever, that significant aging takes place on shorter timescales; an OH exposure of
15
∼5.8×10¹¹molec cm−3s (∼3.7 days) already causes movement into the LV-OOA
re-gion.
While the framework utilized in Fig. 4 provides a simple overview of the aging pro-cess, additional information is available from consideration of the entire mass spec-trum. Figure 5 shows the effects of low and high OH exposures on the intensities of
20
all organicm/z up tom/z 125. Changes in the mass spectra are plotted as the ratio of spectra obtained under the AmbHtOH condition to the AmbHt condition. Spectra are not normalized, so a value of 1 indicates no change in the mass measured at thatm/z, while values >1 or<1 indicate mass increases or decreases, respectively. The fig-ures show decreases at allm/z except form/z 44, 45, andm/z dependent on 44. (In
25
ACPD
12, 8183–8224, 2012Real-time, controlled OH-initiated oxidation
of biogenic SOA
J. G. Slowik et al.
Title Page
Abstract Introduction
Conclusions References
Tables Figures
◭ ◮
◭ ◮
Back Close
Full Screen / Esc
Printer-friendly Version Interactive Discussion
Discussion
P
a
per
|
Dis
cussion
P
a
per
|
Discussion
P
a
per
|
Discussio
n
P
a
per
|
atm/z 45. Approximately 10 % of the signal at this ion results from the CO+2 isotope, and the rest is probably dominated by the HCO+2 ion, which would also suggest the formation of organic acids. While the C-ToF-AMS does not have the mass resolution to quantitatively distinguish ions occurring at the same nominal m/z, a brief analysis of the raw spectral data supports HCO+2 as a strong contributor to m/z 45. The peak
5
intensity atm/z45 occurs at 45.00 amu (exact mass of HCO+2=45.00 amu). This can be compared withm/z 44 (peak intensity at 43.99 amu), which is known to be dominated by CO+2 (exact mass 43.99 amu). A further comparison with m/z 43 (peak intensity at 43.02 amu), which is likely dominated by the C2H3O+ ion (exact mass 43.02 amu), suggests that sufficient m/z resolution is available to rule out dominant contributions
10
from ions such as CH3NO+ (45.02 amu), C2H5O+ (45.03 amu), and C2H7N+ (45.06)
amu. The CHS+(44.98 amu) and HN2O+(45.01 amu) ions are more difficult to rule out
based on the spectra, but are not consistent with observed trends towards oxidation (CHS+) and organonitrate consumption during oxidation (HN2O+), discussed below.
While decreased mass due to OH oxidation is evident throughout the spectra shown
15
in Fig. 5, the fractional decrease varies significantly by m/z. For example, at the high OH exposure,m/z 43 decreases by 37 %, while m/z 105 decreases by 47 %. Gener-ally, the fractional decrease is larger for fragments at higher m/z and for fragments characteristic of hydrocarbons or slightly oxygenated hydrocarbons. The change in mass for selected fragments (m/z 43, 44, 55, and 91) and total organic mass is shown
20
as a function of OH exposure in Fig. 6. The trends shown in Fig. 5 are also evident in this figure, with for example m/z 91 showing a stronger decrease than m/z 43. However, Fig. 6 also provides additional insight into the rate of heterogeneous oxi-dation. The rate of mass decrease slows considerably after∼3 days of oxidation (OH
exposures∼6.9×10¹¹molec cm−3s), as do the changes in composition.
25
Fitting the m/z 44 production to the function y =1+a(1−e−kx) yields a kinetic
rate constant of 3.0×10⁻¹²cm3molec−1s−1. While significant uncertainties exist
ACPD
12, 8183–8224, 2012Real-time, controlled OH-initiated oxidation
of biogenic SOA
J. G. Slowik et al.
Title Page
Abstract Introduction
Conclusions References
Tables Figures
◭ ◮
◭ ◮
Back Close
Full Screen / Esc
Printer-friendly Version Interactive Discussion
Discussion
P
a
per
|
Dis
cussion
P
a
per
|
Discussion
P
a
per
|
Discussio
n
P
a
per
|
(C26H50O4), a long-chain saturated hydrocarbon with two ester groups (k =5.58×
10−13cm3molec−1s−1, George et al., 2007). The TPOT m/z 44 production rate is quite similar to the production of primary products from BES oxidation (k=2.8×
10−12cm3molec−1s−1), suggesting that m/z 44 (characteristic of carboxylic acids) is
a primary product of the ambient aerosol oxidation, rather than requiring multiple steps
5
to be produced. This is also consistent with the lack of increase at anym/z other than 44 in Fig. 6.
Oxidation of biogenic SOA in this study has some similarities to heterogeneous OH oxidation of urban aerosol. For the urban aerosol,m/z 44 enhancement of up to 20 % was observed (George et al., 2008), while a 25 % increase was observed for biogenic
10
SOA (see Fig. 6). For both aerosol types, production ofm/z 44 occurs relatively rapidly, with most of the production occurring in less than∼3 days of OH exposure. This
sug-gests a similar rate for functionalization reactions. However, the total biogenic SOA mass decreased even at low exposures, quickly reaching its maximum decrease of
∼15 % in less than∼3 days of OH exposure. In contrast, decrease in urban OA mass
15
was observed until ∼8 days of exposure, although a similar OA decrease (∼20 %)
was observed for the highest exposures (George et al., 2008). The similar OA loss at high exposures suggests similar functionalization/fragmentation branching ratios for the two aerosol types. However, the lower OH exposures needed to induce OA loss for the biogenic aerosol indicates that fewer fragmentation reactions are required, perhaps
20
because the biogenic SOA has a product distribution weighted towards more volatile species.
Further insight into the mechanistic changes to biogenic SOA associated with het-erogeneous OH oxidation can be used by investigation of the location of the OA in the Van Krevelen space, that is the molecular H:C ratio as a function of the O:C ratio.
Be-25
ACPD
12, 8183–8224, 2012Real-time, controlled OH-initiated oxidation
of biogenic SOA
J. G. Slowik et al.
Title Page
Abstract Introduction
Conclusions References
Tables Figures
◭ ◮
◭ ◮
Back Close
Full Screen / Esc
Printer-friendly Version Interactive Discussion
Discussion
P
a
per
|
Dis
cussion
P
a
per
|
Discussion
P
a
per
|
Discussio
n
P
a
per
|
organic mass fractions at m/z 43. The Ng et al. (2011a) parameterization has been evaluated for SOA only, and only for OA where 0.05< f43<0.25 andf44>0.06. The
f43 and f44 conditions are satisfied for the current dataset (f43 minimum/maximum=
0.067/0.093; f44 minimum/maximum=0.10/0.23). The organic aerosol composition
during periods of TPOT operation was likely dominated by SOA (Macdonald et al.,
5
2012) with the exception of 26 to 27 July, when the site was influenced by local biomass burning emissions.
Figure 7a shows the Van Krevelen plot (estimated molecular H:C vs. O:C ratios) for the AmbHt and AmbHtOH conditions (open and closed symbols, respectively), with the data points colored by OH exposure. Corresponding AmbHt and AmbHtOH conditions
10
are connected by a line, the slope of which is plotted in Fig. 7b as a function of the OH exposure. Points that are possibly influenced by the 26 to 27 July biomass burn-ing plume are labeled (and discussed in Sect. 3.3). Similar to Fig. 6, most chemical changes to the aerosol already occur for OH exposures below 6.9×10¹¹molec cm−3s
(∼3 days of oxidation). The slope of the Van Krevelen plot has previously been
inter-15
preted in terms of changes in organic functionality (e.g., Heald et al., 2010; Ng et al., 2011a). In the present study, Van Krevelen slopes of approximately −0.1 and −0.2
are observed for low and high OH exposures, respectively. The lack of increase in any m/z other than m/z 44 (see Figs. 5 and 6) suggests that COOH groups are the dominant functionality produced by OH exposure at both high and low exposures, and
20
therefore the OH-dependent differences in observed slopes in Fig. 7b are likely due to the consumed functional groups and/or the relative importance of specific functional-ization vs. fragmentation pathways. Given the∼10 % uncertainty in the H:C
parame-terization (Ng et al., 2011a) and the assumptions discussed above, the obtained Van Krevelen slopes are consistent with knownα-pinene oxidation mechanisms. For
exam-25
ple, the oxidation of the 1st-generation productcis-pinonic acid (C10H16O3) tocis-pinic acid (C9H14O4) follows a slope of −0.3, while subsequent oxidation to
ACPD
12, 8183–8224, 2012Real-time, controlled OH-initiated oxidation
of biogenic SOA
J. G. Slowik et al.
Title Page
Abstract Introduction
Conclusions References
Tables Figures
◭ ◮
◭ ◮
Back Close
Full Screen / Esc
Printer-friendly Version Interactive Discussion
Discussion
P
a
per
|
Dis
cussion
P
a
per
|
Discussion
P
a
per
|
Discussio
n
P
a
per
|
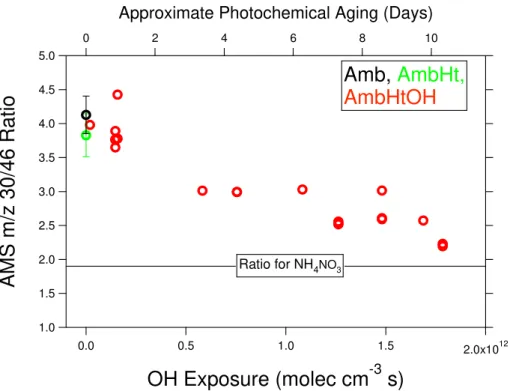
Organonitrates have previously been identified in AMS data by an increased ratio of m/z 30 to 46 relative to that of NH4NO3 (Farmer et al., 2010). For the present study,
NH4NO3yielded a 30/46 ratio of 1.9, which is much lower than the 4.1±0.3 observed
in the ambient aerosol. An increased 30/46 ratio is not by itself conclusive proof of organonitrates, as this value also increases as the result of inorganic species such as
5
NaNO3and Ca(NO3)2. However, as shown in Fig. 8, the 30/46 ratio decreases
signifi-cantly with OH exposure. Reaction with OH is unlikely for inorganic salts and the data therefore suggests significant organonitrate content in the aerosol, which decreases in amount with OH oxidation.
3.3 PMF analysis
10
Positive matrix factorization was conducted on the TPOT AMS organic mass spectra. The analyzed dataset includes the Amb, AmbHt, and AmbHtOH conditions. When ap-plied to an AMS mass spectral time series, PMF uses temporal correlations between m/z to resolve factors. Temporal variability in the mass spectrum is therefore required for PMF analysis. In conventional AMS datasets (i.e. direct ambient sampling), this
15
variability is governed by factors such as transport, source locations, atmospheric re-actions, etc. In contrast, mass spectral variability in the TPOT dataset is governed by volatilization and OH oxidation. Therefore, separation of factors in the TPOT PMF is governed by properties of particle components such as volatility, reactivity, and reaction product formation. This provides a useful framework for discussing particle properties
20
and aging that would not otherwise be accessible.
A 5-factor solution was selected for the TPOT PMF. This solution provides a set of factors that can each be meaningfully interpreted. Higher-order solutions include “split” factors, which can indicate an excessive number of factors (Ulbrich et al., 2009) and/or factors that cannot be meaningfully interpreted from the available data. An excerpt of
25
ACPD
12, 8183–8224, 2012Real-time, controlled OH-initiated oxidation
of biogenic SOA
J. G. Slowik et al.
Title Page
Abstract Introduction
Conclusions References
Tables Figures
◭ ◮
◭ ◮
Back Close
Full Screen / Esc
Printer-friendly Version Interactive Discussion
Discussion
P
a
per
|
Dis
cussion
P
a
per
|
Discussion
P
a
per
|
Discussio
n
P
a
per
|
shown to make visible the effects of TPOT conditions, and a sample of the Amb, AmbHt, and AmbHtOH conditions are shown as shaded regions. Figure 9b shows a strong in-crease in the biomass burning organic aerosol (BBOA) factor coinciding with arrival of the plume at the sampling site. In addition to the AMS BBOA factor, the effects of the plume could be observed visually and by smell, through a spike in gas-phase
acetoni-5
trile (Macdonald et al., 2012), and connected by meteorology to known local forest fires. The other four factors can all be classified as subtypes of oxygenated organic aerosol (OOA) and are distinguished by their volatility and reactive behavior. We denote these factors as OOAR,V, OOAR,NV, OOARP,NV, and OOAP,NV, where the first subscript
de-scribes reactivity (R=consumed by reaction with OH, RP=may react with or be
pro-10
duced by OH, P=produced by reaction with OH), and the second subscript describes volatility (V=volatile in the TPOT, NV=non-volatile in the TPOT). Note that volatility is operationally defined from the∼4◦C increase in temperature from the TPOT lamp, as
discussed in Sect. 3.1. Thus, for example, OOAR,V is both reactive and volatile. This is evident in Fig. 9 from the decreased OOAR,Vmass going from the Amb to AmbHt con-15
ditions, and further decrease from AmbHt to AmbHtOH. The figure shows that OOAR,V
is the only factor affected by the Amb/AmbHt transition. However, OH exposure causes a strong decrease in OOAR,NV, and produces OOAP,NV. Depending on the OH
expo-sure, OOARP,NV may be produced (right-hand side of Fig. 9a,b), unaffected (left-hand
side of Fig. 9b), or reacted away (not shown here but discussed later in conjunction
20
with Fig. 11).
The PMF factor mass spectra are shown in Fig. 10. Among the OOA factors, thef44
value (which correlates with O:C), is at its minimum for the volatile component OOAR,V (f44 =0.016). Within the NV components,f44 increases as the factors move from
re-actants to products (f44(OOAR,NV)=0.10;f44(OOARP,NV)=0.18;f44(OOAP,NV)=0.24). 25
This provides direct evidence linking O:C with both volatility and reaction progress. A second trend in the mass spectra is the prevalence of fragments at higherm/z for the more reactive and volatile species. The OOAR,V and OOAR,NV spectra are both
ACPD
12, 8183–8224, 2012Real-time, controlled OH-initiated oxidation
of biogenic SOA
J. G. Slowik et al.
Title Page
Abstract Introduction
Conclusions References
Tables Figures
◭ ◮
◭ ◮
Back Close
Full Screen / Esc
Printer-friendly Version Interactive Discussion
Discussion
P
a
per
|
Dis
cussion
P
a
per
|
Discussion
P
a
per
|
Discussio
n
P
a
per
|
from conventional PMF analyses, while the OOANR,NV and OOAP,NV spectra are more similar to previously reported LV-OOA. The BBOA factor shows somewhat elevated signal atm/z 60 and 73, which both individually constitute∼0.5 % of the total organic
signal. These m/z result from fragmentation of cellulose pyrolysis products such as levoglucosan and are frequently used as tracers for biomass burning influence in AMS
5
spectra. The contributions of these twom/z to the BBOA spectrum are larger by ap-proximately a factor of 2 or more than their contributions to any other factor.
Figure 11 shows the effect of OH exposure on TPOT PMF factor mass concentra-tions. The BBOA, OOAR,V, OOAR,NV, and OOARP,NV are shown as the ratio of mass
concentrations for the AmbHtOH to AmbHt conditions. For OOAP,NV, the difference
be-10
tween AmbHtOH and AmbHt mass concentrations is instead shown because of the sometimes low AmbHt OOAP,NV concentrations, which lead to very high and
scat-tered AmbHtOH/AmbHt ratios. The top panel shows a decrease in BBOA, OOAR,V
and OOAR,NVmass for all OH exposures. OOAR,Vand OOAR,NVare shown to be quite reactive, although there is a great deal of scatter in the measurements. Reaction at this
15
initial stage may depend strongly on details of the particle composition. Similar to the behavior of individual m/z shown in Fig. 6, most of the decrease in OOAR,V (∼75 %
consumed) and OOAR,NV(∼50 % consumed) occurs within∼3 days of photochemical
aging. The reactivity of these factors suggests that ambient SV-OOA, which has a sim-ilar mass spectrum, may also react quite quickly in the atmosphere. Aging-induced
20
reductions in SV-OOA-like species have previously been observed for airmasses in Southwestern Ontario, Canada (Slowik et al., 2011).
Somewhat different behavior is observed for BBOA. While ∼35 % of BBOA is
con-sumed within∼3 days, this value continues to increase, reaching∼60 % or more after ∼6 days of exposure. This indicates that BBOA is not a fully conserved tracer for
25
ACPD
12, 8183–8224, 2012Real-time, controlled OH-initiated oxidation
of biogenic SOA
J. G. Slowik et al.
Title Page
Abstract Introduction
Conclusions References
Tables Figures
◭ ◮
◭ ◮
Back Close
Full Screen / Esc
Printer-friendly Version Interactive Discussion
Discussion
P
a
per
|
Dis
cussion
P
a
per
|
Discussion
P
a
per
|
Discussio
n
P
a
per
|
A further contrast is observed for the OOARP,NV factor. Here an increase in mass on the order of∼20 % is observed during approximately the first 3 day-equivalents of
aging. However, higher exposures yield no net change relative to the unreacted con-centrations. This suggests that OOARP,NVcan be considered an early- or intermediate-stage reaction product, but itself reacts given sufficiently high OH exposures. On the
5
other hand, while OOAP,NV forms rapidly, with most production occurring, within ∼3
days of aging, there is no evidence for its consumption within the range of expo-sures studied, suggesting that the end product of particle-phase oxidation resembles OOAP,NV. As noted previously, OOAP,NV is spectrally similar to AMS LV-OOA
spec-tra. Figure 11 thus supports the current understanding that atmospheric aging pushes
10
aerosols of varying composition towards an LV-OOA-like state (Ng et al., 2010; Jimenez et al., 2009). The figure also indicates that heterogeneous oxidation and/or gas-phase oxidation of organic material partitioning between the particle and gas phase can sig-nificantly affect both primary and secondary aerosol components on atmospherically-relevant timescales.
15
The TPOT PMF analysis discussed above can also provide insight into the compo-sition and volatility/reactivity-based properties of the unreacted ambient aerosol. Fig-ure 12 shows the TPOT PMF representation of particle composition for 19 and 21 July. These days take place during the early and late stages, respectively, of a pe-riod of increasing temperatures, biogenic emissions, and biogenic SOA. On 19 July
20
(lower panel), when the temperature and biogenic emissions are lower (daily maximum temperature∼19◦C), there is lower total organic mass and changes to the
composi-tion during the day are negligible. In contrast, 21 July (maximum temperature∼23◦C)
shows a 50–100 % increase in the total organic mass and changes in composition dur-ing the day. Peak concentrations of organic aerosol, biogenic VOCs, and OH radicals
25
ACPD
12, 8183–8224, 2012Real-time, controlled OH-initiated oxidation
of biogenic SOA
J. G. Slowik et al.
Title Page
Abstract Introduction
Conclusions References
Tables Figures
◭ ◮
◭ ◮
Back Close
Full Screen / Esc
Printer-friendly Version Interactive Discussion
Discussion
P
a
per
|
Dis
cussion
P
a
per
|
Discussion
P
a
per
|
Discussio
n
P
a
per
|
OOAR,V-like compounds may also be produced, but the increased midday tempera-tures could prevent them from significantly partitioning to the particle. A small increase in OOAP,NV during the middle of the day on 21 July is also evident. While highly
oxy-genated, LV-OOA-like factors such as OOARP,NV and OOAP,NV are frequently associ-ated with long-range transport, the evidence presented in Figs. 11 and 12 suggests
5
that they may also form during rapid local production in some cases. This is consistent with rapid formation of highly oxidized SOA observed in polluted airmasses in South-western Ontario, Canada (Slowik et al., 2011).
Coupling the reactivity/volatility-based description of ambient aerosol composition shown in Fig. 12 with the PMF factor reactivity characterization in Fig. 11 enables a
de-10
tailed description of the present aerosol composition. Using such reactivity and volatil-ity coordinates makes for easier comparison to the framework presented by Jimenez et al. (2009) for the aging of organic aerosols. It also enables projection of the future changes in composition during the particle’s atmospheric lifetime (albeit neglecting fu-ture SOA formation from gas-phase precursors due to TPOT SOA yield properties).
15
Accessing such a description requires online manipulation of the aerosol composition by a system such as the TPOT; the information is not directly accessible using conven-tional ambient measurements. This suggests that controlled manipulation of ambient aerosol may be a useful tool for characterizing particle properties and predicting their evolution during the course of atmospheric aging. Such an approach has been applied
20
to laboratory-generated SOA fromα-pinene ozonolysis (at concentrations many times higher than ambient) (George and Abbatt, 2010), yielding reactant- and product-like PMF factors. The mass spectrum of the reactant-like factor is quite similar to OOAR,V, however its volatility is unknown. Interestingly, the product-like factor mass spectra is similar to OOARP,NV rather than OOAP,NV. This is consistent with the trend towards 25
ACPD
12, 8183–8224, 2012Real-time, controlled OH-initiated oxidation
of biogenic SOA
J. G. Slowik et al.
Title Page
Abstract Introduction
Conclusions References
Tables Figures
◭ ◮
◭ ◮
Back Close
Full Screen / Esc
Printer-friendly Version Interactive Discussion
Discussion
P
a
per
|
Dis
cussion
P
a
per
|
Discussion
P
a
per
|
Discussio
n
P
a
per
|
experiments are required to fully elucidate the effects of the initial particle composition on reaction products and pathways.
4 Conclusions
We present the first field deployment of the Toronto Photooxidation Tube (TPOT), a field-deployable flow reactor for the controlled OH oxidation of ambient aerosol. The
5
deployment took place during summer in a forested location strongly influenced by biogenic organic aerosol formation during warm periods. Aerosols were continuously sampled, alternating between three conditions: (1) unreacted ambient aerosol (“Amb”); (2) ambient aerosol subjected to a∼4◦C temperature increase (“AmbHt”); and (3)
am-bient aerosol subjected to both the aforementioned temperature increase and OH
ex-10
posures ranging from approximately 2×10¹⁰ to 2×10¹²molec cm−3s (“AmbHtOH”),
corresponding to up to∼10 days of atmospheric photochemical aging. Particle mass
and composition were monitored with a time-of-flight aerosol mass spectrometer (C-ToF-AMS). Due in large part to the geometry of the TPOT system, significant SOA generation was not observed and the dominant reactive processes were instead
het-15
erogeneous oxidation and/or gas-phase reaction of semivolatile species partitioning from the particle to the gas phase.
Significant aerosol volatilization was observed, with the AmbHt condition causing a reduction in the organic mass on the order of 10 to 25 %, depending on the oxy-genation of the unperturbed aerosol. Reaction with OH caused further decreases in
20
the organic mass on the order of up to an additional 25 %. Similar decreases were observed throughout the mass spectrum, with the exception ofm/z 44 (CO+2 ion) and m/z 45. Changes in the ratio of m/z 30 to 46 with OH exposure indicate both signifi-cant organonitrate content in the unreacted aerosol and that these organonitrates react away with OH.
25
ACPD
12, 8183–8224, 2012Real-time, controlled OH-initiated oxidation
of biogenic SOA
J. G. Slowik et al.
Title Page
Abstract Introduction
Conclusions References
Tables Figures
◭ ◮
◭ ◮
Back Close
Full Screen / Esc
Printer-friendly Version Interactive Discussion
Discussion
P
a
per
|
Dis
cussion
P
a
per
|
Discussion
P
a
per
|
Discussio
n
P
a
per
|
related to reactivity and volatility. This classification of aerosol components is enabled by the TPOT-modulated perturbation of aerosol composition, and is not otherwise ac-cessible. Analysis of the PMF factors and individualm/z both indicate rapid formation of highly oxygenated organic aerosol, likely with a strong contribution from organic acid functional groups. Evidence for early/intermediate-stage OH reaction products is
5
also observed. OH oxidation significantly affects particle composition even for expo-sures corresponding to<1 day of atmospheric aging, and most reaction with biogenic SOA appears complete after∼3 days. The particle-phase reaction end products have
mass spectra similar to the low-volatility oxygenated organic aerosol (LV-OOA) factors widely reported in the literature (e.g., Zhang et al., 2005; Lanz et al., 2007; Jimenez
10
et al., 2009; Ulbrich et al., 2009), thus providing supporting evidence that aged organic aerosol does arise through OH-driven oxidation processes. This general approach of PMF analysis of organic aerosol subject to forced changes in the chemical and/or phys-ical environment (e.g. temperature or relative humidity) could be applied more widely to better determine the nature of organic particulates.
15
Supplementary material related to this article is available online at: http://www.atmos-chem-phys-discuss.net/12/8183/2012/
acpd-12-8183-2012-supplement.pdf.
Acknowledgements. The authors gratefully acknowledge planning and logistical support from Anne Marie Macdonald and Richard Leaitch (Environment Canada). S. Sjostedt (Environment
20
ACPD
12, 8183–8224, 2012Real-time, controlled OH-initiated oxidation
of biogenic SOA
J. G. Slowik et al.
Title Page
Abstract Introduction
Conclusions References
Tables Figures
◭ ◮
◭ ◮
Back Close
Full Screen / Esc
Printer-friendly Version Interactive Discussion
Discussion
P
a
per
|
Dis
cussion
P
a
per
|
Discussion
P
a
per
|
Discussio
n
P
a
per
|
References
Aiken, A. C., DeCarlo, P. F., Kroll, J. H., Worsnop, D. R., Huffman, J. A., Docherty, K. S., Ul-brich, I. M., Mohr, C., Kimmel, J. R., Sueper, D., Sun, Y., Zhang, Q., Trimborn, A., North-way, M., Ziemann, P. J., Canagaratna, M. R., Onasch, T. B., Alfarra, M. R., Pr ´ev ˆot, A. S. H., Dommen, J., Duplissy, J., Metzger, A., Baltensperger, U., and Jimenez, J. L.: O/C and OM/OC
5
ratios of primary, secondary, and ambient organic aerosols with high-resolution time-of-flight mass spectrometry, Environ. Sci. Technol., 42, 4478–4485, 2008.
Allan, J. D., Jimenez, J. L., Williams, P. I., Alfarra, M. R., Bower, K. N., Jayne, J. T., Coe, H., and Worsnop, D. R.: Quantitative sampling using an aerodyne aerosol mass spectrome-ter 1: Techniques of data inspectrome-terpretation and error analysis, J. Geophys. Res., 108, 4090,
10
doi:10.1029/2002JD002358, 2003.
Canagaratna, M. R., Jayne, J. T., Jimenez, J. L., Allan, J. D., Alfarra, M. R., Zhang, Q., Onasch, T. B., Drewnick, F., Coe, H., Middlebrook, A., Delia, A., Williams, L. R., Trim-born, A. M., Northway, M. J., DeCarlo, P. F., Kolb, C. E., Davidovits, P., and Worsnop, D. R.: Chemical and microphysical characterization of ambient aerosols with the aerodyne aerosol
15
mass spectrometer, Mass Spectrom. Rev., 26, 185–222, 2007.
Capes, G., Johnson, B., McFiggans, G., Williams, P. I., Haywood, J., and Coe, H.: Aging of biomass burning aerosols over West Africa: Aircraft measurements of chemical com-position, microphysical properties, and emission ratios, J. Geophys. Res., 113, D00C15, doi:10.1029/2008JD009845, 2008.
20
Chirico, R., DeCarlo, P. F., Heringa, M. F., Tritscher, T., Richter, R., Pr ´ev ˆot, A. S. H., Dom-men, J., Weingartner, E., Wehrle, G., Gysel, M., Laborde, M., and Baltensperger, U.: Impact of aftertreatment devices on primary emissions and secondary organic aerosol formation po-tential from in-use diesel vehicles: results from smog chamber experiments, Atmos. Chem. Phys., 10, 11545–11563, doi:10.5194/acp-10-11545-2010, 2010.
25
Chow, J. C., Watson, J. G., Lowenthal, D. H., Chen, L. W. A., Zielinska, B., Mazzoleni, L. R., and Magliano, K. L.: Evaluation of organic markers for chemical mass balance source ap-portionment at the Fresno Supersite, Atmos. Chem. Phys., 7, 1741–1754, doi:10.5194/acp-7-1741-2007, 2007.
Christensen, W. F., Schauer, J. J., and Lingwall, J. W.: Iterated confirmatory factor analysis for
30
ACPD
12, 8183–8224, 2012Real-time, controlled OH-initiated oxidation
of biogenic SOA
J. G. Slowik et al.
Title Page
Abstract Introduction
Conclusions References
Tables Figures
◭ ◮
◭ ◮
Back Close
Full Screen / Esc
Printer-friendly Version Interactive Discussion
Discussion
P
a
per
|
Dis
cussion
P
a
per
|
Discussion
P
a
per
|
Discussio
n
P
a
per
|
Cubison, M. J., Ortega, A. M., Hayes, P. L., Farmer, D. K., Day, D., Lechner, M. J., Brune, W. H., Apel, E., Diskin, G. S., Fisher, J. A., Fuelberg, H. E., Hecobian, A., Knapp, D. J., Mikoviny, T., Riemer, D., Sachse, G. W., Sessions, W., Weber, R. J., Weinheimer, A. J., Wisthaler, A., and Jimenez, J. L.: Effects of aging on organic aerosol from open biomass burning smoke in aircraft and laboratory studies, Atmos. Chem. Phys., 11, 12049–12064,
doi:10.5194/acp-11-5
12049-2011, 2011.
Drewnick, F., Hings, S. S., DeCarlo, P. F., Jayne, J. T., Gonin, M., Fuhrer, K., Weimer, S., Jimenez, J. L., Demerjia, K. L., Borrman, S., and Worsnop, D. R.: A new time-of-flight aerosol mass spectrometer (ToF-AMS) – instrument description and first field deployment, Aerosol Sci. Technol., 39, 637–658, 2005.
10
Duplissy, J., DeCarlo, P. F., Dommen, J., Alfarra, M. R., Metzger, A., Barmpadimos, I., Pr ´ev ˆot, A. S. H., Weingartner, E., Tritscher, T., Gysel, M., Aiken, A. C., Jimenez, J. L., Cana-garatna, M. R., Worsnop, D. R., Collins, D. R., Tomlinson, J., and Baltensperger, U.: Relating hygroscopicity and composition of organic aerosol particulate matter, Atmos. Chem. Phys., 11, 1155–1165, doi:10.5194/acp-11-1155-2011, 2011.
15
Farmer, D. K., Matsunaga, A., Docherty, K. S., Surratt, J. D., Seinfeld, J. H., Ziemann, P. J., and Jimenez, J. L.: Response of an aerosol mass spectrometer to organonitrates and organosul-fates and implications for atmospheric chemistry, Proc. Natl. Acad. Sci., 107, 6670–6675, 2010.
George, I. J., Vlasenko, A., Slowik, J. G., Broekhuizen, K., and Abbatt, J. P. D.:
Hetero-20
geneous oxidation of saturated organic aerosols by hydroxyl radicals: uptake kinetics, condensed-phase products, and particle size change, Atmos. Chem. Phys., 7, 4187–4201, doi:10.5194/acp-7-4187-2007, 2007.
George, I. J., Slowik, J., and Abbatt, J. P. D.: Chemical aging of ambient organic aerosol from heterogeneous reaction with hydroxyl radicals, Geophys. Res. Lett., 35, L13811,
25
doi:10.1029/2008GL033884, 2008.
de Gouw, J. and Jimenez, J. L.: Organic aerosols in the Earth’s atmosphere, Environ. Sci. Technol., 43, 7614–7618, 2009.
Grieshop, A. P., Logue, J. M., Donahue, N. M., and Robinson, A. L.: Laboratory investigation of photochemical oxidation of organic aerosol from wood fires 1: measurement and simulation
30
ACPD
12, 8183–8224, 2012Real-time, controlled OH-initiated oxidation
of biogenic SOA
J. G. Slowik et al.
Title Page
Abstract Introduction
Conclusions References
Tables Figures
◭ ◮
◭ ◮
Back Close
Full Screen / Esc
Printer-friendly Version Interactive Discussion
Discussion
P
a
per
|
Dis
cussion
P
a
per
|
Discussion
P
a
per
|
Discussio
n
P
a
per
|
Hallquist, M., Wenger, J. C., Baltensperger, U., Rudich, Y., Simpson, D., Claeys, M., Dom-men, J., Donahue, N. M., George, C., Goldstein, A. H., Hamilton, J. F., Herrmann, H., Hoff -mann, T., Iinuma, Y., Jang, M., Jenkin, M. E., Jimenez, J. L., Kiendler-Scharr, A., Maen-haut, W., McFiggans, G., Mentel, Th. F., Monod, A., Pr ´ev ˆot, A. S. H., Seinfeld, J. H., Sur-ratt, J. D., Szmigielski, R., and Wildt, J.: The formation, properties and impact of
sec-5
ondary organic aerosol: current and emerging issues, Atmos. Chem. Phys., 9, 5155–5236, doi:10.5194/acp-9-5155-2009, 2009.
Hannigan, M. P., Busby Jr., W. F., and Cass, G. R.: Source contributions to the mutagenicity of urban particulate air pollution, J. Air Waste Manage. Assoc., 55, 399–410, 2005.
Heald, C. L., Kroll, J. H., Jimenez, J. L., Docherty, K. S., DeCarlo, P. F., Aiken, A. C.,
10
Chen, Q., Martin, S. T., Farmer, D. K., and Artaxo, P.: A simplified description of the evo-lution of organic aerosol composition in the atmosphere, Geophys. Res. Lett., 37, L08803, doi:10.1029/2010GL042737, 2010.
Hidy, G. M. and Friedlander, S. K.: The Nature of the Los Angeles Aerosol, Proc. 2nd Int. Clean Air Congress, edited by: Englund, H. M. and Beery, W. T., Academic Press, New York, USA,
15
391–404, 1971.
Huffman, J. A., Docherty, K. S., Mohr, C., Cubison, M. J., Ulbrich, I. M., Zie-mann, P. J., Onasch, T. B., and Jimenez, J. L.: Chemically-resolved volatility measure-ments of organic aerosol from different sources, Environ. Sci. Technol., 43, 5351–5357, doi:10.1021/es803539d, 2009.
20
Jimenez, J. L., Canagaratna, M. R., Donahue, N. M., Pr ´ev ˆot, A. S. H., Zhang, Q., Kroll, J. H., DeCarlo, P. F., Allan, J. D., Coe, H., Ng., N. L., Aiken, A. C., Docherty, K. D., Ulbrich, I. M., Grieshop, A. P., Robinson, A. L., Duplissy, J., Smith, J. D., Wilson, K. R., Lanz, V. A., Hueglin, C., Sun, Y. L., Tian, J., Laaksonen, A., Raatikainen, T., Rautiainen, J., Vaatto-vaara, P., Ehn, M., Kulmala, M., Tomlinson, J. M., Collins, D. R., Cubison, M. J., Dunlea, E. J.,
25
Huffman, J. A., Onasch, T. B., Alfarra, M. R., Williams, P. I., Bower, K., Kondo, Y., Schnei-der, J., Drewnick, F., Borrmann, S., Weimer, S., Demerjian, K., Salcedo, D., Cottrell, L., Grif-fin, R., Takami, A., Miyoshi, T., Hatakeyama, S., Shimono, A., Sun, J. Y., Zhang, Y. M., Dzepina, K., Kimmel, J. R., Sueper, D., Jayne, J. T., Herndon, S. C., Trimborn, A. M., Williams, L. R., Wood, E. C., Kolb, C. E., Middlebrook, A. M., Baltensperger, U., and
30