www.ann-geophys.net/26/2345/2008/ © European Geosciences Union 2008
Annales
Geophysicae
Imaging observations of nighttime mid-latitude F-region
field-aligned irregularities by an MU radar ultra-multi-channel
system
S. Saito1,*, M. Yamamoto2, and H. Hashiguchi2
1National Institute of Information and Communications Technology, Nukui-kita 4-2-1, Koganei, Tokyo 184-8795, Japan 2Research Institute for Sustainable Humanosphere, Kyoto University, Gokasho, Uji, Kyoto 611-0011, Japan
*now at: Electronic Navigation Research Institute, Jindaiji-higashi 7-42-23, Chofu, Tokyo 182-0012, Japan Received: 7 November 2007 – Revised: 8 April 2008 – Accepted: 29 April 2008 – Published: 5 August 2008
Abstract. Mid-latitude F-region field-aligned irregularities
(FAIs) were studied by using the middle-and-upper atmo-sphere (MU) radar ultra-multi-channel system with the radar imaging technique. On 12 June 2006, F-region FAI echoes with a period of about one hour were observed intermit-tently. These echoes were found to be embedded in medium-scale traveling ionospheric disturbances (MSTIDs) observed as variations of total electron content (TEC). The echoes drifting away from (toward) the radar were observed in the depletion (enhancement) phase of the MSTID. The Doppler velocity of the echoes is consistent with the range rates in the the range-time-intensity (RTI) maps. Fine scale structures with a spatial scale of 10 km or less were found by the radar imaging analysis. Those structures with positive Doppler ve-locities (moving away from the radar) appeared to drift north-(up-) westward, and those with negative Doppler velocities south- (down-) eastward approximately along the wavefronts of the MSTID. FAIs with positive Doppler velocities filling TEC depletion regions were observed.
Keywords. Ionosphere (Ionospheric irregularities; Mid-latitude ionosphere; Plasma waves and instabilities)
1 Introduction
In the mid-latitude ionosphere, several kinds of plasma ir-regularities are known to exist in both the E- and F-regions. Nighttime F-region 3-m-scale field-aligned plasma irregular-ities (FAIs) associated with the mid-latitude spread-F were first reported by Fukao et al. (1988). Compared with those in the E-region, such as quasi-periodic (QP) echoes
associ-Correspondence to: S. Saito
ated with the sporadic-E (Es) layer (Yamamoto et al., 1991),
they have not been studied well. Only a few studies in Japan (Fukao et al., 1988, 1991; Saito et al., 1998, 2002) and in Puerto Rico (Swartz et al., 2000) using radars have reported the mid-latitude F-region FAIs. This is partly because the echoes associated with the mid-latitude F-region FAIs are relatively weak and a powerful radar is required to observe them.
Several characteristics have been revealed by the studies sited above. Nighttime mid-latitude F-region FAIs associ-ated with medium-scale traveling ionospheric disturbances (MSTIDs) with typical wavelengths of 100–500 km have been observed (Saito et al., 1998, 2002). However, F-region FAIs are less frequently observed than MSTIDs. Accord-ingly, the mechanism of generating 3-m-scale FAIs in the F-region has not been understood well.
Perkins (1973) has proposed that the ionosphere can be un-stable and the wave structure excited by the instability, called the Perkins instability, preferentially propagates southwest-ward or northeastsouthwest-ward (see also Zhou and Mathews, 2006). Nighttime mid-latitude MSTIDs are often explained by the Perkins instability. However, it is also known that the lin-ear growth rate of the instability is too small to explain the MSTID phenomenon. The Perkins instability cannot explain how 3-m-scale FAIs are generated, because they are sup-posed to be secondary waves generated after non-linear evo-lution of primary waves.
Kelley et al. (1991) proposed that interchange-type insta-bility could be excited by the electron density gradient asso-ciated with MSTIDs and the neutral wind. In this case, a cer-tain slope of MSTIDs with∇ne·u<0, whereneand u are the
A
B
C
D E
F
A1
A2
B3 F1
E2 E1
D2 C1
C3 E3
F3
D4 F2
E4 F4
F5
B4
D3
C4
D1
C2 B2 A4
B1 A3
CH1
CH2
CH3
CH4
CH5
CH7 CH6
CH8
CH9 CH10
CH15
CH12 CH16
CH13 CH14
CH25
CH11 CH17
CH18 CH20 CH19
CH22 CH23
CH24 CH21
Fig. 1. Layout of the MU radar antenna sub-arrays. The 19 shaded sub-arrays were used to take data independently for imaging analy-sis. All 25 sub-arrays were used for transmission.
al., 1985a, b) multi-beam experiment, Saito et al. (2002) re-ported that echoes tend to appear at the northern slope of MSTIDs. However, it was difficult to see the precise rela-tionship between the MSTIDs and FAIs, nor fine scale struc-tures of FAIs, as their observations were conducted without interferometry.
Zhou et al. (2005) showed by numerical simulation that the non-linear Perkins instability would have a larger growth rate and may generate 10-km-scale irregularities. They also showed that the interchange-type instability can generate small-scale irregularities.
The radar imaging technique is now widely used for study-ing fine structures of ionospheric irregularities from equa-torial to high latitudes (Hysell, 1996; Hysell and Burcham, 2000; Hysell and Chau, 2002; Hysell et al., 2002, 2004; Bah-civan et al., 2005; Saito et al., 2006, 2007). With this tech-nique, structures smaller than the radar beam width can be resolved. Using the MU radar ultra-multi-channel system, we conducted multi-beam radar-imaging experiment to study the structures of mid-latitude F-region FAIs in detail.
2 Experiment
All 25 antenna sub-arrays of the MU radar ultra-multi-channel system were used for transmission, and 19 sub-arrays with a regular hexagonal shape recorded returned sig-nals independently (Fig. 1). The observations were
con-Geographic longitude
133 134 135 136 137 138 139
34
35
36
37
38
39
40
41
Beam 1
Beam 2 Beam 3
MUR
700 km
500 km
300 km
Range
Geographic latitude
Fig. 2. Geometry of the observation. Three thick lines show the center of the radar beam with crosses marked at every 100 km range.
ducted from 20:00 to 04:00 JST (UT+9 h) on 12–15 June and 11–13 July 2006. E- and F-regions were observed al-ternately. Parameters of the MU radar observations of the F-region are summarized in Table 1. Figure 2 shows the ge-ometry of the experiment. The beams used for the observa-tions were named beams 1, 2, and 3 from west to east, respec-tively. Due to the high aspect angle sensitivity of FAI echoes, echoes can be observed only when the radar k-vector is per-pendicular to the geomagnetic field line. The perper-pendicular- perpendicular-ity condition in the−3 dB beam width (4.5◦) was achieved
Table 1. Parameters of the MU radar observations.
Number of beams 3
Beam direction (Azimuth, Zenith) (−10.43◦, 57.19◦), (0.00◦, 57.84◦), (10.43◦, 57.19◦) Sensitive altitude range 208–336 km, 224–347 km, 161–295 km
Pulse code 11-bit Barker code
Sub-pulse length 32µs (4.8 km)
Inter pulse period 8 ms
Doppler velocity bandwidth ±201 m s−1 Number of incoherent integration 5
Peak power 1 MW
-10 -5 0 5 10
East-west distance (/wavelength) 0
2 4 6 8 10 12
North-south distance (/wavelength)
3.05 wavelength
Fig. 3. Non-redundant baselines achieved by the 19 antenna sub-arrays and used for imaging analysis.
3 Imaging analysis
The analysis procedures of radar echoes are basically the same as used for the E-region measurements by Saito et al. (2006). Complex Doppler spectra were calculated by fast Fourier transform (FFT). The two-dimensional visibil-ity function was estimated for 30 non-redundant baselines achieved by the 19 antenna sub-arrays (Fig. 3). The co-herence functions were divided into four segments in the Doppler velocity domain. Images of echoes were recon-structed by the maximum entropy method (Hysell, 1996) for three of the four segments of Doppler velocities, toward the radar (−151 to−50 m s−1), around zero (−50 to+50 m s−1), and away (+50 to+151 m s−1) from the radar. The fastest segment (−151 to −201 m s−1 and+151 to +201 m s−1), which had more chance to be frequency aliased than the other segments, was not used, because the F-region echo spectra are broad with relatively small Doppler shifts that are lower than the ion acoustic velocity (about 300 to 400 m s−1). In the present study, the positive and negative Doppler veloci-ties refer to the motion away from and toward the radar, re-spectively.
700
500
300
Range (km)
700
500
300
Range (km)
700
500
300
JST 00:00
20:00 22:00 02:00
JST 00:00
20:00 22:00 02:00
JST 00:00
20:00 22:00 02:00
0 8 32
24
16
0 8 32
24
16
0 8 32
24
16
A B C D
A B C D
A B C D
SNR (dB)
SNR (dB)
SNR (dB)
MUR 12/08/2006 (−10.43, 57.19)
MUR 12/08/2006 (10.43, 57.19) MUR 12/08/2006 ( 0.00, 57.84) Beam 1
Beam 2
Range (km)
Beam 3
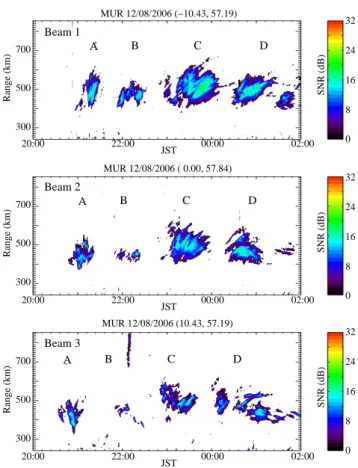
Fig. 4. Echo power observed on 12 June 2006 in the RTI format (JST=UT+9 h). Upper, middle, and lower panel show the data from beams 1, 2, and 3, respectively.
4 Results
700
500
300
Range (km)
700
500
300
Range (km)
700
500
300
JST 00:00
20:00 22:00 02:00
JST 00:00
20:00 22:00 02:00
JST 00:00
20:00 22:00 02:00
A B C D
A B C D
A B C D
0
−100
−200 100 200
0
−100
−200 100 200
0
−100
−200 100 200 MUR 12/08/2006 (−10.43, 57.19)
MUR 12/08/2006 (10.43, 57.19) MUR 12/08/2006 ( 0.00, 57.84) Beam 1
Beam 2
Beam 3
Doppler Velocity (m/s)
Doppler Velocity (m/s)
Range (km)
Doppler Velocity (m/s)
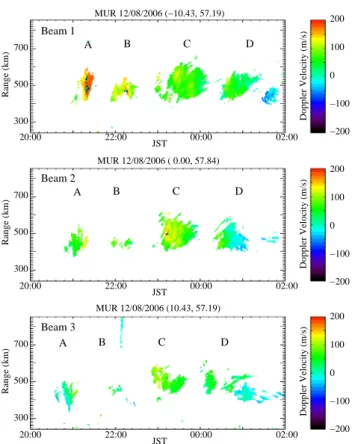
Fig. 5. Same as Fig. 4, except the Doppler velocity is shown.
echo pattern increased with time. Echo cluster A in beam 3 and echo cluster D in all beams have both positive and neg-ative range rates. The first half of echo cluster D has posi-tive range rates, and the latter half of the echoes has negaposi-tive range rates.
Figure 5 shows the Doppler velocities observed by the three beams over the same period. Doppler velocities of echoes with SNR larger than 0 dB are plotted. The Doppler velocities were mostly positive, and about 50 to 150 m s−1. However, some echoes have negative Doppler velocities of about−50 m s−1. There are several echoes with very high negative Doppler velocities as fast as−200 m s−1in the echo clusters A and B in beam 1 and in the echo cluster C in beam 2. However, spectral analysis of these echoes shows that they are most likely due to frequency aliasing by very fast, positive Doppler velocity exceeding the Nyquist limit (202 m s−1). Echoes with positive range rates have positive Doppler velocities (moving away from the radar) and those with negative range rates had negative ones (moving toward the radar). The observed Doppler velocities were consis-tent with the range rates, as reported in previous works (e.g. Fukao et al., 1991).
Figure 6 shows an example of a sequence of radar images, when a strong echo cluster (marked as C in Fig. 4) was ob-served. Images for each one of the Doppler velocity seg-ments (−150 to−50 m s−1,−50 to+50 m s−1, and+50 to
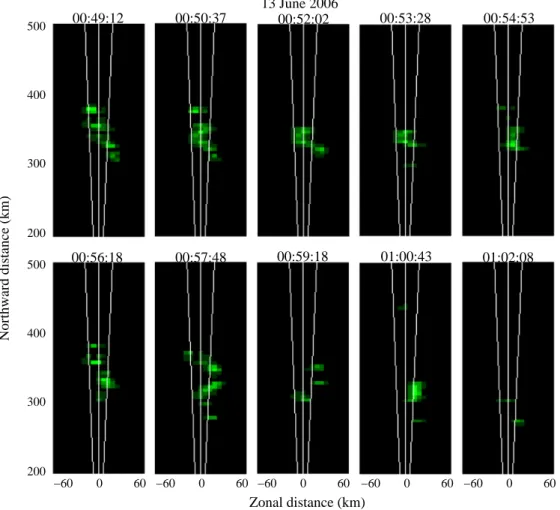
+150 m s−1) were merged by assigning weights proportional to echo power and image intensity. The colors blue, green, or red, was assigned to each Doppler velocity segment: toward, zero, or away, respectively. Each color represents a range from 0 to 3 dB with six color steps to show weak echoes more clearly. The images were projected on a horizontal plane at an altitude of 300 km. Echo cluster C contains a few echoes with Doppler velocities higher than 150 m s−1. These echo spectra are broad, and a significant amount of echo power in the spectral ranges that were used for imaging analysis (−150 to +150 m s−1). Thus, the images of such echoes with very high Doppler velocities were also successfully re-constructed. The images shown in Fig. 6 are dominated by a red color, indicating that the Doppler velocity was higher than 50 m s−1. The Doppler echoing regions consists of sub-structures with scale sizes less than 10 km. As indicated by white circles in each panel, these substructures appeared to drift north- (up-) westward. This is consistent with Swartz et al. (2000)’s finding of 1 to 100 km scale layering in the mid-latitude F-region irregularities. After 00:40 JST on 13 June 2006, echoes with negative range rates were observed in beam 2 in the latter half of the echo cluster D in Fig. 4. Figure 7 shows a sequence of radar images of the echoes from the latter half of the cluster D in beam 2. All echoes in this echo cluster had Doppler velocities between−150 and +150 m s−1. The images were dominated by a green color, indicating that the Doppler velocity was mostly negative (to-ward) and slower than−50 m s−1. Echoing regions also con-sist of patches with scale sizes less than 10 km. These echo-ing regions appeared to drift south (down) eastward. Similar images were also observed in the echo clusters A and B.
300 400
200 500
0 60
−60 −60 0 60 −60 0 60 −60 0 60
23:13:48 23:15:16 23:16:45 23:18:17
12 June 2006
Northward distance (km)
Zonal distance (km)
Fig. 6. Sequential images of echoes from beam 2 cluster C from 23:13:48 to 23:18:17 JST on 12 June 2006. The images are projected on a horizontal plane at an altitude of 300 km along the geomagnetic field line. White circles in the rightmost panel show the approximate positions of echo patches in these four images as also indicated by circles in other panels. The dashed line in the rightmost panel indicates the wavefront direction of the MSTID (at an arbitrary phase).
400
200 500 300 400
200
500 00:49:12 00:50:37 00:52:02 00:53:28 00:54:53
00:56:18 00:57:48 00:59:18 01:00:43 01:02:08
0 60
−60 −60 0 60 −60 0 60 −60 0 60 −60 0 60
Northward distance (km)
Zonal distance (km)
300
13 June 2006
35 40
37 38 41
39
140
139
138
136 137
135
134
0.0
−0.5
−1.0 0.5 1.0
22:00 00:00 02:00
20:00
GPS−TEC Fluctuation 12/06/2006
Longitude
dTEC (TECU)
Latitude
JST 36
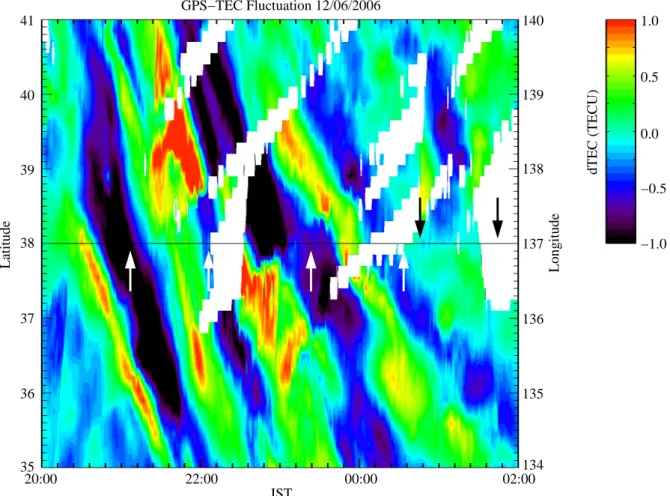
Fig. 8. TEC perturbation along the line from (35◦N, 134◦E) to (41◦N, 140◦E) (dashed line in Fig. 2 approximately perpendicular to the
MSTID wavefront). Up and down arrows indicate the times when FAIs with positive and negative range rates, respectively, appeared in beam 2.
and moved southwestward as a whole clearly together with the MSTID.
5 Discussion and summary
Our observations by the MU radar ultra-multi-channel sys-tem show that substructures (∼10 km-scale) of FAI echoes drifted approximately along the MSTID wave front, while echoing regions as a whole drifted southwestward together with the MSTID. These 10-km-scale FAI substructures could be related to the kilometer-scale layered structure reported by Mathews et al. (2001). The drift of these echo patches may be explained by the electric field associated with the MSTID. Figure 10 illustrates the motion of the irregularity patches and its relation to the MSTID. At night in the Northern Hemi-sphere, the neutral wind velocity in the F-region is generally southeastward. The wind, U, generates the Pedersen cur-rent,J=σPU×B, whereσP is the Pedersen conductivity, as
shown in Fig. 10. According to Saito et al. (2002), in the TEC depletion region (dNe<0), the polarization electric field,Ep,
would be northeastward and lift up the ionosphere. On the other hand, in the TEC enhancement region (dNe>0), the
po-larization electric field,Ep, would be southwestward. By the
Ep associated with the MSTID and the geomagnetic field,
dTEC (TECU)
137 135 136 137
36 37 38 39 40
23:15:00
23:29:00
12 June 2006
23:39:30
23:50:00
Geographic longitude
Geographic latitude
135 136 137 135 136 137 135 136
Fig. 9. Sequential images of echoes from beam 1, 2, and 3 together with TEC perturbation observed from 23:15 to 23:50 JST on 12 July 2006. The images are projected on a horizontal plane at an altitude of 300 km along the geomagnetic field line. Dashed lines in the images show the center of the radar beams.
June 2006 due to maintenance. In our future studies, simul-taneous observations of FAI images and the neutral wind are planned.
Recently, Saito et al. (2007) reported that MSTIDs are closely related to quasi-periodic (QP) echoes in the E-region as evidence of the E- and F-region coupling. They have also pointed out different scale sizes in the E- and F-regions: 100 to 500 km for MSTIDs and several kilometers for QP echoes. Existing theories regarding E- and F-region coupling, which assume the same scale sizes in both regions, would have dif-ficulty in explaining the difference in scale sizes. In this ex-periment, we found smaller scale (∼10 km) structures in the F-region FAIs associated with MSTIDs. In fact, on 12 June 2006, E-region echoes, that could be classified as QP echoes, were observed. Although MSTIDs do not always accompany FAIs, our results show possibility that small-scale structures exists in the F-region with a scale size comparable to that of the E-region.
We showed that the FAIs were found filling the TEC deple-tion region. Using an MU radar multi-beam experiment with-out interferometry, Saito et al. (2002) reported that echoes tend to appear at the northern slope of MSTIDs. However, our experiment with better spatial resolution showed that these echoes with positive range rate were distributed over the TEC depletion region of the MSTID irrespective of TEC gradients. This situation is quite similar to the case of plasma bubbles. The western wall of a plasma bubble is more unsta-ble with the interchange instability due to the eastward ther-mospheric neutral wind. However, 3-m-scale FAIs fill entire
MSTID
B North
East
B U x σp J =
U
Ep Ep FAI region
dNe > 0 dNe < 0
dNe > 0 dNe < 0
E x B
Epx B p
FAI patches
Fig. 10. Schematic illustration of motion of FAI patches with
MSTIDs.
observations can distinguish whether they are generated there or generated far away and drifted into the radar field-of-view. Unfortunately, no FAIs that were observed in our experiment were generated in the radar field-of-view. Even the echo clus-ter D, which may look generated in the radar field-of-view if we look at the RTI map of only one beam, was in fact gen-erated outside the radar field-of-view. It is necessary to con-duct more experiments of this kind to enhance the chance to encounter “fresh” F-region FAIs.
Acknowledgements. The MU radar belongs to and is operated by the Research Institute for Sustainable Humanosphere (RISH) of Ky-oto University. The GEONET GPS receiver network is operated by Geographical Survey Institute (GSI), Japan. TEC data are provided by Kyoto University.
Topical Editor U.-P. Hoppe thanks J. D. Mathews and another anonymous referee for their help in evaluating this paper.
References
Bahcivan, H., Hysell, D. L., Larsen, M. F., and Pfaff, R. F: The 30 MHz imaging radar observations of auroral irregularities during the JOULE campaign, J. Geophys. Res., 110, A05307, doi:10.1029/2004JA010975, 2005.
Fukao, S., Sato, T., Tsuda, T., Kato, S., Wakasugi, K., and Maki-hara, T.: The MU radar with an active phased array system 1. An-tenna and power amplifiers, Radio Sci., 20, 1155–1168, 1985a. Fukao, S., Tsuda, T., Sato, T., Kato, S., Wakasugi, K., and
Mak-ihara, T.: The MU radar with an active phased array system 1. In-house equipment, Radio Sci., 20, 1169–1176, 1985b. Fukao, S., McClure, J. P., Ito, A., Sato, T., Kimura, I., Tsuda, T.,
and Kato, S.: First VHF radar observation of midlatitude F-region field-aligned irregularities, Geophys. Res. Lett., 8, 768– 771, 1988.
Fukao, S., Kelley, M. C., Shirakawa, T., Takami, T., Yamamoto, Y., Tsuda, T., and Kato, S.: Turbulent upwelling of the mid-latitude ionosphere 1., Observational results by the MU radar, J. Geo-phys. Res., 96, 3725–3746, 1991.
Hysell, D. L.: Radar imaging of equatorial F region irregularities with maximum entropy interferometry, Radio Sci., 31, 1567– 1578, 1996.
Hysell, D. L. and Burcham, J. D.: The 30-MHz radar interferometer studies of midlatitude E region irregularities, J. Geophys. Res., 105, 12 797–12 812, 2000.
Hysell, D. L. and Chau, J. L.: Imaging radar observations and non-local theory of large-scale plasma waves in the equatorial elec-trojet, Ann. Geophys., 20, 1167–1179, 2002,
http://www.ann-geophys.net/20/1167/2002/.
Hysell, D. L., Yamamoto, M., and Fukao, S.: Imaging radar obser-vations and theory of type I and type II quasi-periodic echoes, J. Geophys. Res., 107(A11), 1360, doi:10.1029/2002JA009292, 2002.
Hysell, D. L., Larsen, M. F., and Zhou, Q. H.: Common volume coherent and incoherent scatter observations of mid-latitude spo-radic E-layers and QP echoes, Ann. Geophys., 22, 3277–3290, 2004, http://www.ann-geophys.net/22/3277/2004/.
Kelley, M. C., S. Fukao, S., Tsuda, T., and Kato, S.: Turbulent upwelling of the mid-latitude ionosphere 2., Theoretical frame-work, J. Geophys. Res., 96, 3747–3753, 1991.
Mathews, J. D., Gonz´alez, S., Sulzer, M. P., Zhou, Q. H., Urbina, J., Kudeki, E., and Franke, S.: Kilometer-scale layered structures inside spread-F, Geophys. Res. Lett., 28, 4167–4170, 2001. Otsuka, Y., Shiokawa, K., Ogawa, T., Yokoyama, T., Yamamoto,
M., and Fukao, S.: Spatial relationship of equatorial plasma bub-bles and field-aligned irregularities observed with an all-sky air-glow imager and the Equatorial Atmosphere Radar, Goephys. Res. Lett., 24, L20802, doi:10.1029/2004GL020869, 2004. Otsuka, Y., Onoma, F., Shiokawa, K., Ogawa, T., Yamamoto,
M., and Fukao, S.: Simultaneous observations of nighttime medium-scale traveling ionospheric disturbances and E-region field-aligned irregularities at midlatitude, J. Geophys. Res., 112, A06317, doi:10.1029/2005JA011548, 2007.
Perkins, F.: Spread F and ionospheric currents, J. Geophys. Res., 78, 218–226, 1973.
Saito, A., Fukao, S., and Miyazaki, S.: High resolution mapping of TEC perturbations with the GSI GPS network over Japan, Geo-phys. Res. Lett., 25, 3079–3082, 1998.
Saito, A., Nishimura, M., Yamamoto, M., Fukao, S., Tsugawa, T., Otsuka, Y., Miyazaki, S., and Kelley, M. C.: Observations of traveling ionospheric disturbances and 3-m scale irregularities in the nighttime F-region ionosphere with the MU radar and a GPS network, Earth Planets Space, 54, 31–44, 2002.
Saito, S., Yamamoto, M., Hashiguchi, H., and Maegawa, A.:, Observation of three-dimensional structures of quasi-periodic echoes associated with mid-latitude sporadic-E layers by MU radar ultra-multi-channel system, Geophys. Res. Lett., 33, L14109, doi:10.1029/2005GL025526, 2006.
Saito, S., Yamamoto, M., Hashiguchi, H., and Maegawa, A.:, Ob-servational evidence of coupling between quasi-periodic echoes and medium scale traveling ionospheric disturbances, Ann. Geo-phys., 25, 2185–2194, 2007,
http://www.ann-geophys.net/25/2185/2007/.
Shiokawa, K., Otsuka, Y., Ihara, C., Ogawa, T., and Rich, F. J.: Ground and satellite observations of nighttime medium-scale traveling ionospheric disturbance at midlatitude, J. Geophys. Res., 108, SIA 3-1, doi:10.1029/2002JA009639, 2003.
Swartz, W. E., Kelley, M. C., Makela, J. J., Collins, S. C., Kudeki, E., Franke, E. S., Urbina, J., Aponte, N., Sulzer, M. P., and Gonz´alez, S. A.: Coherent and incoherent scatter radar observa-tions during intense mid-latitude spread F, Geophys. Res. Lett., 27, 2829–2832, 2000.
Yamamoto, M., Fukao, S., Woodman, R. F., Ogawa, T., Tsuda, T., and Kato, S.: Mid-latitude E-region field-aligned irregular-ities observed with the MU radar, J. Geophys. Res., 96, 15 943– 15 949, 1991.
Zhou, Q., Mathews, J. D., Du, Q., and Miller, C. A.: A prelimi-nary investigation of the pseudo-spectral method numerical solu-tion of the Perkins instability equasolu-tions in the homogeneous TEC case, J. Atmos. Solar-Terr. Phys., 67, 325–335, 2005.
Zhou, Q. and Mathews, J. D.: On the physical explanation of the Perkins instability, J. Geophys. Res., 111, A12309, doi:10.1029/2006JA011696, 2006.