Imaging Method: An Efficient Algorithm for
Moving Target Tracking by UWB Radar
Dusan Kocur, Jan Gamec, Maria Švecová, Maria Gamcová,
Jana Rov
ň
áková
Dept. of Electronics and Multimadia Communications Technical University of Košice
Park Komenského 13, 041 20 Košice, Slovak Republic
[email protected], [email protected], [email protected], [email protected], [email protected]
Abstract: This paper presents the imaging method applied for moving target tracking by a multistatic ultra-wideband radar system. The imaging method consists of such signal processing phases as raw radar data pre-processing, background subtraction, the fusion of the data obtained by the particular receiving channels of a radar, detection, localization and the tracking itself. In this paper, the particular phases of the imaging method are described. Firstly, the theoretical base of the particular phases is denoted and then an overview of the signal processing methods which can be applied within corresponding phase is given. Here, we will also outline that a signal cross-talk, exponential averaging, 2D double-stage ( , )N k detector, a target gravity center estimation and a low-complex nonlinear two-stage tracking filter can be used within the mentioned radar signal processing phases as convenient signal processing methods. The good performance of the imaging method presented in this contribution is illustrated by processing signals obtained by the ultra-wideband radar for a scenario represented by through wall tracking of a single moving target.
1 Introduction
radar). Example waveforms of that kind include impulse (video pulse), coded impulse trains (e.g. M-sequence), stepped frequency, pulse compression, random noise, and other signal formats that have high effective bandwidths [22]. UWB technology in radar allows for a very high accuracy ranging, rigidity to multi-path propagation and external EMI [28]. With regard to these properties, UWB radars have become very popular for military, rescue, automotive, and medical applications as well as for material characterization in recent years.
For the purpose of moving target detection and tracking, several UWB radars have been developed with promising results for through wall tracking of moving people during security operations, for through wall imaging during fire, for through rubble localization of trapped people following an emergency (e.g. an earthquake or explosion) and for through snow detection of trapped people after an avalanche. For these applications, UWB radar sensor networks operating in monostatic, bistatic, and multistatic modes can be used. Monostatic radars are systems in which the transmitter and receiver are collocated. In contrast, in the case of bistatic radars, the transmitter and receiver are not collocated. In multistatic radars a single transmitter is monitored by multiple, dispersed receivers [26].
UWB radar sensor output, referred to as raw radar data (signals), can be interpreted as a set of impulse responses from the surroundings, through which the electromagnetic waves emitted by the transmitting antenna of the radar were propagated. Then, the issue of moving target tracking by a multistatic radar system is comprised of the estimation of a target trajectory based on the processing of raw radar data obtained from all receiving antennas included in the UWB radar sensor network.
There are two basic approaches to raw radar signal processing which can be applied for that purpose. The former approach was originally introduced in [17] for through wall tracking of a moving target by using an M-sequence UWB radar equipped with one transmitting and two receiving antennas. Here, target coordinates as the function of time are evaluated by using an estimation of time of arrival corresponding to a target to be tracked and electromagnetic wave propagation velocity along the line transmitting antenna-target-receiving antenna.
In this paper, the imaging method for moving target tracking by multistatic UWB radar systems will be described. In the next section, a real through wall scenario of single target tracking will be presented. As the radar device considered for the scenario, the M-sequences UWB radar equipped with one transmitting and two receiving antennas will be used [1], [18]. Section 3 is the core of our contribution. In this Section, the particular phases of imaging method will be introduced. In order to provide a brief but comprehensive characterization of the particular phases, the significance of the particular phases will be introduced firstly and then a review of signal processing methods frequently used for the phase task solution will be presented. The outputs of each phase of the imaging method will also be illustrated by the results of signal processing obtained in the scenario described in Section 2. Conclusions will be drawn and final remarks made in Section 4.
2 Basic Scenario of Moving Target Localization
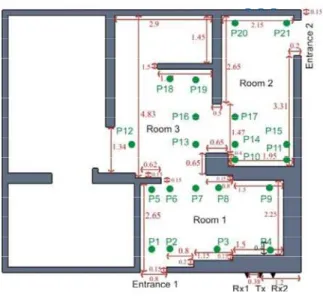
The basic scenario of the target tracking by a multistatic UWB radar system used for the illustration of the imaging method is outlined in the Figs. 1-3. The scenario is represented by moving target positioning through two light concrete walls. The thickness of the first and the second walls were 50 cm and 40 cm, respectively. The walls were arranged parallel way at distance 2.25 m. A person walked along the perimeter of Room 2 from Pos. 14 through Pos. 15, Pos. 21 and Pos. 20 back to Pos. 14 (Fig. 1).
Figure 2
M-sequence UWB radar system
The raw radar data analyzed in this scenario were acquired by means of a multistatic M-sequence UWB radar (Fig. 2) with one transmitting (Tx) and two receiving channels (Rx1, Rx2) [1], [18]. The system clock frequency for the radar device is about 4.5 GHz, which results in an operational bandwidth of about DC-2.25 GHz. The M-sequence order emitted by the radar is 9, i.e. the impulse response covers 511 samples regularly spread over 114 ns. This corresponds to an observation window of 114 ns leading to an unambiguous range of about 16m and a radar resolution of about 3,3 cm. 256 hardware averages of environment impulse responses are always computed within the radar head FPGA to provide a reasonable data throughput and to improve the SNR by 24 dB. The additional software averaging can be provided by the basic software of the radar device. In our measurement, the radar system was set in such a way as to provide approximately 10 impulse responses per second. The total power transmitted by the radar was about 1 mW. The radar was equipped with three double-ridged horn antennas placed in a line (Fig. 1). Here, one transmitting antenna was located in the middle between two receiving antennas.
The raw radar data obtained by the measurement according to above described scenario are aligned to each other to create a 2D picture called a radargram, where the vertical axis is the time propagation (t) of the impulse response and the horizontal axis is the observation time (τ ). The radargrams obtained for the scenario described in this Section are given in the Fig. 4.
The mentioned impulse responses (i.e. the impulse responses of the surroundings, through which the electromagnetic waves emitted by the transmitting antenna of the radar are propagated) are given by a correlation analysis of digital signals obtained by the analogue-to-digital conversion of the voltage at the terminals of the receiving antenna of the radar. With regard to the physical significance of the discussed impulse responses and taking into account the complex process of their creation, the impulse responses and the other quantities obtained based on their processing are considered to be dimensionless physical quantities.
Observation time [s]
Propagation time [ns]
0 5 10 15 20 25 10
20 30 40 50 60 70 80 90 100 110
−0.08
−0.06
−0.04
−0.02
0 0.02 0.04 0.06 0.08
(a)
Observation time [s]
Propagation time [ns]
0 5 10 15 20 25 10
20 30 40 50 60 70 80 90 100 110
−0.08
−0.06
−0.04
−0.02
0 0.02 0.04 0.06 0.08
(b)
Figure 4
3 Imaging Method: Basic Phases and Performance
Illustration
In the case of UWB radar signal processing by imaging method applied for moving target tracking by a multistatic UWB radar, target positioning is a complex process that includes such signal processing phases as raw radar data pre-processing, background subtraction, fusion of the data obtained from the particular receiving channels (antennas) of the radar, detection, localization and tracking [4], [7], [17]. In the next parts of this Section, the significance of particular phases will be outlined and a list of the methods most frequently used for these phases will be given. The outputs of the particular phases will be illustrated by the results of processing of the signals obtained in the basic scenario.
3.1 Raw Radar Data Pre-Processing
The intention of the raw radar data pre-processing phase is to remove or at least to decrease the influence of the radar systems itself on the raw radar data. In our contribution, we will focus on the problem of time-zero setting.
In the case of the sequence UWB radar, its transmitting antenna transmits M-sequences periodically. The exact time instant at which the transmitting antenna starts emitting the first elementary impulse of the M-sequence (so-called chip) is referred to as the time-zero. This depends e.g. on the cable lengths between the transmitting / receiving antennas and the transmitting/receiving amplifiers of the radar, the total group delays of the radar device’s electronic systems, etc.; this especially depends on the chip position at which the M-sequence generator started to generate the first M-sequence. This position is randomly changed after every power supply reconnection. To find the time-zero means to rotate all the received impulse responses in such a way that their first chips correspond to the spatial position of the transmitting antenna. There are several techniques for finding the number of the chips needed for such rotating of the impulse responses. The method most often used is to utilize signal cross-talk [29]. The significance of the time-zero setting comes from the fact that the targets cannot be localized correctly without the correct time-zero setting.
Observation time [s]
Propagation time [ns]
0 5 10 15 20 25 10
20 30 40 50 60 70 80 90 100 110
−0.08
−0.06
−0.04
−0.02
0 0.02 0.04 0.06 0.08
(a)
Observation time [s]
Propagation time [ns]
0 5 10 15 20 25 10
20 30 40 50 60 70 80 90 100 110
−0.08
−0.06
−0.04
−0.02
0 0.02 0.04 0.06 0.08
(b)
Figure 5
Pre-processed radargrams: (a) Receiving channel Rx1; (b) Receiving channel Rx2
3.2 Background
Subtraction
Let us denote the signal scattered from the target and received by the n-th
receiving antenna (Rxn) as sn( , )tτ and all other waves and noises received by
n
Rx are denoted jointly as background b tn( , )τ . Let us assume also that there is no jamming at the radar performance, and the radar system can be described as linear one. Then, the raw radar data obtained from Rxncan be simply modelled by the following expression:
( , ) ( , ) ( , )
n n n
h tτ =s tτ +b tτ . (1)
As is indicated by the name, the background subtraction methods are based on the idea of subtracting the background (clutter) estimation from the pre-processed raw radar data.
Then, the result of the background subtraction phase can be expressed as
ˆ ( , ) ( , ) ( , )
ˆ ( , ) ( , ) ( , )
n n n
b
n n n
h t h t b t
s t b t b t
τ τ τ
τ τ τ
= − =
⎡ ⎤
= +⎣ − ⎦ (2)
where h tbn( , )τ represents a set of the impulse responses with subtracted background and
2
1 ˆ ( , )n n( , )
b t h t τ
τ
τ = ⎣⎡ τ ⎤⎦ (3)
is the background estimation obtained by h tn( , )τ processing over the interval 1, 2
τ∈<τ τ >.
In the above outlined scenario, it can very easily be seen that sn( , )tτ for
.
t=const represents a non-stationary component of h tn( , )τ . On the other hand,
( , )
n
b tτ for t=const. represents a stationary and correlated component
Observation time [s]
Propagation time [ns]
0 5 10 15 20 25 10
20 30 40 50 60 70 80 90 100 110
−1
−0.8
−0.6
−0.4
−0.2
0 0.2 0.4 0.6 0.8 1
(a)
Observation time [s]
Propagation time [ns]
0 5 10 15 20 25 10
20 30 40 50 60 70 80 90 100 110
−1
−0.8
−0.6
−0.4
−0.2
0 0.2 0.4 0.6 0.8 1
(b)
Figure 6
Radargram with subtracted background: (a) Receiving channel Rx1; (b) Receiving channel Rx2
Because of the simplicity of the scenario discussed in this contribution, a noticeable result can be achieved by using the simple exponential averaging method [30], where the background estimation is given by
(
)
ˆn( , ) ˆn( , 1) 1 n( , )
b tτ =αb tτ− + −α h tτ (4)
3.3 Data
Fusion
The intention of the fusion of the data obtained from the particular receiving channels of the radar is to create a radar image ( , , )I x yτ expressing the total level of the signal scattered by the scanned area at the coordinates ( , )x y for the observation time instantτ. To transform the impulse response with subtracted background (impulse responsehbn
( )
t,τ ) into a radar image, different modifications of a back projection algorithm can be used [3], [4], [19].Let us assume that the coordinates of the transmitting antenna Tx and the coordinates of the receiving antenna Rxn(n=1, 2,…,K) are known and they are given by Tx x( Tx,yTx) and Rxn
(
xnR,yRn)
(n=1, 2,…,K ). Then for a homogeneous scanned area, the back projected signal I x y( ,i i, )τ at the pixel P x yi( ,i i)of the room image plane is given by [4]:(
)
1 1
( , , ) ( , , ) ( ),
K K
n i i n i i b i
n n
I x y τ I x y τ h t n τ
= =
=
∑
=∑
(5)where
(
)
( ) /
i i i n
t n = Tx P + P Rx v (6)
(
) (
2)
2i i Tx i Tx
Tx P = x −x + y −y (7)
(
n) (
2 n)
2i n i R i R
P Rx = x −x + y −y (8)
In these expressions, In( ,x yi i, )τ is the radar image corresponding to the impulse responsehbn
( )
t,τ , v is the velocity of the propagation of the electromagnetic wave emitted by the radar, and t ni( )is the total time for the transmitted signal to travel from Tx to the pixel P x yi( ,i i) and then travel back from the pixel( , )
i i i
P x y to Rxn. In expressions (6)-(8), the symbol XY is set for the Euclidean distance between the points XandY.
The result of this procedure is given by a sequence of 2D radar images I x y( , , )τ
x-coordinate [m] y -c o o rd inat e [ m ]
-2.5 -2.0 -1.5 -1.0 -0.5 0.0 0.5 1.0 1.5 2.0 2.5
1 2 3 4 5 6 7 8 9 0 0.1 0.2 0.3 0.4 0.5 0.6 0.7 0.8 0.9 1 (a) x-coordinate [m] y -c oor di nat e [ m ]
-2.5 -2.0 -1.5 -1.0 -0.5 0.0 0.5 1.0 1.5 2.0 2.5
1 2 3 4 5 6 7 8 9 0 0.1 0.2 0.3 0.4 0.5 0.6 0.7 0.8 0.9 1 (b) x-coordinate [m] y -c oor di nat e [ m ]
-2.5 -2.0 -1.5 -1.0 -0.5 0.0 0.5 1.0 1.5 2.0 2.5
1 2 3 4 5 6 7 8 9 0.2 0.4 0.6 0.8 1 1.2 1.4 (c) Figure 7
The data fusion: (a) Radar image I x y1( , , )τ corresponding to the receiving channel Rx1; (b) Radar
image I2( , , )x yτ corresponding to the receiving channel Rx2; (c) Radar image ( , , )I x yτ created by the
3.4 Detection
Detection is the next step in the radar signal processing which comes after the data fusion obtained from the receiving antennas of the radar. It represents a class of methods that determine whether a target is absent or present in the examined radar signals.
The solution of the target detection task is based on statistical decision theory [10], [22]. The detection methods analyze the radar image I x y( , , )τ obtained in the data fusion phase for the propagation time instant τ and reach a decision whether a signal scattered from a target s x y( , , )τ is absent (hypothesis H0) or is present (hypothesis H1) in I x y( , , )τ . These hypotheses can be mathematically described as follows:
0
1
: ( , , ) ( , , )
: ( , , ) ( , , ) ( , , )
BS
BS
H I x y n x y
H I x y s x y n x y
τ τ
τ τ τ
=
= + (9)
where nBS( , , )x yτ represents the residual noise included in ( , , )I x yτ . A detector discriminates between the hypotheses H0 and H1 based on the comparison of testing statisticsX x y( , , )τ and threshold ( , , )γ x yτ . Then, the output of the detector is a binary image Id( , , )x yτ given by
0 ( , , ) ( , , )
( , , )
1 ( , , ) ( , , )
d
if X x y x y
I x y
if X x y x y
τ γ τ
τ
τ γ τ
≤ ⎧
= ⎨ >
⎩ (10)
The detailed structure of a detector depends on the selected strategy and optimization criteria of the detection [10], [14], [22]. Then the selection of the detection strategies and the optimization criteria results in a testing statistic specification and threshold estimation methods.
The most important groups of the detectors applied for radar signal processing are represented by sets of optimum or sub-optimum detectors. Optimum detectors can be obtained as a result of the solution of an optimization task usually formulated by means of probabilities or likelihood functions describing the detection process. Here, the Bayes criterion, the maximum likelihood criterion or the Neymann-Pearson criterion is often used as the bases for the detector design. However, the structure of the optimum detector be extremely complex. Therefore, sub-optimum detectors are also very often applied [22]. For the purpose of target detection by using UWB radars, detectors with fixed threshold, (N,k) detectors [25], IPCP detectors [22] and constant false alarm rate detectors (CFAR) [2] have been proposed.
( , )N k detector originally proposed in [25] and the 2D single-stage ( , )N k
detector. Following [25], the output of the single-stage 2D ( , )N k detector for
2 1
N= l+ can be described by (10) where:
2 ( , ) 1
( , , ) ( , )
k N k i
X x yτ I iτ
=
=
∑
(11)In this expression, I( , )N k ( , )iτ for i=1, 2,…k represents the k-maximum values of I2( , , )v wτ from its N2=(2l+1)2 samples if
{
, 1, , , , 1,}
v∈ x l x l− − + … …x x l+ − x l− (12)
{
, 1, , , , 1,}
w∈ y l y− − +l … …y y+ −l y l− (13)
In the case of ( , )N k detectors it is assumed that γ( , , )x yτ =const. Let us denote the input-output relations of the 2D single-stage ( , )N k detector described by (10)-(13) as
( , )
( , )
( , , ) dN k ( , , )
N k
I x yτ → I x yτ (14)
Then, the 2D double-stage ( , )N k detector is given by the following expressions: ( , )
,1 ( , )
( , , ) dN k ( , , )
N k
I x yτ → I x yτ (15)
( , ) ,1
( , , ) N k ( , , ) ( , , )
X d
I x yτ =I x yτ X x yτ (16)
( , ) ,2 ( , )
( , , ) N k ( , , )
X d
N k
I x yτ → I x yτ (17)
( , ) ,2
( , , ) N k ( , , )
d d
I x yτ =I x yτ (18)
where X x y( , , )τ is given by (11). A detailed description and explanation of the 2D double-stage ( , )N k detector given by (10)-(17) is beyond the scope of this article and they are not given here. Instead, the performance of the 2D double-stage ( , )N k is illustrated for the basic scenario considered in this article. With this intention, the testing statistics for the second stage of the 2D double-stage ( , )N k detector, the output of the first stage and the second stage of the detector
x-coordinate [m]
y-coor
di
n
a
te
[
m
]
-2.5 -2.0 -1.5 -1.0 -0.5 0.0 0.5 1.0 1.5 2.0 2.5 1
2 3 4 5 6 7
0 20 40 60 80 100
(a)
x−coordinate [m]
y
−
coordinate [m]
−2.5 −2.0 −1.5 −1.0 −0.5 0.0 0.5 1.0 1.5 2.0 2.5 1
2 3 4 5 6 7
(b)
x−coordinate [m]
y
−
coordinate [m]
−2.5 −2.0 −1.5 −1.0 −0.5 0.0 0.5 1.0 1.5 2.0 2.5 1
2 3 4 5 6 7
(c)
Figure 8
The 2D double-stage ( , )N k detector performance illustration: (a) Testing statistics of the second stage of the detector; (b) The output of the first stage of the detector; (c) The output of the second stage of the detector. The symbols “x” and “+” represent the true and estimated positions of the target gravity
3.5 Localization
The aim of the localization phase is to determine the target coordinates in the defined coordinate systems. The target positions estimated in the consecutive time instants create a target trajectory.
If a target is represented by only one non-zero pixel of the detector outputId( , , )x yτ , then the target is referred to as a simple target. However, in the case of the scenario analyzed in this contribution, the radar range resolution (3,3 cm) is considerably finer than the physical dimensions of the target to be detected (a moving person). This results in the detector output being expressed not by only one non-zero pixel ofId( , , )x yτ ; rather, the detector output is given by a complex binary image. The set of non-zero samples of Id( , , )x yτ represents multiple-reflections of the electromagnetic waves scattered by a target or false alarms. The multiple-reflections due to the target are concentrated around the true target position at the detector outputs. In this case, the target is the distributed target. In the part of Id( , , )x yτ where the target should be detected not only non-zero but also by zero samples of Id( , , )x yτ can be observed. This effect can be explained by a complex target radar cross-section due to the fact that the radar resolution is much higher than that of the target size and taking into account the different shape and properties of the target surface. The set of false alarms is due to especially weak signal processing under very strong clutter presence.
Because the detector output for a distributed target is very complex, the task of distributed target localization is more complicated than for a simple target. For that purpose, an effective algorithm has been proposed in [17] for UWB radar signal processing by using time of arrival estimation. The basic idea of distributed target localization introduced in [17] consists in the substitution of the distributed target with a proper simple target. This basic idea can be applied in a modified form also for UWB radar signal processing by the imaging method. In this case, the distributed target is substituted by the simple target located in the center of gravity of the distributed target. The coordinates of the target gravity center
[xT( ),τ yT( )]τ for observation time instant τ can be evaluated by
(
)
(
)
(
)
(
)
1
( ) , ,
, ,
1
( ) , ,
, ,
T d
i j i j
T d
i j i j
x iI i j
I i j
y jI i j
I i j
τ τ
τ
τ τ
τ =
=
∑∑
∑∑
∑∑
∑∑
(19)
The influence of the particular detection stages upon the target positioning accuracy, if the target is substituted with its gravity center, is illustrated in Fig. 8 (b) and (c). In these figures, the symbols “x” and “+” represent the true and estimated positions of the target gravity center, respectively. The comparison of the target positions given in these figures indicates that the 2D double-stage ( , )N k detector has the potential to overcome the 2D single-stage ( , )N k detector performance.
The true trajectory and the trajectory estimated by the localization method of the target moving according to basic scenario outlined in Section 2 are given in Fig. 9. Here, the distributed target position has been substituted by the simple target position by use of the center of the gravity of the distributed target according to (19) applied to the output of the 2D double-stage ( , )N k detector. It can be observed from Fig. 9 that the estimation of the target position based on the localization phase is very noisy, deformed and shifted along the y-axis. The detailed analysis of the noise present at the target trajectory estimate has shown that this effect is due to imperfect radar system performance under the hard conditions and the quality of the signal processing methods applied for raw radar data processing. In order to smooth out the target trajectory estimate, target tracking algorithms can be applied with advantage.
-3 -2 -1 0 1 2 3 3
4 5 6 7 8
x -coordinate [m]
y
- c
o
o
rd
inat
e [
m
]
location 2S-TF true track Kalman filter
Figure 9
Target localization and tracking
precision. Therefore, this so-called wall effect displaces the target outside of its true position, if through wall localization is based on the above mentioned simplified assumption. With regard to that fact, the precision of through wall localization can be improved if the quantities such as the permittivity, permeability and thickness of the wall are included in the target positioning procedure. For that purpose, the wall effect compensation method proposed in [4] can be used with advantage. Because, in our scenario, the wall permittivity and permeability were not known, the wall effect compensation was not considered here.
3.6 Tracking
The target position estimate can be improved by target tracking. Target tracking provides a new estimation of the target location based on its previous positions. Most of the tracking systems utilize a number of basic and advanced modifications of Kalman filters, such as for example linear, nonlinear and extended Kalman filters [15], [8], and particle filters [5]. In addition to Kalman filter theory, further methods of tracking are available. They are usually based on smoothing the target trajectory obtained through target localization methods. Here, the linear least-square method is also widely used (e.g. [6]). Another approach to target tracking is represented by join target localization and tracking. Here, the Taylor series based tracking algorithm [21] can be given as the example.
The detailed analyses of the target coordinates obtained in the localization phase during through wall tracking of a moving target by the UWB radar have shown that the target coordinate estimation error does not possess the nature of additive Gaussian or impulsive noise. As the consequence, the “traditional” tracking or smoothing algorithms (e.g. averaging, Wiener filters, linear Kalman filters, median filters, etc.) will have reduced efficiency. A possible solution to this problem could be through, for example, the application of extended Kalman filters or particle filters. However, these alternatives are characterized by high computational complexity. Thus, a possible solution of that problem is the application of the low-complex nonlinear two-stage tracking filter (2S-TF) not requiring Gaussian noise assumption [7].
Conclusions
In this contribution, the imaging method for moving target tracking by the multistatic UWB radar systems was described. Firstly, we outlined the theoretical base of the particular phases of the imaging method and then we presented an overview of signal processing methods which can be applied in the corresponding phases. The imaging method, including its particular phases, was illustrated by a real UWB radar signal processing. The obtained results expressed by the visual comparison of the true trajectory of the target and the target trajectory estimations (Fig. 9) were revealed that the described imaging method can provide good results for through wall tracking of a single moving target by a multistatic UWB radar system equipped with one transmitting and two receiving antennas. The illustrated performance of the described imaging method was also confirmed by a number of similar results obtained for different scenarios (more precisely, for different kinds of the walls) of through wall tracking of a single moving target.
As follows from the method applied for the data fusion from the particular receiving antennas (expression (5)), the proposed approach of radar signal processing for the purpose of through wall tracking of a moving target can in principle be extended to scenarios employing a general multistatic UWB radar system (one transmitting and n≥2 receiving antennas) or to radar systems using
2
m≥ transmitting and n≥2 receiving antennas, usually referred to as MIMO radars. In the case of these modified scenarios and under the condition of multiple target tracking, the presented fundamental algorithm of data fusion must be supplemented by suitable methods of radar data association and advanced approaches to target localization. In order to improve the target positioning accuracy, the wall effect, the effect of an incidental dispersion and the effect of multiple reflections must be taken into account. The solution to these challenging problems will be the object of our follow-up research.
Acknowledgement
This work was supported by the Slovak Research and Development Agency under contract No. LPP-0080-09 (50%). This work is also the result of the project implementation Centre of Information and Communication Technologies for Knowledge Systems (project number: 26220120020) supported by the Research & Development Operational Programme funded by the ERDF (50%).
References
[1] Crabbe S. et al.: Ultra Wideband Radar for Through Wall Detection from
the RADIOTECT Project, Fraunhofer Symposium, Future Security, 3rd
Security Research Conference Karlsruhe, Karlsruhe, Germany, 2008
[2] Dutta P., Arora A. K., Bibyk S. B.: Towards Radar-enabled Sensor
[3] Engin E., Ciftcioglu B., Ozcan M., Tekin I.: High Resolution Ultrawideband Wall Penetrating Radar, Microwave and Optical Technology Letters, Vol. 49, No. 2, pp. 320-325, 2006
[4] Gauthier S., Hung E., Chamma W.: Surveillance Through Concrete Walls, Technical Memorandum, DRDC Ottawa TM 2003-233, Canada, pp. 1-66, Dec. 2003
[5] Grewal M. S., Andrews A. P.: Kalman Filtering: Theory and Practice,
Prentice Hall, 2003
[6] Hellebrandt M., Mathar R., Scheibenbogen M.: Estimating Position and
Velocity of Mobiles in a Cellular Radionetwork, IEEE Transactions on Vehicular Technology, Vol. 46, No. 1, pp. 65-71, 1997
[7] Kocur D., Gamec J., Švecová M., Gamcová M., Rovňáková J.: A New
Efficient Tracking Algorithm for Through Wall Tracking of Moving Target
by Using UWB Radar, The 54th Internationales Wissenschaftliches
Kolloquium, Ilmenau University of Technology, Ilmenau, Germany, 2009
[8] Krokavec, D., Filasová , A.: Diskrétne systémy. Elfa, Košice, 2008
[9] Mafhaza B. R., Elsherbeni A. Z.: MATLAB Simulation for Radar System
Design, Chapman & Hall, CRC Press LLC, 2004
[10] Minkler G., Minkler J.: CFAR: The Principles of Automatic Radar Detection in Clutter, Magellan Book Company, 1990
[11] Nag S., Barnes M.: Moving Target Detection Filter for an Ultra-Wideband Radar, IEEE Radar Conference ’03, pp. 147-153, May 2003
[12] Nag S., Fluhler H., Barnes H.: Preliminary Interferometric Images of Moving Targets Obtained Using a Time-modulated Ultra-Wide Band Through-Wall Penetration Radar, IEEE Radar Conference ’01, pp. 64-69, 2001
[13] Piccardi M.: Background Subtraction Techniques: a Review, Proceedings of IEEE SMC International Conference on Systems, Man and Cybernetics, The Hague, The Netherlands, Vol. 4, pp. 3099-3104, Oct. 2004
[14] Poor H. V.: An Introduction to Signal Detection and Estimation, Springer Verlag, 1994
[15] Ristic B., Arulampalam S., Gordon N.: Beyond the Kalman Filter: Particle Filters for Tracking Applications, Artech House, 2004
[16] Rovňáková J., Kocur D.: Compensation of Wall Effect for Through Wall Tracking of Moving Targets, Radioengineering, Vol. 18, No. 2, pp. 189-195, 2009
[17] Rovňáková J., Švecová M., Kocur D., Nguyen T. T., Sachs J.: Signal
[18] Sachs J. et al.: Detection and Tracking of Moving or Trapped People Hidden by Obstacles using Ultra-Wideband Pseudo-Noise Radar, The 5th European Radar Conference (EuRAD), Amsterdam, Netherlands, pp. 408-411, Oct. 2008
[19] Sachs J., Zetik R., Peyerl P., Friedrich J.: Autonomous Orientation by Ultra Wideband Sounding, International Conference on Electromagnetics in Advanced Applications, Torino, Italy, 2005
[20] Stauffer C., Grimson W.: Learning Patterns of Activity Using Real-Time Tracking, IEEE Transactions on Pattern Analysis and Machine Intelligence, Vol. 22, No. 8, pp. 747-757, Aug. 2000
[21] Švecová, M., Kocur, D.: Taylor Series-based Tracking Algorithm for Through Wall Tracking of a Moving Persons. Acta Polytechnica Hungarica, Vol. 7, No. 1, 2010, pp. 5-21
[22] Taylor J. D.: Ultra-Wideband Radar Technology, CRC Press, 2001
[23] Tipping M. E., Bishop C. M.: Mixtures of Probabilistic Principal Component Analysers, Neural Computation, Vol. 11, No. 2, pp. 443-482, Feb. 15, 1999
[24] Toyama K., Krumm J., Brumitt B., Meyers B.: Wallflower: Principles and Practice of Background Maintenance, 7th IEEE International Conference on Computer Vision, Vol. 1, pp. 255-261, 1999
[25] Van der Spek G. A.: Detection of a Distributed Target, IEEE Trans. on Aerospace and Electronic Systems, Vol. 7, No. 5, pp. 922-931, 1971
[26] Withington P., Fluhler H., Nag S.: Enhancing Homeland Security with Advanced UWB Sensors, IEEE Microwave Magazine, Vol. 4, No. 3, pp. 51-58, Sept. 2003
[27] Wren C. et al.: Pfinder: Real-time Tracking of the Human Body, IEEE Transactions on Pattern Analysis and Machine Intelligence, Vol. 19, No. 7, pp. 780-785, July 1997
[28] Yarovoy A.: Ultra-Wideband Radars for High-Resolution Imaging and Target Classification, European Radar Conference, Munich, Germany, Oct. 2007
[29] Yelf R.: Where is True Time Zero? The 10th International Conference on Ground Penetrating Radar, Vol. 1, pp. 279-282, 2004