Models of field-aligned currents needful to simulate
the substorm variations of the electric field
and other parameters observed by EISCAT
M. A. Volkov1, A. A. Namgaladze1, 2
1Polar Geophysical Institute, 15 Halturina St., Murmansk, 183010, Russia
2Murmansk State Technical University, 2 Sportivnaya St., Murmansk, 183010, Russia Received: 24 January 1996/Revised: 27 May 1996/Accepted: 29 May 1996
Abstract. We have used the global numerical model of the coupled ionosphere-thermosphere-protonosphere system to simulate the electric-field, ion- and electron-temper-ature and -concentration variations observed by EISCAT during the substorm event of 25 March 1987. In our previous studies we adopted the model input data for field-aligned currents and precipitating electron fluxes to obtain an agreement between observed and modelled ionospheric variations. Now, we have calculated the field-aligned currents needful to simulate the substrom vari-ations of the electric field and other parameters observed by EISCAT. The calculations of the field-aligned currents have been performed by means of numerical integration of the time-dependent continuity equation for the cold mag-netospheric electrons. This equation was added to the system of the modelling equations including the equation for the electric-field potential to be solved jointly. In this case the inputs of the model are the spatial and time variations of the electric-field potential at the polar-cap boundaries and those of the cold magnetospheric electron concentration which have been adopted to obtain the agreement between the observed and modelled ionos-pheric variations for the substorm event of 25 March 1987. By this means it has been found that during the active phase of the substorm the current wedge is formed. It is connected with the region of the decreased cold magnetospheric electron content travelling westwards with a velocity of about 1 km s~1at ionospheric levels.
1 Introduction
The behaviour of the high-latitude ionosphere during an isolated substorm observed on 25 March 1987 has been simulated numerically by Namgaladzeet al. (1996). The global numerical model of the Earth’s
thermosphere-iono-Correspondence to:A. A. Namgaladze
sphere-protonosphere system (Namgaladze et al., 1988, 1991) has been used to calculate the variations in electric field and ion and electron temperature and con-centration for the quiet day of 24 March 1987 and disturbed day of 25 March. The model input data for field-aligned currents and precipitating electron fluxes have been selected to obtain an acceptable agreement between variations observed by EISCAT (Collis and Ha¨g-gstro¨m, 1989, 1991) and those from the ionospheric modes. The best agreement has been achieved when the field-aligned currents of the substorm current wedge were added to the region-1 and 2-field-aligned currents during an active phase of a substorm.
The three-dimensional current system, named the sub-storm current wedge, has been suggested and discussed by many authors (e.g. Bonnevier et al., 1970; McPherron et al., 1973; Kamide et al., 1976; Rothwell et al., 1984; Rostoker and Eastman, 1987; Kanet al., 1988, 1992; Kan, 1993). It consists of the field-aligned currents flowing out of the ionosphere at the pre-midnight sector and flowing in at the post-midnight sector closed by the horizontal ionospheric currents and magnetospheric currents per-pendicular to the geomagnetic field. In Namgaladzeet al. (1996) the spatial and time variations of such a field-aligned current system were not calculated but selected to obtain the best fit to the electric-field variations observed by EISCAT.
substorm current wedge and for the corresponding iono-spheric variations of the electric field and electron and ion temperature and concentration? As it will be shown, the development of the current wedge during the substorm active phase can be related to the region of the decreased cold magnetospheric electron content travelling west-wards with a velocity of about 1 km s~1at ionospheric levels.
2 Formulation of the problem, basic equations
The model calculations of the variations in ionospheric electric field and electron and ion temperature and con-centration for the substorm event of 25 March 1987 have been performed using the new version (Namgaladzeet al., 1995a) of the global numerical model of the Earth’s thermosphere-ionosphere-protonosphere system (Nam-galadzeet al., 1988, 1994) analogous to the calculations made by Namgaladzeet al. (1996). The main difference is that now the field-aligned currents are not the input parameters for the model, but have been calculated by solving the time-dependent continuity equation for the cold magnetospheric plasma-sheet electrons integrated along the closed geomagnetic field lines:
j
p"!BiLRm/Lt!R~2E sin~1h[(LRm/Lh) (Lu/Lj)
!(LR
m/Lj) (Lu/Lh)], (1) wherej
pis the field-aligned current density defined to be positive for currents flowing out the ionosphere;B
iis the geomagnetic field at the base of the field line in the ionosphere (h"175 km); R
m"eN/Bi is the integrated pseudo-Hall magnetospheric conductivity; e"the elec-tron charge;N"B
i:(n/B)dl, where the integration is car-ried out along geomagnetic field lines fromh"175 km up
to the top of the field line,nis the concentration of the magnetospheric plasma-sheet electrons, and soNis half of the total plasma-sheet electron content in the field line tube;tis time;R
Eis the Earth’s radius;his the geomag-netic colatitude,jis the geomagnetic longitude measured from magnetic midnight to east; u is the electric-field potential determined from the continuity equation for the ionospheric currents:
+[pLi(+u!]B)!j
p]"0. (2)
Here pLi is the ionospheric conductivity tensor, is the neutral wind velocity vector. Both are calculated in the model by solving the continuity and momentum equa-tions for the neutral and charged particles.Bandj
pare the vectors of the geomagnetic field and field-aligned current density, respectively.
Equation 1 is obtained from the time-dependent conti-nuity equation for the magnetospheric plasma-sheet elec-trons under the following assumptions. The field-aligned currents are carried by the electrons; the magnetospheric plasma-sheet electrons are cold, i.e. their gradient and other drifts are neglected in comparison with the electro-magnetic one; the electric field is potential. The geomag-netic field lines are electrically equipotential;nis constant along the geomagnetic field lines. For the stationary case
Eq. 1 has been obtained by Vasyliunas (1972) and Maltsev (1974). In our calculations the field-aligned currents are assumed to be flowing only at the closed dipole geomag-netic field lines up to the polar-cap boundary, along which the distribution of the electric-field potential is taken in the following form:
u
b"[uc(t)/2] sinj, (3)
where u
c is the potential drop across the polar cap. Its variation during the growth phase of the substorm (1540—1640 UT) is taken as the linear increase from 20 to 80 kV. The variations of the precipitating electron fluxes are taken in the same form as in Namgaladzeet al. (1996). The integrated magnetospheric conductivity distribu-tion during the quiet condidistribu-tions till up to the moment of the beginning of the growth phase (1540 UT) is taken in the form:
R
m0"R0exp [!(h!hb)2/(Dh)2], h5hb"16°, (4) where hb is the geomagnetic colatitude of the polar-cap boundary, Dh"10°, R
0"100 Sm. During the growth phase of the substorm (1540—1640 UT), the polar-cap boundary moves linearly 4°equatorwards.
The expansion phase of the substorm continues for 20 min (1640—1700 UT). During this phase the integrated magnetospheric conductivity varies by the following means:
R
m"Rm0M1!0.3 exp [!(j!j0(t))2/(Dj)2]N, (5) where Dj"23° is the longitudinal half-width of the re-gion of the decreased plasma-sheet electron content cen-tred at the longitudej0. The centre of the region is moving westwards with a speed of 1.2 km s~1at the ionosphere level. The maximum decrease in the plasma-sheet electron content, and correspondingly in the integrated magneto-spheric conductivity, is 30%. Figure 1 shows the northern polar geomagnetic (U,K) plot of the integrated magneto-spheric conductivity at 1550 UT (top panel) and 1650 UT (bottom panel).
During the recovery phase of the substorm (after 1700 UT), the distributions of the magnetospheric con-ductivity and electric-field potential at the polar-cap boundary recover to the undisturbed state exponentially, with the characteristic time of 1.5 h.
Equations 1 and 2 were solved numerically together with all other equations of the model, namely the continu-ity, momentum and heat balance equations for the main neutral gases (N
2, O2, O), molecular (O`2 and NO`) and atomic (O` and H`) ions, and electrons for the height range of 80 km up to 15R
Fig. 1. The north geomagnetic (U,K) polar plots of the integrated magnetospheric conductivity (Sm) at the growth phase (top) and at the expansion phase (bottom) of the substorm; the Sun position is at the top of the figure
that the full system of the modelling equations for the neutral and charged particles is solved. The differences between the self-consistent solutions and those obtained by the use of the MSIS-86 model were discussed by Namgaladzeet al. (1995b). These differences are signifi-cant for the calculated thermospheric wind disturbances but are not important for the calculated field-aligned current and electric-field variations discussed here.
3 The results of the model calculations
The calculated electric-field potential and field-aligned currents at the northern high-latitude ionosphere for the different phases of the substorm are shown in Figs. 2 and 3. The field-aligned currents of region 1 are distributed along the polar-cap boundary and are not shown in Fig. 3. During the quiet conditions and growth phase of the substorm, the calculated electric-field potential and field-aligned currents are consistent with the average statistical picture of these parameters for the weakly disturbed geomagnetic conditions (Heppner and Maynard, 1987; Iijima and Potemra, 1978). During the expansion phase of the substorm a pair of the field-aligned currents flowing out of and into the ionosphere (the substorm current
Fig. 2. The geomagnetic (U,K) polar plots of the calculated
electric-field potential (kV) in the northern high-latitude ionosphere at the growth phase (top) and at the expansion phase (bottom) of the substorm; the Sun position is at the top of the figure
wedge) appears at the midnight sector. It is produced by the westward-travelling region of the decreased magneto-spheric conductivity. The outflowing current is westward from the inflowing. The maximum density of the out-flowing current is about 1 A m~2. In the case when the region of the decreased magnetospheric conductivity is not travelling, the current-wedge field-aligned currents are generated by!V
E·+Nin magnetospheric plasma, where
V
EisE]Bplasma drift. Therefore they are generated at the eastern and western edges of the region of decreased plasma content as far as V
Eis eastward in the region of decreased plasma content. We can see that it is really so in the midnight sector in our calculations when comparing Figs. 1, 2 and 3 (bottom panels).
Fig. 3. The geomagnetic (U,K) polar plots of the calculated field-aligned current density (A km~2) in the northern high-latitude iono-sphere at the growth phase (top) and at the expansion phase (bottom) of the substorm; the Sun position is at the top of the figure
Fig. 4. The calculated longitudinal variations of the field-aligned
current density along the 68°geomagnetic latitude in the end of the substorm expansion phase for the cases:1, the region of decreased magnetospheric conductivity is travelling westwards and2, it is at rest
travelling speedV
trof the decreased plamsa content region on the current wedge field-aligned current generation is opposite that ofV
E: the westward travelling of the ‘‘hole’’ acts as the eastward electromagnetic plasma drift.
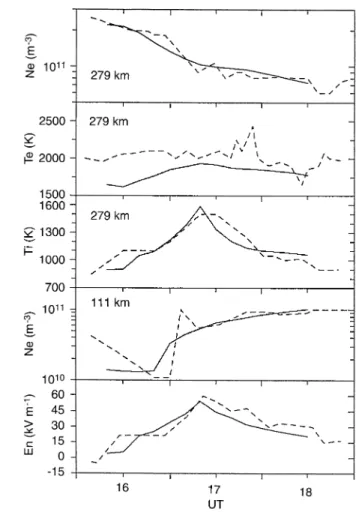
The calculated time variations of the northward elec-tric-field component, electron concentration at the heights
Fig. 5. The calculated variations (solid curves) and those observed
by EISCAT on 25 March 1987 (dashed curves) in the north-ward electric field (bottom panel), E-region electron concentration at 111-km altitude and F2-region ion and electron temperature and electron concentration at 279-km altitude
111 and 279 km, and electron and ion temperature at the 279-km altitude over the EISCAT transmitter position are shown in Fig. 5 together with the variations of these parameters observed by EISCAT on 25 March 1987 (Col-lis and Ha¨ggstro¨m, 1989, 1991). As can be seen in this figure, the agreement between the observed and calculated variations is quite satisfactory.
4 Discussion of the results
Opgenoorthet al. (1983) presented the results of the observations of the field-aligned currents at the western and eastern edges of the auroral surge. The field-aligned current flowing out of the ionosphere is connected with the westward-travelling bend of auroras at the western edge of the auroral surge. The speed of the travelling is about 1—2 km s~1 at the ionosphere level. Baumjohann et al. (1991) presented the satellite observation data of plasma-sheet variations during the substorm expansion phase for 39 substorm events. In all these cases decreases in the central-plasma-sheet ion concentration of about 50% were observed simultaneously with temperature in-creases. These variations are apparently related with the geomagnetic-field-line reconnection processes leading to the plasma heating and the pushing out of the region of the heating. The conductivity of this region is decreased and a part of the transverse magnetospheric current is closed through the ionosphere forming the current wedge. The observations of the decreased magnetospheric plasma concentration by Baumjohannet al. (1991) are not direct evidence of the decreased plasma tube content. Neverthe-less, we consider it is reasonable to assume that the vari-ations in magnetospheric plasma concentration during the substorm expansion phase reflect the variations in plasma tube content. Due to the dipolarization of the geomagnetic field inside the current wedge (Kan et al., 1992) the volume of the geomagnetic field tube should be decreased, and if the total plasma tube content is not decreased the plamsa concentration should be increased, in contradication with the observations by Baumjohann et al. (1991).
5 Conclusions
We have obtained the magnetospheric conductivity variations permitting us to simulate numerically the be-haviour of the field-aligned currents, electric fields and high-latitude ionosphere parameters in agreement with the observations. During quiet geomagnetic conditions and at the substorm growth phase, the distribution of the field-aligned currents and electric-field potential in the high-latitude ionosphere corresponds to the magnetos-pheric conductivity model which is uniform in longitude and drops exponentially with latitude equatorward from the polar-cap boundary with the characteristic latitude scale of about the auroral-zone width.
During the substorm expansion phase a region of de-creased (about 30% in comparison with a ground state) plasma-sheet electron content in the geomagnetic field tube appears at the midnight sector and travels westwards with a speed of about 1 km s~1at the ionosphere level, forming the substorm current wedge. An appearance of such a region of decreased magnetospheric conductivity agrees with the decreases in central-plasma-sheet ion con-centration observed simultaneously with increases in their temperature during the substorm expansion phase (Baumjohannet al., 1991).
Acknowledgements. This work is supported by the grants No. RLX300 from the International Science Foundation and Russian
Government and No. 95-05-14505 from the Russian Foundation of Fundamental Investigations. The authors would like to thank O. V. Martynenko and A. N. Namgaladze for their assistance in the calculations and Yu. N. Korenkov and V. V. Klimenko for useful remarks.
Topical Editor D. Alcayde´ thanks T. Iijima for his help in evaluating this paper.
References
Baumjohann, W., G. Paschmann, T. Nagai, and H. Luhr,
Super-posed epoch analysis of the substorm plasma sheet,J.Geophys.
Res.,96,11 605, 1991.
Bonnevier, B. R., R. Bostrom, and G. Rostoker,A model for
propaga-tion of the westward traveling surge,J.Geophys.Res.,75,107, 1970.
Collis, P. N., and I. Ha~ggstro~m,High-resolution measurements of
the main ionospheric trough using EISCAT,Adv.Space Res.,9,
45, 1989.
Collis, P. N., and I. Ha~ggstro~m,High-latitude ionospheric response
to a geomagnetic sudden commencement,J.Atmos.¹err.Phys., 53,241, 1991.
Hedin, A. E.,MSIS-86 thermospheric model,J.Geophys.Res.,92,
4649, 1987.
Heppner, J. P., and N. C. Maynard,Empirical high-latitude electric
field models,J.Geophys.Res.,92,4467, 1987.
Hoffman, R. A., R. Fujii, and M. Sugiura, Characteristics of the
field-aligned current system in the night-time sector during auro-ral substorms,J.Geophys.Res.,99,21 303, 1994.
Iijima, T., and T. A. Potemra,Large-scale characteristics of
field-aligned currents associated with substorms,J.Geophys.Res.,83,
599, 1978.
Kamide, Y., F. Yasuhara, and S.-I. Akasofu,A model current system
for the magnetospheric substorms,Planet.Space Sci.,24, 212, 1976.
Kan, J. R.,A global magnetosphere-ionosphere coupling model of
substorms,J.Geophys.Res.,98,17 263, 1993.
Kan, J. R., L. Zhu, and S.-I. Akasofu,A theory of substorm: onset
and subsidence,J.Geophys.Res.,93,5624, 1988.
Kan, J. R., W. Sun, S.-I. Akasofu, T. Iijima, and T. A. Potemra,
A global model of the substorm current system,Geophys.Res.
¸ett.,19,969, 1992.
Lopez, R. E., H. E. Spence, and C.-I. Meng,DMSP F7 observations
of a substorm field-aligned current,J.Geophys.Res.,96,19 409, 1991.
McPherron, R. L., C. T. Russel, and M. P. Aubry,Satellite studies
of magnetospheric substroms on 15 August 1968. Phenom-enological model for substorms, J Geophys. Res., 78, 3131, 1973.
Maltsev, Yu. P.,An influence of the ionospheric conductivity on the
convection system in the magnetosphere,Geomagn.Aeron.,14,
154, 1974.
Namgaladze, A. A., Yu. N. Korenkov, V. V. Klimenko, I. V. Karpov, F. S. Bessarab, V. A. Surotkin, T. A. Clushchenko, and N. M.
Naumova,Global model of the
thermosphere-ionosphere-proto-nosphere system,Pure Appl.Geophys.,127,219, 1988.
Namgaladze, A. A., Yu. N. Korenkov, V. V. Klimenko, I. V. Karpov,
V. A. Surotkin, and N. M. Naumova,Numerical modelling of the
thermosphere-ionosphere-protonosphere system,J.Atmos.¹err.
Phys.,53,1113, 1991.
Namgaladze, A. A., Yu. N. Korenkov, V. V. Klimenko, I. V. Karpov,
F. S. Bessarab, V. M. Smertin, and V. A. Surotkin,Numerical
modelling of the global coupling processes in the near-Earth space environment,S¹EP,¹he Initial Results from S¹EP Facili
-ties and¹heory Campaigns.Proc.1992 STEP Symp. 5, COSPAR Coll. Ser.,5,807, 1994.
Namgaladze, A. A., O. V. Martynenko, and A. N. Namgaladze,
Global model of the upper atmosphere with variable latitudinal steps of numerical integration,IºGG XXI General Assembly,
Namgaladze, A. A., O. V. Martynenko, and A. N. Namgaladze,
Numerical simulation of the EISCAT observed ionospheric variations by the use of the self-consistent ionsophere-thermosphere model including the electric field calculations, 7th EISCA¹ Scientific ¼orkshop, Cargese, Abstracts, 114,
1995b (and submitted to Ann. Geophysicae for Special EISCAT Issue).
Namgaladze, A. A., O. V. Martynenko, A. N. Namgaladze, M. A. Volkov, Yu. N. Korenkov, V. V. Klimenko, I. V. Karpov, and F. S.
Bessarab,Numerical simulation of the ionospheric disturbance
over EISCAT by the use of the global ionospheric model,J.
Atmos.¹err.Phys.,58,297, 1996.
Opgenoorth, H. J., R. J. Pellinen, W. Baumjohann, E. Nielsen, G.
Marklund, and L. Eliasson,Three-dimensional current flow and
particle precipitation in a westward travelling surge,J.Geophys.
Res.,88,3138, 1983.
Rostoker, G., and T. Eastman,A boundary layer model for
mag-netospheric substorms,J.Geophys.Res.,92,12 187, 1987.
Rothwell, P. L., M. B. Silevitch, and L. P. Block,A model for the
propagation of the westward travelling surge,J.Geophys.Res.,
84,8941, 1984.
Vasyliunas, V. M., The interrelationship of magnetospheric
pro-cesses, inEarth’s Magnetospheric Processes, ed. M. McCormac, D. Reidel, Norwell, Mass., p. 29, 1972.