www.ann-geophys.net/26/2203/2008/ © European Geosciences Union 2008
Annales
Geophysicae
Multi-instrument observations of nightside plasma patches under
conditions of IMF
B
z
positive
A. G. Wood1, S. E. Pryse1, H. R. Middleton1, and V. S. C. Howells2
1Aberystwyth University, Aberystwyth, UK 2Rutherford Appleton Laboratory, Didcot, UK
Received: 30 November 2007 – Revised: 7 March 2008 – Accepted: 5 April 2008 – Published: 5 August 2008
Abstract. Results are presented from two multi-instrument case studies showing patches of cold, long-lived plasma in the winter nightside ionosphere during times when the z-component of the Interplanetary Magnetic Field (IMFBz)
was positive. These enhancements were coincident with the antisunward convective plasma drift, flowing from polar to nightside auroral latitudes. In the first case, on 5 December 2005 with IMFBy negative, two regions of enhanced
elec-tron density were observed extended in MLT in the magnetic midnight sector separated by lower densities near midnight. It is likely that the earlier enhancement originated on the day-side near magnetic noon and was transported to the night-side sector in the convective flow, whilst the later feature originated in the morning magnetic sector. The lower den-sities separating the two enhancements were a consequence of a pair of lobe cells essentially blocking the direct anti-sunward cross polar flow from the dayside. A second case study on 4 February 2006 with IMFBy positive revealed a
single nightside enhancement likely to have originated in the morning magnetic sector. These multi-instrument investiga-tions, incorporating observations by the EISCAT radar facil-ity, the SuperDARN network and radio tomography, reveal that plasma flowing from the dayside can play a significant role in the nightside ionosphere under conditions of IMFBz
positive. The observations are reinforced by simulations of flux-tube transport and plasma decay.
Keywords. Ionosphere (Plasma convection; Plasma temper-ature and density; Polar ionosphere)
Correspondence to:A. G. Wood ([email protected])
1 Introduction
Ionospheric plasma in the polar cap is structured on a wide range of horizontal spatial scale sizes (e.g. Tsunoda, 1988). Structuring on large scales results in F-region electron den-sity enhancements known as polar cap patches. These have a horizontal extent of at least 100 km and plasma densi-ties of at least twice the surrounding background density (Crowley, 1996). Buchau et al. (1983) observed patches at Thule, Greenland (77.50◦N, 69.20◦W; 85.43◦ MLAT, 32.38◦ MLON) drifting antisunward with the background plasma flow. The flux of precipitating particles in the central region of the polar cap was insufficient to produce the patch densities and therefore it was concluded that the patches were not produced locally by in situ precipitation. Weber et al. (1984) proposed that the patches were produced on the dayside at auroral or subauroral latitudes and then convected antisunward to higher, polar latitudes. In winter, patches have been observed to travel across the entire polar cap (We-ber et al., 1986) and an individual patch was followed for over 3000 km from the centre of the polar cap to the pole-ward edge of the nightside auroral oval. Measurements of the patch density and the surrounding background density showed that both decreased by a factor of two during the transit of the patch, in good agreement with F-region recom-bination rates. Recomrecom-bination is greater at lower altitudes (e.g. Brekke, 1997) and so patch-lifetime depends on alti-tude, with patches at greater altitudes having longer lifetimes (e.g. Walker et al., 1999).
Polar cap patches drift in the high latitude convection, the patterns for which are illustrated under different Interplan-etary Magnetic Field (IMF) conditions in Reiff and Burch (1985) and Heelis (1988). Under conditions of IMFBz
2204 A. G. Wood et al.: Nightside plasma patches under IMFBzpositive
convection pattern towards dawn (dusk) for positive (nega-tive) values. The relative importance of IMFBzand IMFBy
is given by the clock angle,θ. θ=arctan
By Bz (1) For clock angles of less than 70◦ the convection pattern is driven by reconnection in the magnetospheric lobe (Freeman et al., 1993) and the resulting lobe convection cells occur with sunward plasma flow near local noon (Lockwood and Moen, 1999). Polar cap patches are generally associated with IMFBznegative (Valladares et al., 1988), although they
have also been observed at times of IMFBzpositive. Using
an ionosonde and optical instruments McEwen and Harris (1996) observed 523 patches close to the geomagnetic pole (89◦MLAT) during four winters and found that they were primarily associated with times of IMFBznegative, although
20% occurred during times of IMFBz positive. Closer
in-spection of the latter group showed that, in most cases, either IMFBzwas close to zero or had become positive within two
hours previous to observations and it was proposed that the patches under IMFBzpositive had entered the polar cap
un-der IMFBznegative (McEwen and Harris, 1996). Middleton
et al. (2005) observed a tongue-of-ionisation under condi-tions of IMFBzpositive being swept around the periphery of
the polar cap in the post-noon sector.
Patch occurrence exhibits an UT dependence. Observa-tions by Buchau et al. (1985) at Thule, Greenland showed patches present between 13:00 UT and 00:00 UT with maxi-mum electron density around 18:00 UT, although this could be as late as 21:00 UT. Comparison of patch densities with electron densities two degrees equatorward of the cusp sug-gested photoionisation as a plasma source for the patches. Later modelling studies by Sojka et al. (1994) in the magnetic midnight sector at 80◦MLAT showed that, at winter solstice, patches were most intense between 20:00 UT and 00:00 UT and absent between 08:00 UT and 12:00 UT. The UT de-pendence here also suggested photoionisation as a source of patch plasma with the variation arising because of the offset between the geographic and geomagnetic poles (Coley and Heelis, 1998). The high latitude convection pattern is driven in the geomagnetic reference frame, which is approximately centred on the geomagnetic pole. At around 18:00 UT, when the geomagnetic pole is sunward of the geographic pole, the convection pattern therefore reaches lower geographic lati-tudes at local noon than at other universal times. Photoioni-sation is a function of geographic latitude and so when the high latitude convection pattern reaches lower geographic latitudes larger plasma densities are entrained into the po-lar cap flow. This suggests that the European sector should be favourable for observing nightside patch enhancements.
While patches have been studied extensively in the dayside ionosphere and in the central regions of the polar cap, studies in the night sector are less common. Nightside patches have been observed by Weber et al. (1986), however in this study
the IMF conditions were not known. Patches have been pre-dicted from modelling under conditions of IMFBz negative
using the Utah State University Time Dependant Ionospheric Model (TDIM) for different orientations of IMFBy
(Bow-line et al., 1996). Variations inBy modified the symmetry
of the convection pattern and, although this did not alter the prediction of patches in the nightside ionosphere, it did al-ter the location at which they were expected. Using eight years of meridian scanning photometer data on the night-side, Moen et al. (2007) identified airglow from 333 F-region polar cap patches that merged into the poleward boundary of nighttime aurorae under conditions of IMF Bz negative.
The MLT distribution of the patches was symmetric around 23:25 MLT and, using the statistical flow patterns of Ruo-honiemi and Greenwald (2005), this indicated that patches did not preferentially originate from either the dawn or dusk cell. It was thus concluded that there was no IMF By
de-pendence in the statistical occurrence of nightside polar cap patches. Patches on the nightside in winter have also been observed by the Sondrestrom Incoherent Scatter radar drift-ing out of the polar cap and into the auroral zone (Pedersen et al., 2000). Lorentzen et al. (2004) observed airglow from patches on the nightside exiting the polar cap by crossing the open closed field line boundary (OCB) during tail reconnec-tion under IMFBznegative and predominantlyBy positive.
Pryse et al. (2006) observed a patch in the nightside polar ionosphere which reconfigured to form a boundary blob at the equatorward edge of the evening auroral sector.
To date, polar cap patches have not been reported in the nightside ionosphere under conditions of IMFBz positive.
In this current paper two multi-instrument studies from 5 De-cember 2005 and 4 February 2006 are presented showing the presence of polar patches when IMFBzwas positive and
sta-ble. The regions of enhanced electron density are identified and their origin is discussed.
2 Instrumentation
2.1 EISCAT Svalbard radar
The European Incoherent SCATter radar facility (EISCAT) comprises several radars on mainland Scandinavia and at Longyearbyen on Svalbard. Of particular interest to this study are measurements of electron density and tempera-ture, and line-of-sight plasma drift velocity made by the EIS-CAT Svalbard Radar (ESR) located at 78.2◦N, 16.0◦E; 75.2◦ MLAT, 112.9◦ MLON, using the TOI/NIGHT UK special programme. The 42 m dish of the radar observed along the geomagnetic field in the F-region (azimuth−179.0◦;
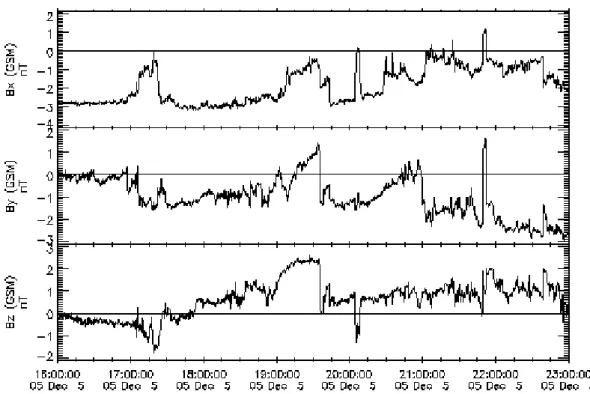
Fig. 1.The x-, y- and z-components of the interplanetary magnetic field observed by the ACE spacecraft between 16:00 UT and 23:00 UT on 5 December 2005.
meridian. Each scan commenced at an elevation of 35.1◦to the north and finished at an elevation of 35.1◦ to the south. The scan contained 36 positions with a dwell time of 32 s at each pointing direction, and had a total cycle time of approx-imately 20 min.
2.2 SuperDARN radar network
The Super Dual Auroral Radar Network (SuperDARN) is a network of high latitude coherent scatter radars comprising nine radars in the Northern Hemisphere and seven in the Southern Hemisphere (Greenwald et al., 1995) which ob-serve line-of-sight plasma velocities in the F-region. These measurements can be inverted using the spherical harmonic fitting technique of Ruohoniemi and Baker (1998) to infer the high-latitude electric potential patterns in the Northern and Southern Hemispheres. As the plasma drift velocity is perpendicular to both the electric and magnetic fields in the F-region (E×B drift) the plasma convection pattern can be
directly inferred from the electric potential maps. 2.3 Radio tomography
The ionospheric radio tomography experiment of Aberys-twyth University comprises a chain of receiving stations in Northern Scandinavia, with the receivers separated in latitude but essentially aligned in longitude at Tromsø (69.8◦N, 19.0◦E; 66.1◦ MLAT, 103.4◦ MLON), Bjørnoya (74.5◦N, 19.0◦E; 71.3◦MLAT, 108.8◦MLON),
Longyear-byen (78.2◦N, 15.7◦E; 75.1◦ MLAT, 113.0◦ MLON) and Ny- ˚Alesund (78.9◦N, 12.0◦E; 76.0◦ MLAT, 112.3◦ MLON). These stations monitor coherent radio signals at 150 MHz and 400 MHz from polar orbiting satellites for measurement of total electron content along a large number of intersecting satellite-to-receiver ray paths. The electron content observations are inverted in a tomographic recon-struction algorithm to yield the spatial distribution of electron density over a latitude-versus-altitude plane (Pryse, 2003, and references therein).
2.4 Defense Meteorological Satellite Program
The Defense Meteorological Satellite Program (DMSP) ob-serves the Earth and space environment with satellites in near-polar orbits at altitudes of 835 km to 850 km and a pe-riod of some 100 min. Of particular relevance to the current study are the measurements of the energy flux of precipitat-ing electrons made by the SSJ/4 particle detectors on satel-lites F13, F15 and F16 (Hardy et al., 1984).
3 Results: 5 December 2005
3.1 Geophysical conditions
2206 A. G. Wood et al.: Nightside plasma patches under IMFBzpositive
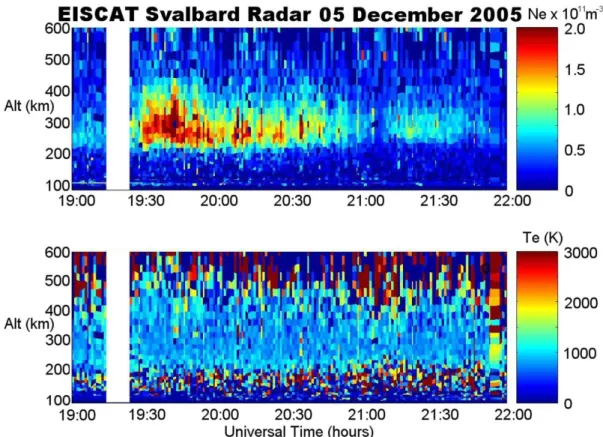
Fig. 2. Electron densities (top panel) and electron temperatures (bottom panel) measured by the 42 m dish of the EISCAT Svalbard Radar observing along the geomagnetic field between 19:00 UT and 22:00 UT on 5 December 2005.
Sun-Earth line (Zwickl et al., 1998). The x-, y- and z-components of the Interplanetary Magnetic Field (IMF) in geomagnetic co-ordinates observed between 16:00 UT and 23:00 UT on 5 December 2005 are shown in the three pan-els of Fig. 1. Between 16:00 UT and 17:00 UT IMFBzwas
weakly negative with a mean value of−0.3 nT, IMFBywas
weakly negative with a mean value of−0.1 nT and the clock angle was approximately 110◦. There was then a brief excur-sion of IMFBz to−1.6 nT at 17:20 UT. IMFBz was stable
and positive between 17:50 UT and 23:00 UT with a mean value of 1.0 nT, IMFBy was mainly negative with a mean
value of −1.2 nT and the clock angle was approximately
50◦. The solar wind velocity at the time was approximately 350 km s−1and the delay between the observations at the L1
point and the response of the ionosphere was about 82 min using the method of Lockwood et al. (1989). The F10.7solar
flux index was 91.7 sfu andKp was stable, taking values of
1- and 0 between 18:00 UT and 24:00 UT. 3.2 Electron densities and temperatures
The electron densities and temperatures observed by the field-aligned 42 m dish of the EISCAT Svalbard Radar (ESR) between 19:00 UT and 22:00 UT are shown in Fig. 2. A clear region of enhanced electron densities was observed between 19:24 UT and 20:59 UT above the 0.7×10¹¹m−3level at the
peak altitude of 275 km. The average density of the enhance-ment at this altitude was 1.4×10¹¹m−3. A background
elec-tron density value of 0.3×10¹¹m−3was established for the
observations, taken as the mean of the lowest 25% of electron density observations at 275 km during the entire experiment (18:00 UT to 24:00 UT) which included the data presented in Fig. 2. The precise timing of the onset of the enhance-ment could not be determined due to the data gap between 19:15 UT and 19:24 UT but this was not of significance for the study under discussion. The largest densities were ob-served in the earlier part of the feature with a maximum density of 2.7×10¹¹m−3at 19:42 UT. Lower densities were
observed at later times, with the electron densities reducing to 0.7×10¹¹m−3at 20:59 UT. A second region of enhanced
electron densities was later observed between 21:11 UT and 21:32 UT with an average electron density of 0.8×10¹¹m−3
at 275 km. The two enhancements were separated by a re-gion of lower densities of 0.5×10¹¹m−3. Electron
tempera-tures, shown in the lower panel of Fig. 2, took values of about 850 K between 19:00 UT and 22:00 UT in both the enhanced and background densities, and ruled out the production of the enhancements by local precipitation.
2.2×10¹¹m−3 was observed equatorward of 79◦N in the first scan starting at 19:26 UT. The beam of the 42 m dish intersected this scan at 78◦N and observed similar density levels of 1.6×10¹¹m−3at 19:34 UT. Poleward of 79◦N the
32 m dish observed lower electron densities, taking an aver-age value of 0.5×10¹¹m−3. In each of the following three
scans progressively lower electron densities were observed in the enhancement. Evidence for a second density enhance-ment is seen in the second panel, poleward of 80◦N. Corre-sponding electron temperatures (not shown) took values of about 820 K across the entire field of view of the scans and ruled out the production of the enhancement by local precip-itation.
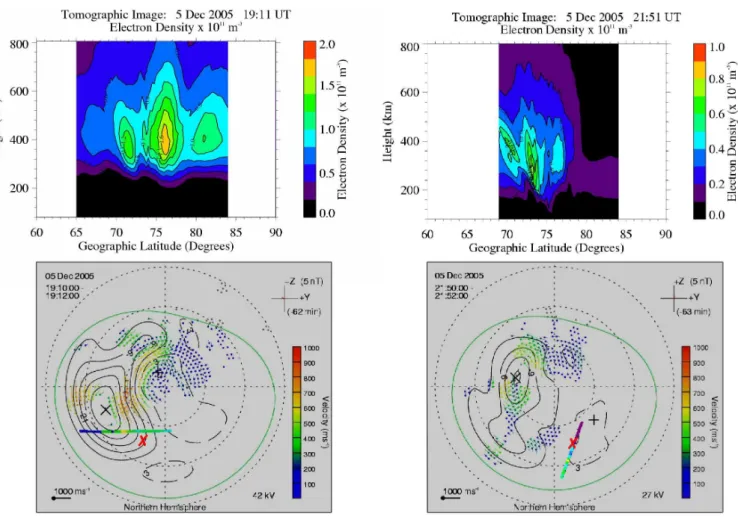
The radio tomography experiment observed the spatial dis-tribution of electron density on a wider latitudinal spatial scale. Electron densities observed by the experiment during satellite passes that crossed a latitude of 75◦N at 19:11 UT and 21:51 UT are shown respectively in the top two panels of Fig. 4. Each satellite pass has a duration of some 15 min. The 350 km intersection through the images are shown on the magnetic co-ordinate system (MLAT-versus-MLT) in the lower panels of Fig. 4 with the colours indicating the elec-tron density at the F-region peak. Also shown in these panels are the coincident electric potential patterns inferred by the SuperDARN radars, which are discussed in more detail in Sect. 3.3.
The radio tomography image at 19:11 UT showed three regions of enhanced electron density in the evening sector centred on 71.6◦N, 76.0◦N and 81.0◦N with correspond-ing electron densities of 1.4×10¹¹m−3, 1.7×10¹¹m−3 and
1.2×10¹¹m−3, respectively. Their peak altitude was about
390 km, higher than observed by the ESR. Caution should be exercised in inferring the altitude from the tomography im-ages because of geometrical constraints leading to limitations in the technique to determine the vertical distribution of the electron density (Pryse, 2003). However, this restricted abil-ity to determine the altitude of the peak electron densabil-ity does not detract from the validity of the method to locate the lat-itudinal locations of the enhancements. By comparison with the corresponding SuperDARN convection pattern, the en-hancements centred at 76.0◦N and 81.0◦N were in antisun-ward cross polar flow, whilst that centred on 71.6◦N was in return sunward flow slightly equatorward of the convection reversal. At 19:11 UT the ESR 42 m radar observed a peak electron density of 0.4×10¹¹m−3at 275 km (Fig. 2), which
preceded the large enhancement it observed a few minutes later. This apparent discrepancy between the time of en-hancement observed by radio tomography and the ESR radar can be explained by geometrical effects. The trajectory of the 350 km intersection of the satellite trajectory was pole-ward of the radar, which is indicated by the red cross on the convection map. It is therefore not unreasonable to conclude that the enhancement was observed in the tomography field of view before it was seen by the ESR downstream in the convection pattern.
Fig. 3.Electron densities measured by the 32 m dish of the EISCAT Svalbard Radar scanning from north to south along the geographic meridian between 19:26 UT and 20:46 UT on 5 December 2005.
The second radio tomography image at 21:51 UT inter-sected the magnetic post-midnight sector. The peak electron density values were much lower than in the earlier pass, typ-ically 0.8×10¹¹m−3between 69.0◦N and 77.0◦N. Between 78.0◦N and 84.0◦N the peak electron density did not exceed 0.2×10¹¹m−3. Comparison with the SuperDARN
convec-tion pattern showed that the trajectory of this satellite pass did not intersect the antisunward flow of the dusk convection cell. The trajectory may have intersected the dawn convec-tion cell, although cauconvec-tion is needed in this interpretaconvec-tion due to the absence of radar measurements in this region. Elec-tron densities observed in this sector by the ESR 42 m dish at 78◦N, almost colocated with the tomography observations, were 0.5×10¹¹m−3 in broad agreement with the
tomogra-phy values.
3.3 High latitude electric potential pattern.
2208 A. G. Wood et al.: Nightside plasma patches under IMFBzpositive
Fig. 4.Electron densities observed by the radio tomography experiment during a satellite pass that crossed a latitude of 75◦N at 19:11 UT (top left panel) and 21:51 UT (top right panel), and the corresponding electric potential patterns inferred from the SuperDARN radars at 19:11 UT (bottom left panel) and 21:51 UT (bottom right panel). The multicoloured lines on the potential maps indicate the satellite trajectories intersecting the ionosphere at an altitude of 350 km with the colours representing the electron density at the F-region peak of the tomography image. To clearly show the electron density observed by the radio tomography experiment at 21:51 UT an electron density scale is used in the right hand panels with a maximum value of half that used in the left hand panels. The red crosses represent the position of the EISCAT Svalbard Radar.
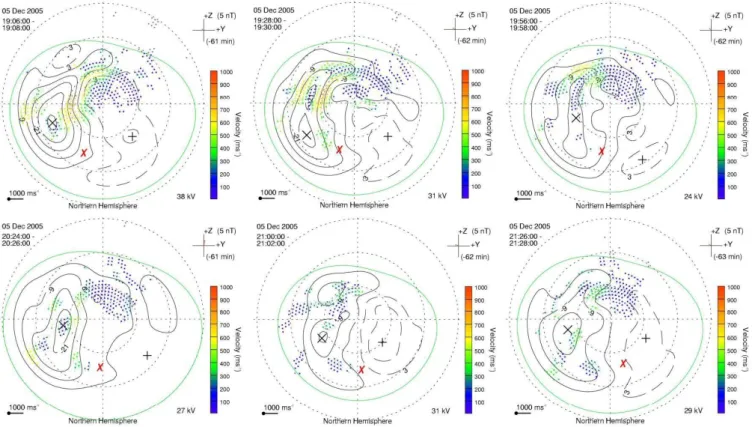
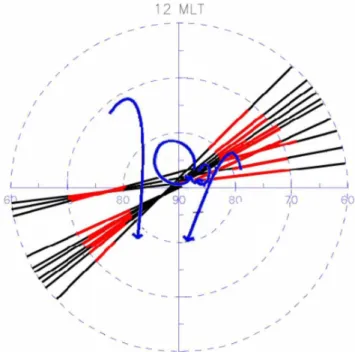
in the antisunward flow throughout the interval of interest. The larger density enhancement observed by ESR prior to 21:00 UT clearly corresponded to the dusk cell whilst the smaller enhancement at later times was likely to have been in the dawn cell. Figure 6 shows the SuperDARN electric potential pattern for 20:10 UT. The time of 20:10 UT was chosen as it is close to the centre of the time range of the ESR 32 m dish scans plotted in Fig. 3. The latitudinal cover-age of the four successive scans of the ESR 32 m dish at an altitude of 300 km are also plotted as red lines. Of particu-lar note is the fact that the higher geographic latitudes of the scans correspond to later magnetic local times and it is likely that the northern field-of-view of the radar scans was in the dawn convection cell, whilst the equatorward portion was in the antisunward flow of the dusk cell. This interpretation is consistent with the electron densities in Fig. 3, where the enhancement in the southern field of view is associated with
the dusk cell, whilst the lower densities and smaller enhance-ment in panel 2 of Fig. 3 are likely to be within the dawnside cell. The blue curves schematically emphasise the convec-tion pattern, including a pair of lobe cells close to 85◦MLAT, 12:00 MLT. Lobe cells were also observed in this vicinity on each of the plots in Fig. 5, however they are more difficult to identify due to the contouring.
3.4 Precipitation
The DMSP F13, F15 and F16 satellites observed the en-ergy flux of ions and electrons at high latitudes in the North-ern Hemisphere. An energy flux of electrons in excess of 1×107cm−2ster−1s−1at an energy of 250 eV was taken as
Fig. 5.Electric potential patterns inferred from the SuperDARN radars for 19:06 UT, 19:28 UT, 19:56 UT, 20:24 UT, 21:00 UT and 21:26 UT on 5 December 2005. The red crosses indicate the position of the EISCAT Svalbard Radar beam at an altitude of 300 km.
plotted in Fig. 7. The parts coloured red indicate where the flux threshold is exceeded. The blue curves show the schematic representation of the high latitude convection pattern, reproduced from Fig. 6. Comparison of the plasma flow with the regimes of precipitation on the satellite trajec-tories showed that the antisunward plasma flow of the dusk cell did not pass through a region of ongoing precipitation, and this was ruled out as a mechanism for maintaining den-sities as the plasma flowed from the dayside to the premid-night sector. At earlier MLTs, in the afternoon sector, there were no DMSP observations to establish the occurrence of precipitation, however a contribution by precipitation to the ionisation production in this region would have been small compared to photoionisation (e.g. Walker et al., 1999). The plasma flowing antisunward in the dawn cell did pass through a region of precipitation, and so in this instance precipitation may have contributed to the densities observed in the post-midnight sector.
4 Results: 4 February 2006
4.1 Geophysical conditions
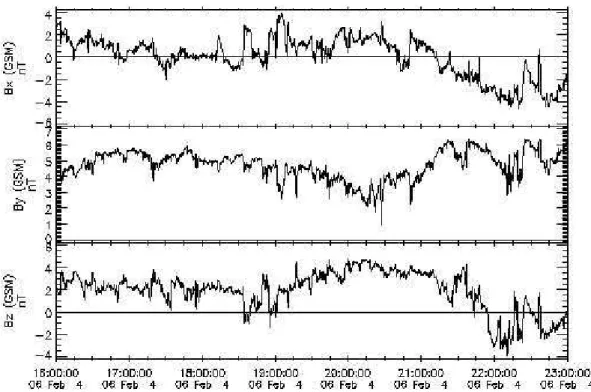
The three components of the IMF observed by the ACE spacecraft between 16:00 UT and 23:00 UT on 4 February
2006 are shown in Fig. 8. During this interval IMFBzwas
initially strongly positive with an average value of 2.6 nT between 16:00 UT and 21:30 UT, after which it reduced in magnitude. At 21:54 UT IMF Bz turned negative and
re-mained negative until after 23:00 UT. IMF By was stable
and strongly positive throughout the evening with an aver-age value of 4.6 nT between 16:00 UT and 23:00 UT. The clock angle was approximately 60◦ between 16:00 UT and 21:30 UT, after which it increased and was approximately 110◦ between 22:00 UT and 23:00 UT. The solar wind ve-locity was about 365 km s−1giving a delay in the ionospheric
response of approximately 70 min using the method of Lock-wood et al. (1989). The F10.7solar flux was 77.0 sfu andKp
was stable, being 0+ between 18:00 UT and 24:00 UT. 4.2 Electron densities and temperatures
Electron densities and temperatures observed by the field-aligned 42 m dish of the ESR between 19:00 UT and 22:00 UT are shown in Fig. 9. A region of enhanced elec-tron densities was observed between 19:35 UT and 21:11 UT defined by the 0.5×10¹¹m−3 contour with an average
electron density of 0.9×10¹¹m−3 and a peak altitude of
255 km. All densities above 1.95×10¹¹m−3 are shown
2210 A. G. Wood et al.: Nightside plasma patches under IMFBzpositive
Fig. 6. Electric potential pattern inferred from the SuperDARN radars for 20:10 UT on 5 December 2005. The red lines indicate the positions of the 300 km ionospheric intersection of successive scans by the EISCAT Svalbard Radar commencing at 19:26 UT, 19:47 UT, 20:07 UT and 20:27 UT. The blue curves are a schematic of the high latitude convection pattern.
The background density for the 18:00 UT to 24:00 UT in-terval, which included the data presented in Fig. 9, was 0.3×10¹¹m−3. Electron temperatures were about 900 K
throughout the observations and therefore in situ precipita-tion was ruled out as a source of the enhanced densities. 4.3 Plasma drift flow
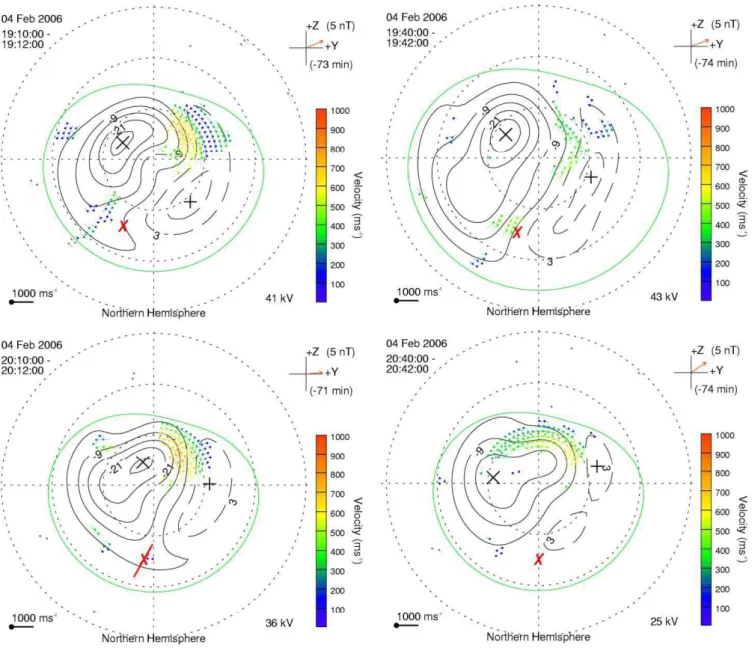
Representative high latitude electric potential maps obtained by the SuperDARN radars at 2-min resolution are shown in Fig. 10a for 19:10 UT, 19:40 UT, 20:10 UT and 20:40 UT. The convection pattern did not show significant variation be-tween 19:00 UT and 22:00 UT. There is very little data in the midnight sector, however there is sufficient data on the day-side to show a two cell convection pattern with plasma drawn from the magnetic morning sector towards the midnight sec-tor. On the dayside the convection pattern was dominated by two cells, with the dusk cell being significantly larger than the dawn cell. Support for the nightside flow is provided by the ESR 32 m dish that was scanning along the geographic meridian from north to south. Its 300 km altitude intersec-tion is shown on the third panel of Fig. 10a for 20:10 UT, and the line-of-sight plasma drift velocities that it measured be-tween 19:55 UT and 20:15 UT are shown in Fig. 10b. These radar observations are representative of those for the interval from 19:35 UT to 20:55 UT, and show a flow component to-wards the radar in the northern field of view and away from the radar in the southern field of view, consistent with it being located in the antisunward flow.
Fig. 7.The trajectories of F13, F15 and F16 DMSP satellite passes between 17:00 UT and 22:00 UT over northern high latitudes on 5 December 2005. The red portions of the trajectory lines, indicate regions where precipitation is occurring and the blue curves are a schematic of the high latitude convection pattern.
4.4 Precipitation
Between 17:00 UT and 22:00 UT the energy flux of ions and electrons at northern high latitudes were monitored during 9 DMSP satellite passes. Their trajectories are shown in Fig. 11, with the red lines indicating regions of enhanced electron flux, indicative of precipitation as defined for Fig. 7 (Sect. 3.4). In this instance the electron density enhance-ments observed on the nightside may have been on stream-lines that traversed ongoing precipitation in the polar region of the morning sector.
5 Discussion
Two case studies have been presented showing regions of en-hanced electron density in the night sector. Both occurred under quiet geomagnetic conditions when IMFBzwas
posi-tive. In the first study IMFBywas negative and in the second
Fig. 8.The x-, y- and z-components of the interplanetary magnetic field observed by the ACE spacecraft between 16:00 UT and 23:00 UT on 4 February 2006.
2212 A. G. Wood et al.: Nightside plasma patches under IMFBzpositive
Fig. 10a. Convection patterns inferred from the SuperDARN radars for 19:10 UT, 19:40 UT, 20:10 UT and 20:40 UT on 4 February 2006. The red crosses indicate the location of the field aligned beam of the 42 m dish of the EISCAT Svalbard Radar at an altitude of 300 km and the red line indicates the positions of the 300 km ionospheric intersection of a scan by the 32 m dish of the EISCAT Svalbard Radar commencing at 19:55 UT.
antisunward convective flow to the observing location. The peak altitude of the enhancement, at 275 km, was lower than anticipated for polar patches which are typically reported at altitudes of around 350 km. However, patches have also been observed at lower altitudes with Weber et al. (1986) report-ing patches identified by the Sondrestrom Incoherent Scatter radar at altitudes between 280 km and 310 km in the night sector. Further support for the altitude is provided by the modelling study of Zou et al. (2000) who used the Cou-pled Thermosphere Ionosphere Plasmasphere (CTIP) model to investigate the annual and semiannual variations in the F2 layer, and placed the altitude of nightside polar cap patches between 270 km and 320 km.
Fig. 10b.Line-of-sight plasma drift velocities measured by the 32 m dish of the EISCAT Svalbard Radar scanning from north to south along the geomagnetic meridian between 19:55 UT and 20:15 UT.
was likely to be associated with the antisunward flow of the dawn cell. These two enhancements were separated by a region of low, background densities that will be discussed later. Observations by the ESR 32 m dish, whilst scanning in latitude along the geographic meridian, showed large den-sities in its equatorward field-of-view that decreased gradu-ally during the four successive scans as the radar moved to later MLTs. This enhancement was initially coincident with the main antisunward flow of the dusk cell, but weakened as the radar approached the edge of the cell near magnetic mid-night. The second scan, starting at 19:47 UT, showed hints of a second, weaker enhancement at higher latitudes, separated from the main enhancement in the southern field-of-view by lower densities. The higher latitudes of the scan mapped to later MLTs than the lower latitudes, and so this secondary enhancement was interpreted as the densities convected into the nightside from the morning cell. The contrast between the densities observed in the two convection cells was also evident by comparison of the two tomography reconstruc-tions; the earlier image at 19:11 UT showed the large densi-ties of the dusk cell, and that for 21:15 UT displayed the low densities in the post-midnight flow.
To investigate further the possibility of photoionisation as the source of the nightside enhanced densities, simula-tions were performed of the flow of plasma flux tubes and of plasma decay. These simulations comprised two stages. The first estimated the time of transit of plasma between the solar terminator on the dayside and the region of observa-tion on the nightside. This was done by tracking the locaobserva-tion of the flux tubes at the observed nightside densities back in time, using the SuperDARN electric potential maps. Track-ing was stopped when the flux tubes crossed the solar ter-minator, defined as where the solar zenith angle at an alti-tude of 300 km was less than 120◦(Roble and Rees, 1977). The procedure also estimated the MLT of where the flux tube crossed the terminator. For sample densities observed by the ESR 42 m radar dish at 19:45 UT, 20:15 UT and 20:45 UT on
Fig. 11.The trajectories of F13, F15 and F16 DMSP satellite passes between 17:00 UT and 22:00 UT over northern high latitudes. The red portion of the trajectories indicate regions where precipitation is occurring and the blue curves show a schematic of the high latitude convection pattern.
Fig. 12. Convection pattern inferred from the SuperDARN radars for 18:00 UT on 5 December 2005. The crosses indicate the loca-tions at 18:00 UT of the electron density enhancements tracked from the nightside ionosphere from 19:45 UT (purple cross), 20:15 UT (red cross) and 20:45 UT (blue cross). The solid black line indi-cates the position of the terminator defined by a solar zenith angle of 120◦at 300 km.
2214 A. G. Wood et al.: Nightside plasma patches under IMFBzpositive
the magnetic noon and post-noon sector between 11:00 MLT and 14:00 MLT (Fig. 12). The times at which these flux tubes crossed the terminator corresponded to when the ionosphere was under the influence of weakly negative IMFBz,
how-ever much of the transit of the ionisation occurred under conditions of IMFBz positive consistent with the
interpre-tation of previous observations made over the geomagnetic pole (McEwen and Harris, 1996). Indeed it is likely that the increased transit times across the polar regions of the flux tubes observed by the ESR 42 m radar dish at 20:15 UT and 20:45 UT occurred due to the increasing influence of the lobe cells under IMFBzpositive.
The second stage of the computer simulation involved us-ing independent dayside observations of the electron density, and estimating its decay, over the transit time determined in the first stage. The decay took into consideration the number density of the neutral species N2 and O2, the ion
temper-ature, the neutral temperature and the relative velocity be-tween the ions and the neutrals. The number densities were estimated from MSIS-90 for N2and O2(Hedin, 1991). Ion
temperatures on the nightside were estimated from the ESR 42 m radar and on the dayside were based on typical values from sunlit EISCAT observations. Plasma velocities were es-timated from the SuperDARN electric potential maps. Neu-tral winds and neuNeu-tral temperatures for the prevailing geo-physical conditions were estimated using the statistical study of Killeen et al. (1995). The recombination rates of Hierl et al. (1997) were used for effective temperatures above 1300 K and those of St-Maurice and Torr (1978) for below 1300 K. The Gakona Ionosonde in Alaska (62.4◦N, 145.1◦W; 56.5◦ MLAT, 214.5◦ MLON) observed the dayside ionosphere when Scandinavia was in the night sector. It is a midlatitude station equatorward of the high latitude convection pattern and can therefore give a good estimate of densities caused by photoionisation without any contribution from precipitation. Gakona is at local magnetic noon at approximately 23:00 UT. Between 19:00 UT on 5 December 2005 and 00:00 UT on 6 December 2005, an interval that spanned 12:00 MLT, the peak electron density observed by the ionosonde was essen-tially constant at 4.5×10¹¹m−3 and was located at heights
in the range 200 km to 250 km. This was used as input to the algorithm as the density at the terminator at an altitude of 275 km. The lower peak altitude on the dayside is not unreasonable because the bottomside of the enhancement is eroded faster by increased recombination rates. Modelling work (Zou et al., 2000) into the annual and semiannual vari-ations in the F2 layer placed the peak altitude on the dayside between 200 km and 260 km. It should be noted that this is therefore likely to be an overestimate of the densities en-trained into the high-latitude convection, with the ionosonde observations being at the peak altitude, rather than at the al-titude of the nightside enhancement. Nevertheless it was the best independent measure available for the study. Over the transit time for the three flux tubes considered above, the den-sity decayed to (2.3±0.6)×1011m−3, (2.1±0.5)×1011m−3
and (1.6±0.4)×1011m−3, respectively, the error being set
primarily by uncertainties in the recombination coefficients and neutral densities. For quantitative comparison with the observations, a 30-min window has been considered cen-tred on each of the time epochs of interest. Within each window the five largest density values at the peak altitude of 275 km were determined, and averaged to obtain a mean value for the interval. The purpose of this was to reduce the effect of rapid variation due to small-scale structure on the comparisons. Mean values of 2.1×10¹¹m−3, 1.8×10¹¹m−3
and 1.6×10¹¹m−3 were obtained for the windows centred
on 19:45 UT, 20:15 UT and 20:45 UT, in reasonable agree-ment with the predicted values. The slight overestimations are a likely consequence of the overestimation of the initial electron density.
The electron density enhancement observed in the post-midnight sector between 21:11 UT and 21:32 UT had lower density values, with an average of 0.8×10¹¹m−3, compared
with that in the pre-midnight sector, with an average of 1.4×10¹¹m−3. When flux tubes from the post-midnight
sec-tor were traced backwards through the convection pattern to the solar terminator they had a transit time of 90 min and originated in the morning sector around 08:00 MLT. This sector is close to sunrise and plasma densities rapidly in-creased at dawn, with the Gakona ionosonde observing den-sities increasing by a factor of 10 between 07:00 MLT and 09:00 MLT. Meaningful comparisons between calculated and observed densities could not therefore be drawn.
The flux tubes containing the low electron densities ob-served by the ESR between the two enhancements (20:59 UT and 21:11 UT) were tracked back in time to a region antisun-ward of the pair of lobe cells with a transit time of 100 min to this point. Lack of data in the SuperDARN electric po-tential maps meant that no meaningful information could be deduced regarding their earlier history. In this region plasma flow was very slow (∼50 m s−1)and so if any en-hancement from dayside photoionisation had been present it would have decayed to background values during the ex-tremely long transit time. This effectively resulted in the lobe cells preventing the flow of enhanced dayside plasma into the magnetic midnight sector.
Geophysical conditions were very similar in the second case study on 4 February 2006 to those of the former study, except IMFBywas strongly positive rather than weakly
When a flux tube at 20:30 UT, within the electron density enhancement observed by the ESR between 19:55 UT and 20:36 UT, was traced backwards through the convection pat-tern it was predicted to cross the terminator 100 min earlier in the dawn magnetic sector at 08:00 MLT under conditions of IMFBzpositive. It is likely that the flux tubes were drawn
from the dusk cell which, due to the large positive values of IMFBy, extended into the dawn sector. However
uncer-tainties in the trajectory tracking meant that a location in the dawn cell could not be ruled out. The Gakona ionosonde observed peak dayside electron densities when it was in sun-light spanning magnetic noon between 20:00 UT on 4 Febru-ary 2006 and 01:00 UT on 5 FebruFebru-ary 2006 which were es-sentially constant at 4.0×10¹¹m−3 at altitudes of between
200 km and 250 km. The peak electron densities on the night-side were at 255 km, a lower altitude than on 5 December 2005 and so recombination rates were faster. The calculation of plasma decay was therefore carried out at an altitude of 255 km and the predicted nightside electron density in this instance was (1.1±0.3)×1011m−3 in good agreement with
the observed value of 1.3×10¹¹m−3. While no in situ
pre-cipitation was observed in the magnetic midnight sector, the DMSP spacecraft observed precipitation in the dawn sector from where this plasma was drawn and this may have led to the slightly larger observed electron densities than those predicted.
6 Conclusions
Two case studies have been presented of long-lived electron density enhancements in the nightside winter ionosphere un-der conditions of IMFBzpositive. In the first of these studies
on 5 December 2005, the enhancement observed before mag-netic midnight was attributed to photoionisation from near magnetic noon on the dayside that had drifted to the nightside in the convective flow. The calculation of decay rates sup-ported this interpretation. A second region of enhanced elec-tron density observed after magnetic midnight was associ-ated with flux tubes originating in the dawn sector. A region of lower electron density separating these two enhancements was attributed to a pair of lobe cells effectively blocking an-tisunward plasma flow from the dayside. A second study under similar geophysical conditions on 4 February 2006 but with IMFBypositive, observed plasma in the nightside
iono-sphere of dayside origin, drawn from the magnetic morning sector. The observations show that, under conditions of IMF Bzpositive, plasma originating on the dayside can play a
sig-nificant role in the nightside ionosphere.
Acknowledgements. Financial support for the project was provided by the UK Science and Technology Facilities Council under grants PP/E001157/1. The assistance of the University of Tromsø and the Norwegian Polar Institute in the tomographic measurements is gratefully acknowledged. EISCAT is an international facility sup-ported by the national science councils of China, Finland, France,
Germany, Japan, Norway, Sweden and UK. The SuperDARN radar facility is funded by the National Research Programs of Australia, Canada, Finland, Japan, South Africa, Sweden, UK and USA and the electric potential map data was provided by Tim Yeoman and Adrian Grocott at the University of Leicester. The IMF data was provided by N. Ness and obtained from the CDAWeb. The DMSP particle detectors data was obtained from the JHU/APL website. A. G. Wood acknowledges receipt of a STFC postgraduate stu-dentship.
Topical Editor K. Kauristie thanks H. Carlson and another anonymous referee for their help in evaluating this paper.
References
Bowline, M. D., Sojka, J. J., and Schunk, R. W.: Relationship of theoretical patch climatology to polar cap patch observations, Radio Sci., 31, 635–644, 1996.
Brekke, A.: Physics of the Upper Polar Atmosphere, Wiley-Praxis Series in Atmospheric Physics, 1997.
Buchau, J., Reinisch, B. W., Weber, E. J., and Moore, J. G.: Struc-ture and dynamics of the winter polar cap F region, Radio Sci., 18, 995–1010, 1983.
Buchau, J., Weber, E. J., Anderson, D. N., Carlson Jr., H. C., Moore, J. G., Reinisch, B. W., and Livingston, R. C.: Ionospheric struc-tures in the polar cap: Their origin and relation to 250-MHz scin-tillation, Radio Sci., 20, 325–338, 1985.
Coley, W. R. and Heelis, R. A.: Seasonal and universal time dis-tribution of patches in the northern and southern polar caps, J. Geophys. Res., 103, 29 229–29 237, 1998.
Crowley, G.: Critical Review of patches and blobs, in Polar Cap Boundary Phenomena, in: URSI Review of Radio Science 1993– 1996, edited by: Stone, W. R., published for the International Union of Radio Science by the Oxford University Press, 619– 648, 1996.
Freeman, M. P., Farrugia, C. J., Burlaga, L. F., Hairston, M. R., Greenspan, M. E., Ruohoniemi, J. M., and Lepping, R. P.: The interaction of a magnetic cloud with the Earth: Ionospheric con-vection in the Northern and Southern Hemispheres for a wide range of quasi-steady interplanetary magnetic field conditions, J. Geophys. Res., 98, 7633–7655, 1993.
Greenwald, R. A., Baker, K. B., Dudeney, J. R., Pinnock, M., Jones, T. B., Thomas, E. C., Villain, J.-P., Cerisier, J.-C., Senior, C., Hanuise, C., Hunsucker, R. D., Sofko, G., Koehler, J., Nielsen, E., Pellinen, R., Walker, A. D. M., Sato, N., and Yamagishi, H.: SuperDARN: A global view of the dynamics of high-latitude convection, Space Sci. Rev., 71, 761–796, 1995.
Hardy, D. A., Schmitt, L. K., Gussenhoven, M. S., Marshell, F. J., Yeh, H. C., Schumaker, T. L., Huber, A., and Pantazis, J., Precip-itating electron and ion detectors (SSJ/4) for the block 5D/flights 6-10 DMSP satellites: Calibration and data presentation, Rep. AFGL-TR-84-0317, Air Force Geophys. Lab., Hanscom AFB, Mass., 1984.
Hedin, A. E.: Extension of the MSIS Thermospheric Model into the Middle and Lower Atmosphere, J. Geophys. Res., 96, 1159– 1172, 1991.
2216 A. G. Wood et al.: Nightside plasma patches under IMFBzpositive
Hierl, P. M., Dotan, I., Seeley, J. V., Van Doren, J. M., Morris, R. A., and Viggiano, A. A.: Rate constants for the reactions of O+ with N2and O2as a function of temperature (300–1800 K), J. Chem. Phys., 106, 3540–3544, 1997.
Killeen, T. L., Won, Y.-I., Niciejewski, R. J., and Burns, A. G.: Upper thermosphere winds and temperatures in the geomagnetic polar cap: Solar cycle, geomagnetic activity, and interplanetary magnetic field dependencies, J. Geophys. Res., 100, 21 327– 21 342, 1995.
King, J. W. and Smith, P. A.: The seasonal anomaly in the be-haviour of the F2-layer critical frequency, J. Atmos. Terr. Phys., 30, 1707–1713, 1968.
Lockwood, M. and Moen, J.: Reconfiguration and closure of lobe flux by reconnection during northward IMF: possible evidence for signatures in cusp/cleft emissions, Ann. Geophys., 17, 996– 1011, 1999,
http://www.ann-geophys.net/17/996/1999/.
Lockwood, M., Sandholt, P. E., Cowley, S. W. H., and Oguti, T.: Interplanetary magnetic field control of dayside auroral activity and the transfer of momentum across the dayside magnetopause, Planet. Space Sci., 37, 1347–1365, 1989.
Lorentzen, D. A., Shumilov, N., and Moen, J.: Drifting airglow patches in relation to tail reconnection, Geophys. Res. Lett., 31, L02806, doi:10.1029/2003GL017785, 2004.
McEwen, D. J. and Harris, D. P.: Occurrence patterns ofF layer patches over the north magnetic pole, Radio Sci., 31, 619–628, 1996.
Middleton H. R., Pryse, S. E., Kersley, L., Bust, G. S., Fremouw, E. J., Secan, J. A., and Denig, W. F.: Evidence for the tongue of ion-isation under northward interplanetary magnetic field conditions, J. Geophys. Res., 103, A07301, doi:10.1029/2004JA010800, 2005.
Moen, J., Gulbrandsen, N., Lorentzen, D. A., and Carlson, H. C.: On the MLT distribution ofF region polar cap patches at night, Geophys. Res. Lett., 34, L14113, doi:10.1029/2007GL029632, 2007.
Pedersen, T. R., Fejer, B. G., Doe, R. A., and Weber, E. J.: An inco-herent scatter radar technique for determining two-dimensional horizontal ionization structure in polar cap F region patches, J. Geophys. Res., 105, 10 637–10 655, 2000.
Pryse, S. E.: Radio tomography – a new experimental technique, Surv. Geophys., 24, 1–38, 2003.
Pryse, S. E., Wood, A. G., Middleton, H. R., McCrea, I. W., and Lester, M.: Reconfiguration of polar-cap plasma in the magnetic midnight sector, Ann. Geophys., 24, 2201–2208, 2006, http://www.ann-geophys.net/24/2201/2006/.
Reiff, P. H. and Burch, J. L.: IMFBy-Dependent Plasma Flow and
Birkeland Currents in the Dayside Magnetosphere 2. A Global Model for Northward and Southward IMF, J. Geophys. Res., 90, 1595–1609, 1985.
Roble, R. G. and Rees, M. H.: Time-dependent studies of the au-rora: Effects of particle precipitation on the dynamic morphology of ionospheric and atmospheric properties, Planet. Space Sci., 25, 991–1010, 1977.
Ruohoniemi, J. M. and Baker, K. B.: Large-scale imaging of high-latitude convection with Super Dual Auroral Radar Network HF radar observations, J. Geophys. Res., 103, 20 797–20 811, 1998. Ruohoniemi, J. M. and Greenwald, R. A.: Dependencies of high-latitude plasma convection: Consideration of inter-planetary magnetic field, seasonal, and universal time fac-tors in statistical patterns, J. Geophys. Res., 110, A09204, doi:10.1029/2004JA010815, 2005.
Sojka, J. J., Bowline, M. D., and Schunk, R. W.: Patches in the polar ionosphere: UT and seasonal dependence, J. Geophys. Res., 99, 14 959–14 970, 1994.
St-Maurice, J.-P. and Torr, D. G.: Nonthermal rate coefficients in the ionosphere: The reactions of O+ with N2, O2 and NO, J. Geophys. Res., 83, 969–977, 1978.
Tsunoda, R. T.: High-latitude F region irregularities: A review and synthesis, Rev. Geophys., 26, 719–760, 1988.
Valladares, C. E., Fukui, K., Sheehan, R., Carlson, H. C., and Bul-let, T.: Simultaneous observations of polar cap patches and sun-aligned arcs during transition of the IMF, Radio Sci., 33, 1829– 1845, 1988.
Walker, I. K., Moen, J., Kersley, L., and Lorentzen, D. A.: On the possible role of cusp/cleft precipitation in the formation of polar-cap patches, Ann. Geophys., 17, 1298–1305, 1999,
http://www.ann-geophys.net/17/1298/1999/.
Weber, E. J., Buchau, J., Moore, J. G., Sharber, J. R., Livingston, R. C., Winningham, J. D., and Reinisch, B. W.: F layer ionisation patches in the polar cap, J. Geophys. Res., 89, 1683–1694, 1984. Weber, E. J., Klobuchar, J. A., Buchau, J., Carlson Jr, H. C., Liv-ingston, R. C., de la Beaujadiere, O., McCready, M., Moore, J. G., and Bishop, G. J.: Polar capF layer patches: Structure and dynamics, J. Geophys. Res., 91, 12 121–12 129, 1986.
Zou, L., Rishbeth, H., M¨uller-Wodarg, I. C. F., Aylward, A. D., Millward, G. H., Fuller-Rowell, T. J., Idenden, D. W., and Mof-fett, R. J.: Annual and semiannual variations in the ionospheric F2-layer. I. Modelling, Ann. Geophys., 18, 927–944, 2000, http://www.ann-geophys.net/18/927/2000/.