www.ann-geophys.net/24/3391/2006/ © European Geosciences Union 2006
Annales
Geophysicae
On the structure of field-aligned currents in the mid-altitude cusp
A. Marchaudon1,2, J.-C. Cerisier3, J.-M. Bosqued4, C. J. Owen1, A. N. Fazakerley1, and A. D. Lahiff1
1Mullard Space Science Laboratory, University College London, Holmbury St Mary, Dorking, RH5 6NT, Surrey, UK 2Now at: Laboratoire de Physique et Chimie de l’Environnement, 3A avenue de la Recherche Scientifique, 45071 Orl´eans
Cedex 2, France
3Universit´e Pierre et Marie Curie-Paris6; Centre d’Etude des Environnements Terrestre et Plan´etaires, 4 avenue de Neptune,
94107 Saint-Maur-des-Foss´es Cedex, France
4Centre d’Etude Spatiale des Rayonnements, 9 avenue du Colonel Roche, 31028 Toulouse Cedex 4, France
Received: 7 September 2006 – Accepted: 26 October 2006 – Published: 21 December 2006
Abstract.We analyse two crossings of the polar cusp at mid-altitudes (≈4RE) by Cluster in order to study the structure
of field-aligned currents associated with the injection of mag-netosheath plasma. The current density is deduced indepen-dently from magnetic field and from particle flux measure-ments. In both cases the data are carefully tested. Magnetic fluctuations are analysed by discriminating between those compatible with the plane current sheet hypothesis under which the current density can be calculated safely, and those resulting from filamentary current structures. At medium transverse scales (80 km), the structure of the currents is more often tube-like than sheet-like, and current sheets are not systematically elongated in the east-west direction. The total particle current is calculated from the electron and ion measurements. For electrons, the full energy range is taken into account, from above the photoelectron threshold up to 32 keV. Magnetosheath plasma injections are well correlated with pairs of field-aligned currents. In both cases, the parallel current is mainly carried by electrons while ions contribute for about 20%. In the plane current sheets, the ratio be-tween magnetic and particle currents shows large variations between 0.4 and 1.1. These fluctuations can be explained by the convective motion of the current sheets.
Keywords. Magnetospheric physics (Current systems; Magnetopause, cusp and boundary layers; Solar wind-magnetosphere interactions)
1 Introduction
The large-scale distribution of field-aligned currents (FACs) connecting the Earth magnetosphere and ionosphere con-sists of two concentric zones encircling the magnetic pole (Iijima and Potemra, 1976). Currents flow in opposite di-Correspondence to:A. Marchaudon
rection in the two zones and also on each side of the noon-midnight plane. The low-latitude currents, called Region-2, are mainly due to pressure gradients in the inner magne-tosphere, while the high-latitude currents, called Region-1, flow at the interface between open and closed field lines and are due to the interaction between the solar wind and the magnetosphere. Region-2 maps into the Central Plasma Sheet (CPS) and Region-1 maps in the Plasma Sheet Bound-ary Layer and Low-Latitude BoundBound-ary Layer (PSBL/LLBL). The particle carriers in the large-scale Region-2/Region-1 FACs have been extensively studied in the dawn and dusk sectors (Klumpar, 1979; Sugiura et al., 1984; Yamauchi et al., 1998). In the dusk sector, downward Region-2 currents are carried by cold electrons extracted from the ionosphere and upward Region-1 currents are essentially carried by pre-cipitating electrons from the PSBL/LLBL. In the dawn sec-tor, upward Region-2 currents are carried by precipitating electrons from the CPS and downward Region-1 currents are carried by upward ionospheric electron bursts.
Only a few papers have presented quantitative compar-isons between field-aligned currents deduced from magnetic and from charged particle measurements. Attempts have been made in the dayside by Berko et al. (1975) and Burch et al. (1983), and in the nightside by Klumpar et al. (1976), Theile and Wilhelm (1980), Sugiura et al. (1984), Burke (1984) and Hoffman et al. (1985). In most of these stud-ies, a comparison of field-aligned current profiles deduced from the two methods was presented. The results were not convincing, either in amplitude or in direction. In particu-lar, downward currents were often not observed in particle data. The suggested explanation was the incomplete energy coverage of the particle detectors at low-energy. Burch et al. (1983) presented one of the best comparisons using data from the DE-1 satellite in the polar cusp. These authors ex-plained that because the cold ionospheric electrons carrying the downward currents were accelerated upward by a poten-tial drop, they could only be detected onboard the spacecraft when it was situated above the potential drop. However, the magnetic and particle current profiles shown were far from identical, especially in the downward current regions. More recently, based on FAST satellite measurements, Elphic et al. (1998) claimed to have obtained a “fairly good” agree-ment between the current densities calculated from the elec-trons fluxes alone and from the magnetic data, but no profile of the two determinations were presented.
The determination of FACs from magnetic field measure-ments onboard a single spacecraft is also not free from criti-cism. An infinite current sheet structure is usually assumed, often with an east-west orientation of the sheet. While these assumptions have proved to be valid and have been widely used when describing the larger-scale parallel cur-rents (Potemra, 1985), smaller-scale magnetic variations of-ten do not fit this infinite current sheet model, thus revealing a more complex filamentary structure. Several attempts have been made to model the effects of finite size currents sheets (Fung and Hoffman, 1992; Seran and Cerisier, 2005) or to in-terpret magnetic variations in terms of current tubes (Robert et al., 1984; Berthelier et al., 1988). However, because the underlying models depend upon a too large number of pa-rameters, these methods do not lead to an unambiguous de-termination of the current density and structure.
This paper represents an attempt to study meso-scale par-allel currents observed in the polar cusp based on simulta-neous particle and magnetic field measurements. To inter-pret magnetic data, we have developed simple tests to se-lect situations where the infinite current sheet hypothesis is valid. We have used magnetic, electron and ion data from the Cluster satellites, taking advantage of the good coverage of the electron experiment in the lower energy range. Two events, during two cusp crossings (29 August 2002 and 10 September 2002) are studied, during which Cluster flew from the dayside to the nightside at mid-altitude (4–5RE), in the
12.2–12.6 MLT sector. The data from each spacecraft were studied independently and based on their completeness, their
quality (high resolution data) and consistency, only the best data sets were selected for detailed analysis. The results are compared qualitatively and quantitatively in terms of the var-ious sources of discrepancy between the particle and mag-netic currents and their implication on the current structure is discussed.
2 Instrumentation
Cluster consists in four identical satellites on an elliptical po-lar orbit with a perigee of∼4RE, an apogee of∼19RE and
a period of∼58 h. The events presented in this study occur during summer 2002, when Cluster crosses the northern mid-altitude cusp near perigee in the burst mode. Electron, ion and magnetic field data are used. The four Cluster spacecraft are in an approximately co-linear formation, which prevents an accurate evaluation of the current density by the curlome-ter technique.
The Plasma Electron and Current Experiment (PEACE) (Johnstone et al., 1997) provides the electron velocity dis-tribution function every 4 s (spacecraft spin period), in the energy range from∼1 eV to∼26 keV. PEACE is composed of a Low-Energy Electron Analyser (LEEA) and a High En-ergy Electron Analyser (HEEA) located on opposite sides of the spacecraft, which measure overlapping energy ranges. In burst mode, the full three-dimensional (3-D) distribution is available and the resulting density and velocity moments are calculated on the ground with a resolution up to 4 s. The en-ergy range falling below the spacecraft potentialUsc is first
removed in order to eliminate the photoelectrons from the moment calculations. The remaining energy range is then rescaled to remove the electron acceleration due to the space-craft potential.
The Cluster Ion Spectrometry (CIS) experiment consists of two different instruments: the Hot Ion Analyser (HIA) and the COmposition and DIstribution Function analyser (CODIF) (R`eme et al., 2001). Both instruments were switched off on 2 and HIA was also switched off on sc-4. For this study, we use HIA on sc-1 which offers a good energy and angular resolution without mass resolution and provides a full three-dimensional energy/velocity distribu-tion (assuming all ions are protons) from thermal energies up to about 32 keV/q. Since HIA is not available on sc-4, we use CODIF which offers a medium angular resolution but mea-sures the full three-dimensional energy/velocity distribution of the major magnetospheric ions (H+, He+, He++and O+) up to about 38 keV/q. Only the proton distribution is used in this case. The density and velocity moments are calculated onboard with a 4 s resolution.
Interplanetary magnetic field and solar wind data from the ACE satellite are also used for monitoring the interplanetary medium, with an appropriate lag to take into account the so-lar wind propagation from ACE to Earth.
3 Analysis of magnetic variations in terms of field-aligned currents
In the magnetosphere where perpendicular currents are negli-gible, the field-aligned current density is related to magnetic variations by Ampere’s law
J//=∇
×b µo
(1) wherebis the perturbation magnetic field obtained after re-moving remote sources such as the Earths main field and the field arising from non-local currents. Since∇×bcannot be calculated from the magnetic perturbations measured along a single satellite trajectory, it is usually assumed that the cur-rents are distributed in infinite parallel current sheets, with-out even testing the validity of this model. Large errors in the current density may then result. For instance, applying an in-finite current sheet algorithm to measurements made in the vicinity, but outside of a current tube (i.e. in a region where no current flows) returns a result suggesting a finite current density at that point in space. Also, the same analysis ap-plied to a crossing of the tube itself will return a changing sheet normal direction, except in the particular case of a cen-tral crossing. It is thus important to be able to identify the situations when the infinite current sheet hypothesis is valid, in order to validate the calculated current density. This is cru-cial if one wants to make fully quantitative comparisons with particle measurements.
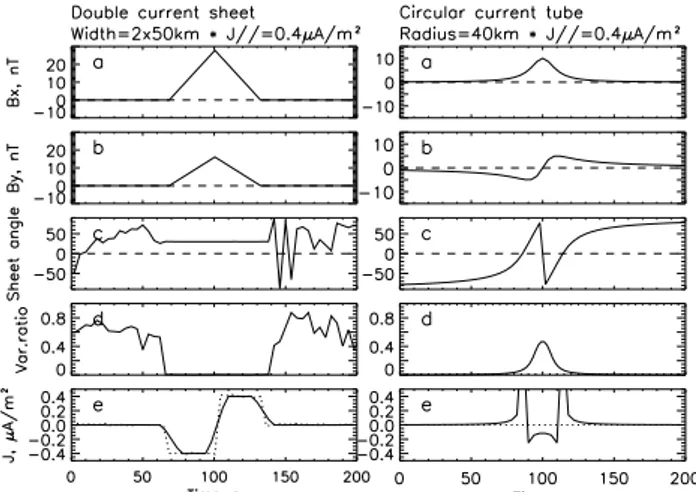
For this purpose, we have modelled the magnetic pertur-bation created along a satellite orbit by two extreme parallel current structures: a circular current tube and a pair of oppo-site parallel infinite current sheets. The orbit is in the plane perpendicular to the ambient magnetic field. Panels (a) and (b) of Fig. 1 display the two components of the magnetic field perturbation in the plane perpendicular to the ambient field, measured along the orbit. The left panels are for the parallel current sheets crossed at an angle of 30◦. The right panels are for a tube tangent to the orbit. In both cases, we have calculated the covariance matrix of the magnetic sig-nal and its eigenvalues and eigenvectors. Panels (c) and (d) show the results obtained for two parameters which appear to be the most pertinent to discriminate between the two struc-tures: (1) the angleα(measured in the plane perpendicular to the ambient field from a fixed reference axis, here the di-rection of the orbit) defining the didi-rection of the eigenvector associated with the largest eigenvalue (panels c) and (2) the ratiorbetween the intermediate and the largest eigenvalues (panels d). In the following, these two parameters will be called “polarisation angle” forαand “variance ratio” forr.
Fig. 1. Models of the magnetic perturbation created by a pair of opposite parallel infinite current sheets (left) and a circular current tube (right). From top to bottom: (a)and(b)the two components of the magnetic field perturbation in the plane perpendicular to the current direction;(c)the angle defining the direction of the eigen-vector associated with the largest eigenvalue;(d)the ratio between the intermediate and the largest eigenvalues; (e)the current den-sity (modelled = dotted line; obtained by applying the infinite sheet hypothesis = solid line).
assume that we are dealing with current sheets only when both the variance ratior is small and the polarisation angle αis stable. If one at least of these conditions is not verified, the local current density cannot be determined safely.
The Cluster satellite data have been processed as follows. In order to remove the background field and to keep only the perturbation fieldbdue to the local currents, we have chosen to detrend the magnetic field by subtracting a polynomial fit calculated on two time intervals (∼3–5 min) immediately be-fore and after crossing the cusp injections where the largest magnetic variations are observed. The perturbation fieldb is then separated into its componentb//parallel to the mean
field, representing the diamagnetic plasma effect, and its per-pendicular componentb⊥due to the field-aligned currents.
As in the above modelling, the current sheet orientation in the plane perpendicular to the main field is given by the di-rection of the eigenvector associated with the largest eigen-value of the covariance matrix ofb⊥, while the sheet normal
is given by the intermediate eigenvalue. Applying the static current sheet model (which excludes the possibility of Alfv´en waves), the curl in Eq. (1) reduces to the time derivative of the component ofb⊥ in the sheet direction. Choosing a
Cartesian reference frame where thezaxis is along the mean magnetic field and thex andyaxis are respectively parallel to the sheet direction (the direction of maximum variance) and normal to the sheet plane (the direction of intermediate variance), the current density is given by
J//=
1 µ0
∂bx
∂t 1 vn
(2)
wherevn is the projection of the spacecraft velocity along
theyaxis (the normal to the sheet plane). PositiveJ//
corre-sponds to an upward current in the northern hemisphere. The current density becomes infinite and the method fails when the spacecraft velocity is parallel to the current sheet (thexz plane).
In case of a drift of the current sheet, the velocityvn in
Eq. (2) is the velocity of the observer relative to the sheet vspacescraft−vsheet
n. Lockwood et al. (2001) have shown
that the sheet velocity may be of the same order as the space-craft velocity near Cluster perigee at medium altitude in the magnetosphere. In the absence of any reliable evaluation of the sheet velocity, we have assumed stationary current sheets. The consequences will be discussed later in Sect. 6.4.
4 Determination of the particle currents
The particle field-aligned current is the sum of the electron and ion currents obtained from the electron and ion density and velocity component parallel to the magnetic field direc-tion
J//part=J//e+J// i = −eneV//e+eniV// i (3)
with positiveJ// i,e andV// i,ecorresponding to upward
cur-rents and velocities,ni,ecorresponding to densities andethe
Coulomb charge.
4.1 Uncertainties in particle current determination
When calculating the electron moments, the contribution of photoelectrons has to be removed. As moments are calcu-lated on the ground using burst mode 3-D distribution data, the variable spacecraft potential, deduced from the electric field experiment, is used and the upper limit of rejected en-ergy bins checked visually. The estimated precision of this ground processing (defined as the sum of the photoelectron processing and a comparison between the overlapping en-ergy range of the low and high enen-ergy sensors) is 10% for the density and 20–25% for the velocity. Moreover, the PEACE and WHISPER electron densities have been compared. The WHISPER density, deduced from the electron plasma fre-quency, is not subject to the errors associated with the photo-electron population, thus providing an independent estimate of the precision of the PEACE-derived measurement of the ambient electron density. The discrepancy between these two electron densities can amount to 15%, slightly higher than the above PEACE estimate of 10%. Summing the density and velocity errors leads to a maximum error on the electron current of∼35–40%. Concerning ion moment processing, the density error is 5% and the velocity error is 5–10%. The CIS and WHISPER densities have also been compared, as-suming quasi-neutrality. The discrepancy between the two densities can reach 35–40%, which can be attributed to cal-ibration errors or saturation in the ion detector (especially CODIF) when the density is large. The maximal error on the ion current (sum of the density and velocity errors) is then of
∼40–50%.
The uncertainty on the total current is thus 35–50% when both the electron and ion currents have the same sign or when the ion current is small. Otherwise the uncertainty may be larger.
4.2 Aliasing effect on particle velocity
The CIS experiment (either HIA or CODIF) is composed of only one sensor and the aliasing effect on the ion veloc-ity is difficult to detect. This effect is however more readily detectable in the electron velocity since the PEACE exper-iment is composed of two sensors (LEEA and HEEA) lo-cated on opposite sides of the spacecraft. During a full spin period, the two sensors will observe the same direction of arrival with a half-spin delay (∼2 s). If a sharp density gra-dient is crossed during the spin, a same given direction of arrival will be observed in different plasmas by the two sen-sors, and an apparent flow in opposite directions between the two sensors may then be generated. When the additional flow velocity is large, the components of the velocity lying in the plane perpendicular to the spin axis (usuallyVx andVy in
GSE coordinates) are opposite in sign between the 2 electron sensors. In this paper, we remove the electron aliasing effect by averaging the moments given by the two PEACE sensors.
5 Cluster observations of the field-aligned currents
We study two mid-altitude northern cusp crossings (29 Au-gust 2002 and 10 September 2002) by the Cluster spacecraft, concentrating on the spacecraft for which ion, electron and magnetic data are available with clear signatures of field-aligned currents. We study the cusp data of sc-1 for 29 Au-gust 2002 and sc-4 for 10 September 2002. In the rest of the paper, we refer to these events as: event A for sc-1 (29 Au-gust 2002) and event B for sc-4 (10 September 2002). The two data sets are plotted in the same format in Figs. 2 and 3, with, from top to bottom, CIS ion spectrogram in the di-rection parallel (downward) to the magnetic field (panels a), PEACE electron spectrogram in the parallel and anti-parallel directions (panels b, c), electron and ion field-aligned cur-rents at the resolution of the particle distributions (panels d). Panels (e) show the components perpendicular and parallel to the local magnetic field of the FGM magnetic perturba-tions. The perpendicular component of the perturbation is di-rectly associated with the field-aligned currents and the par-allel component is a measure of the diamagnetic effect due to particle injection. The next two panels display the results of the variance analysis of the perpendicular magnetic pertur-bation. The polarisation angle (panel f), defining the direc-tion of the eigenvector associated with the largest eigenvalue, is now measured from the magnetic east, providing in addi-tion a physically meaningful direcaddi-tion of the current sheet. Panel (g) shows the variance ratio between the two largest eigenvalues. Finally, the total particle and magnetic field-aligned currents are shown on panels (h). The FACs deduced from magnetic data are calculated over 5 points (∼20 s) with vsheet= 0 only, and are not defined where the angle between
the current sheet and the spacecraft trajectory is less than 5◦. The FACs deduced from particle data are smoothed over 3 or 5 points (∼20–24 s) depending on the moment resolution, for better comparison with magnetic FACs.
5.1 Event A, sc-1 (29 August 2002 – 16:06–16:15 UT) Cluster results during event A are displayed in Fig. 2. Dur-ing this event, the IMF-Bzcomponent undergoes a sharp
in-version from negative (−5 nT) to positive (+5 nT), strongly affecting the cusp configuration around 16:11 UT, while the IMF-Bx and -By exhibit only limited variations (Bx∼5 nT;
By∼−4 nT) at this time. Prior to this inversion, between
16:08:45 and 16:09:35 UT (between the 1st and 2nd ver-tical dashed lines), sc-1 crosses the Low-Latitude Bound-ary Layer (LLBL) which is characterised by lower particle flux than in the cusp proper and displays small-scale field-aligned electron structures (panels 2 a, b, c). Sc-1 was prob-ably skimming this boundary layer before this time, since these electron field-aligned structures were intermittently ob-served from 16:06:35 UT. At 16:09:35 UT (2nd vertical dashed line), sc-1 enters the cusp proper (∼76–78◦ILAT),
indicated by intense ion and electron fluxes, with a mean en-ergy of 700 eV for the ions (panel 2a) and 100 eV for the electrons (panels 2b, 2c). The electron precipitation is con-tinuous while the ion precipitation displays two main injec-tions with relatively clear energy-time dispersions (2nd and 3rd vertical dashed lines). These dispersions are consistent with reconnection at the dayside magnetopause, in agree-ment with the negative IMF-Bzcomponent observed by ACE
before 16:11:00 UT. Indeed, newly reconnected field lines are transported anti-sunward by the magnetic tension at the reconnection site and by the solar wind flow. Since ions with decreasing energy precipitate with increasing time, disper-sions are generated by the velocity filter effect due to field line convection (Reiff et al., 1977). The convection veloc-ity deduced from ion measurements by HIA (not shown) is mainly duskward (∼30 km.s−1) in the two injections, consis-tent with expectations based on the prevailing negative IMF-By. At 16:10:50 UT, the second dispersed ion injection stops
abruptly and the electron flux also decreases significantly in response to the reversal of the IMF-Bzcomponent from
neg-ative to positive. From 16:11:45 (4th vertical dashed line) to 16:15:00 UT, a new, less intense ion injection is observed and the anti-parallel electron flux becomes more structured than that in the parallel direction, with small-scale features at low energy (down to∼10 eV). These structures are prob-ably due to changes in the polar cusp configuration, after the IMF-Bz inversion. Around 16:23:00 UT (not shown in
Fig. 2), sc-1 crosses a new cusp at higher latitudes (∼78–79◦
ILAT) which is probably associated with lobe reconnection caused by the newly-established positive IMF-Bz. This
inter-pretation of Cluster particle observations in terms of tempo-ral rather than spatial variations is confirmed by SuperDARN radar data, which show that the echoes backscattered from the cusp throat shift from 75 to 81◦ILAT, at the time of the IMF-Bzinversion. The ion and electron currents show that
Fig. 2. Cluster data for event A (sc-1, 29 August 2002). (a)CIS ion spectrogram in the direction parallel to the magnetic field;(b),(c)
PEACE electron spectrogram in the parallel and anti-parallel directions;(d)electron and ion field-aligned currents;(e)perpendicular and parallel components of the FGM magnetic field perturbation;(f)angle between the eigenvector associated with the largest eigenvalue and the local magnetic east;(g)ratio between the two largest eigenvalues;(h)total particle and magnetic field-aligned currents. The four vertical dashed lines indicate the LLBL entry, the cusp entry and the beginning of each ion injection, respectively.
upward electron field-aligned current, up to 0.9µA m−2, fol-lowed by a smaller (in amplitude and extension) downward current.
The parallel component of the magnetic perturbation re-mains small except during the main particle precipitation where it decreases to about−5 nT, showing the diamagnetic effect. The perpendicular component of the magnetic per-turbation shows small-scale variations superimposed to the
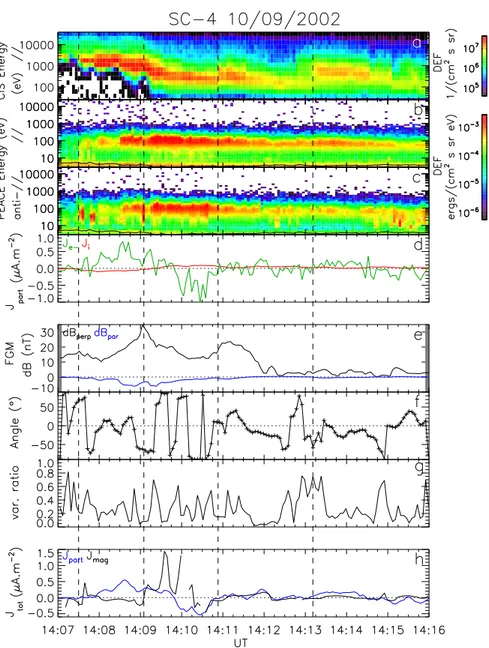
Fig. 3.Cluster data for event B (sc-4, 10 September 2002). Same format as Fig. 2.
variance ratio is also very variable during this event (panel 2g). The periods when the polarisation angle is stable show often a smaller (below 0.2) and more stable variance ratio, indicating sheet-like current structures.
For this event, the resolution of the electron moments is about 8 s and the total FACs deduced from particle data are smoothed over 24 s. The FACs thus deduced from magnetic and particle data show a similar global trend (panel 2h), even if discrepancies are observed in sign between 16:08:00 and 16:08:30 UT and between 16:10:30 and 16:10:55 UT and also in amplitude between 16:09:30 and 16:10:30 UT during the main injection.
5.2 Event B, sc-4 (10 September 2002 – 14:07–14:16 UT)
Cluster results during event B are displayed in Fig. 3. Event B occurs during a period of stable IMF-Bx and –Bz(Bx∼–
6 nT; Bz∼–5 nT) while the IMF-By increases from 0.5 to
∼2 nT, after a slightly negative period. This IMF configu-ration, with a strong negative IMF-Bz, is consistent with the
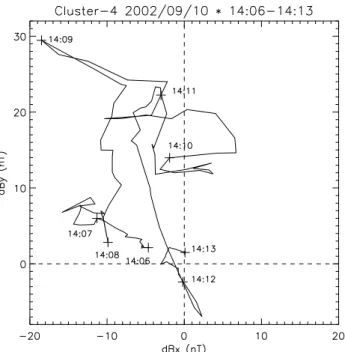
Fig. 4.Hodograph of the perpendicular component of the magnetic perturbation for the period 14:06–14:13 UT during event B (sc-4, 10 September 2002). Thexandydirections are respectively in the magnetic meridian plane and perpendicular to it.
the mean ion energy is 500 eV and the mean electron en-ergy is 100 eV. Three injections (indicated by the last three vertical dashed lines) are observed in the ion spectrogram between 14:08:30 and 14:16:00 UT (panel 3a). The first two injections have relatively clear energy-time dispersion associated again with the velocity filter effect. The injec-tions look fairly smooth in the parallel electrons (panel 3b). However, the anti-parallel electrons are more structured and show several small-scale, sporadic structures at low energy (∼20–30 eV) (panel 3c). Ion and electron fluxes during the third injection are less intense than during the previous ones. The CODIF convection velocity (not shown) is essentially duskward (∼20–30 km.s−1)during the cusp crossing, which is unusual for positive, although small IMF-By. A
dawn-ward excursion of the velocity is observed at the LLBL/cusp interface (14:07:55–14:09:05 UT). For this event, the FACs deduced from particle data are mainly carried by the elec-trons (panel 3d), with a negligible ion contribution. The part of the LLBL close to the cusp proper and the first cusp injec-tion (14:08:00–14:10:50 UT) are the regions where the most intense electron field aligned-currents are observed, first up-ward, up to 0.8µA.m−2, then downward.
The parallel component of the magnetic perturbation is slightly negative during the entire period and reaches a min-imum during the first injection (∼–7 nT). The perpendicu-lar component of the magnetic perturbation is slightly per-turbed between 14:08:00 and 14:11:00 UT, giving relatively intense small-scale magnetic FACs during the first injection
(panel 3e). The polarisation angle is fairly stable: around 0◦at the LLBL/cusp interface (14:07:55–14:08:50 UT),
os-cillating between –10◦ and –20◦ inside the second
injec-tion (14:11:35–14:12:20 UT), and oscillating between –10◦ and –30◦inside the third injection (14:13:40–14:14:45 UT) (panel 3f). On the contrary, the polarisation angle is very variable during the first injection and at the interface between the second and the third injections. The variance ratio fol-lows a similar profile, stable and below 0.2 where the angle is stable and variable and larger elsewhere, especially during the first injection (panel 3g).
For this event, the resolution of the electron moments is 4 s and the total FACs deduced from particle data are smoothed over 5 points (∼20 s). The magnetic and particle currents show a fairly similar profile in direction (panel 3h), except around the LLBL/cusp interface (14:07:55–14:09:05 UT) where the two currents are opposite in sign and during the first injection (14:09:25–14:10:15 UT) where the two cur-rents show first a large discrepancy in amplitude and are then even opposite in sign. After the first injection, the magnetic and particle currents show a better agreement, even if small amplitude discrepancies still exist.
6 Discussion
6.1 Occurrence and polarisation of current sheets and cur-rent tubes
The analysis of the two events shows that the largest currents, either tube-like or sheet-like, occur as upward-downward pairs associated with plasma injections. The variance ra-tio (panels g in Figs. 2 and 3) indicates that the percent-age of measurements with a ratio larger than 0.2 is 59% and 52% for events A and B respectively, indicating that tube-like structure are slightly predominant. Spatially per-sistent current sheets are rare. The clearest examples are the periods 16:12:20 to 16:12:50 UT during event A, 14:11:35 to 14:12:20 UT and 14:13:40 to 14:14:45 UT during event B. This result may be related to the morphology of the polar cusp aurora, characterized by rayed and fragmented arcs rather than elongated and homogeneous (Sandholt et al., 2004a, b).
14:10:00 and 14:11:00 UT are totally along thex direction. This behaviour is observed in both events, with small-scale sheets more randomly oriented than the larger ones.
6.2 Particle carriers of the field-aligned currents
Our quantitative evaluation of field-aligned currents from particle moments in the mid-altitude cusp, gives new insights into the particle carriers of the cusp currents. The pattern of the cusp field-aligned currents already described with the magnetic data (see Sect. 6.1), is confirmed by the particle data: they occur mostly as pairs of opposite currents associ-ated with plasma injections in agreement with previous mod-els and observations (Lockwood et al., 2001).
For the two events, the electron current is intense and vari-able, while the ion current is very small and smooth (panels d of Figs. 2 and 3). The average of the absolute value of the ion current is 20% of the electron current. Note that the ion current may be underestimated by a factor∼2 in event B, due to the use of the CODIF experiment which is easily sub-ject to saturation in dense plasma regions. We observe that the electron and ion currents have opposite signs during the injections (panel 3d).
In terms of particle carriers, the upward current is carried by downward electrons from the main cusp precipitation in the 50–300 eV energy range (panels b of Figs. 2 and 3). The downward current is carried by upward electrons, probably from ionospheric origin and distributed as small-scale and sporadic structures in the 10–40 eV energy range, well below the main cusp precipitation (and coexisting with it) but well above the spacecraft potential, which avoids confusion with photoelectrons (panels c of Figs. 2 and 3). Most of these up-ward low-energy electron fluxes are associated with a down-ward field-aligned current detected in the net electron current as well as in the magnetic current (panels d and h of Figs. 2 and 3). This result confirms unambiguously the particle car-riers (Burch et al., 1990) and suggests that, contrary to previ-ous satellite missions (Berko et al., 1975, and Klumpar et al., 1976), the cold ionospheric electron component is not missed by the Cluster particle detectors. The ion current is carried by the main precipitation from the LLBL in the 1–4 keV en-ergy range and from the cusp in the 0.3–2 keV enen-ergy range (panels a of Figs. 2 and 3).
6.3 Comparison between the two current determinations For both events, the particle and magnetic currents show the same general trend. Inside the injections, discrepancies are however observed both in sign and in amplitude. Outside the injections where the FACs are smaller, the agreement is fairly good in sign, even if amplitude discrepancies of the currents remain. The agreement is particularly good during event A between 16:11:20 and 16:15:00 UT and for event B between 14:10:35 UT and 14:16:00 UT.
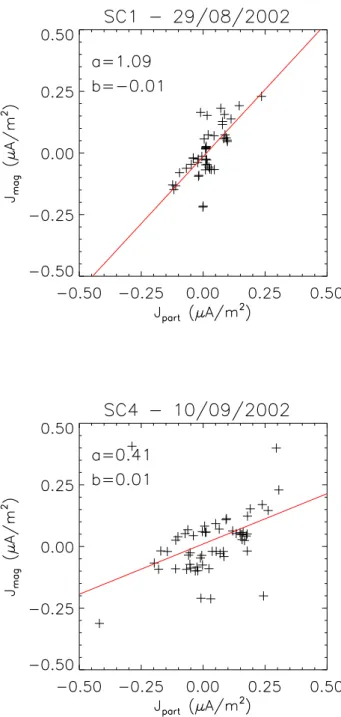
Fig. 5.Least-square linear regression fit (red line) betweenJ//part andJ//mag, withaandb: the slope and constant factor of the fit. (Top) for event A (sc-1, 29 August 2002), 16:06–16:15 UT. (Bot-tom) for event B (sc-4, 10 September 2002), 14:07–14:16 UT.
In order to assess more quantitatively the differences be-tweenJ//partandJ//mag, we calculate the least-square linear
confi-dent fit between the two data sets. Figure 5 shows the linear fit for the 2 events. For event A (top panel of Fig. 5), the ratioJ//mag/J//partis 1.09 with a nice distribution of points
along the regression line, as confirmed by a correlation coef-ficient of 0.71. We have chosen to eliminate a short period (16:10:30–16:10:55 UT), where the disagreement is obvious and which could be explained by the strong concurrent IMF-Bzinversion. For event B (bottom panel of Fig. 5), the same
ratioJ//mag/J//partis smaller, around 0.41, with a more
dis-persed distribution of points as shown by a correlation coef-ficient of 0.39 only. Again, we have chosen to eliminate the LLBL/cusp sub-interval (14:07:55–14:09:05 UT) where the disagreement is obvious, despite a low variance ratio and a stable polarisation angle. We will discuss the possible source of this discrepancy in the next section. It is important to note the absence of offset between the two data sets, as indicated by the very small constant coefficient of the linear regression. From the above regressions, we can state that the sign of the two FACs is statistically consistent. In terms of amplitude, the particle current is of the same order as the magnetic cur-rent for event A which is a very satisfactory result and larger than the magnetic current for event B by a factor∼2.4. This discrepancy for event B does not fit into measurement errors and an explanation will be suggested below.
6.4 Why do particle and magnetic currents differ?
In this section, we discuss two possible explanations to the difference between the particle and magnetic current densi-ties: the presence of Alfv´en waves and the motion of the current sheets.
Alfv´en waves can be a source of transverse magnetic fluc-tuations in addition to static parallel currents. When rela-tion (2) which is valid only for static structures is used for a wave of frequencyωand transverse wave numberk⊥, time
variations are interpreted as spatial, which leads to a current j//static=j//Alfv´en(1−ω/ k⊥V⊥)different from the real current j//Alfv´en. However, in a discussion of the origin of magnetic
fluctuations at auroral ionospheric altitudes, and based on the analysis of their correlation with electric measurements, Ishii et al. (1992) have shown that Alfv´en waves dominate the magnetic spectrum only at high frequency (periods<6 s). These short periods are smoothed out in our analysis which averages the parallel current over 20 s. This rules out an ex-planation of the observed discrepancies in terms of Alfv´en waves.
In addition to being static, the parallel current structures have been assumed stationary in the Earth reference frame. This assumption, which is valid at ionospheric altitudes, is most probably no longer satisfied at the altitude of our ob-servations. In the vicinity of its perigee, the Cluster velocity (∼4 km.s−1)may be of the same order as (or even smaller than) the convection velocity which is most likely to rep-resent the drift velocity of the current structures, either the tubes or the sheets. From relation (2), a larger (smaller)
ve-locity of the current structure with respect to the observer will reduce (increase) the magnetic current density. Because the slope of the regression line between the two evaluations of the current is unity for event A (top panel of Fig. 5), the effect of the sheet motion is negligible. The sheet velocity effect is best illustrated for event B. During the period 14:07:55– 14:09:05 UT, it is interesting to observe that the magnetic current changes sign simultaneously with a sharp step in the convection velocity measured by CIS which occurs at the in-terface between the LLBL and the cusp. A northward ve-locity of 5 km.s−1would be sufficient to adjust the magnetic to the particle current in this LLBL/cusp region, both in am-plitude and in sign. After the convection step, in the cusp region, corresponding to the correlation of the bottom panel of Fig. 5, a constant northward (parallel to the satellite orbit) component of the sheet velocity of 2.4 km.s−1 can explain the systematically smaller magnetic current density. In ad-dition, larger spatial velocity variations along the orbit can be the source of the larger variance in the regression line in event B than in event A.
7 Conclusions
We have determined field-aligned currents from magnetic field and from particle flux measurements during two cross-ings of the mid-altitude polar cusp by Cluster. Magne-tosheath plasma injections correlate well with the most in-tense pairs of field-aligned currents. By analysing the polar-isation of the magnetic field, we have shown that at medium transverse scales (80 km), the structure of the currents is more often tube-like than sheet-like, and that current sheets are not systematically elongated in the east-west direction. The analysis of particle currents has shown that the parallel current is mainly carried by electrons. In the plane current sheets, the quantitative comparison between the two deter-minations of the parallel current density shows that the mag-netic current is of the same order or smaller than the particle current. We suggest that current sheet motions are the source of this discrepancy.
Acknowledgements. The authors thank D. Fontaine for useful
discussions. The authors thank the PIs H. R`eme and E. Lucek for providing the CIS and the FGM Cluster data respectively. The authors thank also P. D´ecr´eau (PI of the WHISPER experiment) and X. Valli`eres for providing the electron density deduced from the WHISPER data. The authors acknowledge the PIs N. Ness and D. J. McComas, and the ACE Science Center for providing the ACE data.
Topical Editor I. A. Daglis thanks J. Wild and P. E. Sandholt for their help in evaluating this paper.
References
K.-H., Harris, J., Musmann, G., Oddy, T., and Schwingenschuh, K.: The CLUSTER Magnetic Field Investigation: overview of in-flight performance and initial results, Ann. Geophys., 19, 1207– 1217, 2001,
http://www.ann-geophys.net/19/1207/2001/.
Berko, F. W., Hoffman, R. A., Burton, R. K., and Holzer, R. E.: Simultaneous particle and field observations of field-aligned cur-rents, J. Geophys. Res., 80, 37–46, 1975.
Berthelier, J.-J., Cerisier, J.-C., Machard, C., Berthelier, A., and Bosqued, J.-M.: ULF electromagnetic turbulence in the high lati-tude topside ionosphere, J. Geophys. Res., 93, 5701–5712, 1988. Burch, J. L., Reiff, P. H., and Sugiura, M.: Upward electron beams measured by DE-1: a primary source of dayside region-1 birke-land currents, Geophys. Res. Lett., 10, 753–756, 1983.
Burch, J. L., Menetti, J. D., and Slavin, J. A.: Dayside auroral par-ticle acceleration mechanisms derived from Dynamics Explorer data, J. Geomag. Geoelectr., 42, 1365–1378, 1990.
Burke, W. J., Electric fields and currents observed by S3-2 in the vicinity of discrete arcs, Geophys. Monogr. Ser., 28, edited by: T. A. Potemra, 294–303, AGU, Washington, D. C., 1984. Elphic, R. C., Bonnell, J. W., Strangeway, R. J., Keko, L., Ergun,
R. E., McFadden, J. P., Carlson, C. W., Peria, W., Cattell, C. A., Klumpar, D., Shelley, E., Peterson, W., Moebius, E., Kistler, L., and Pfaff, R.: The auroral current circuit and field-aligned currents observed by FAST, Geophys. Res. Lett., 25, 2033–2036, 1998.
Erlandson, R. E., Zanetti, L. J., Potemra, T. A., Bythrow, P. F., and Lundin, R.: IMF B(y) dependence of region 1 Birkeland currents near noon, J. Geophys. Res., 93, 9804–9814, 1988.
Escoubet, C. P., Smith, M. F., Fung, S. F., Anderson, P. C., Hoff-man, R. A., Basinska, E. M., and Bosqued, J.-M.: Staircase ion signature in the polar cusp–A case study, Geophys. Res. Lett., 19, 1735–1738, 1992.
Fung, S. F., and Hoffman, R. A.: Finite geometry effects of field-aligned currents, J. Geophys. Res., 97, 8569–8579, 1992. Hoffman, R. A., Sugiura, M., and Maynard, N. C.: Current carriers
for the field-aligned current system, Adv. Space Res., 5, 109– 126, 1985.
Iijima, T., Potemra, T. A., Zanetti, L. J., and Bythrow, P. F.: Large-scale Birkeland currents in the dayside polar region dur-ing strongly northward IMF - A new Birkeland current system, J. Geophys. Res., 89, 7441–7452, 1984.
Iijima, T. and Potemra, T. A.: Field-aligned currents in the dayside cusp observed by Triad, J. Geophys. Res., 81, 5971–5979, 1976. Ishii, M., Sugiura, M., Iyemori, T., and Slavin, J. A.: Correlation between magnetic and electric field perturbations in the field-aligned current regions deduced from DE-2 observations, J. Geo-phys. Res., 97, 13 877–13 887, 1992.
Johnstone, A. D., Alsop, C., Burge, S., et al.: ‘PEACE: a Plasma electron and current experiment’, Space Sci. Rev., 79, 351–398, 1997.
Klumpar, D. M.: Relationships between auroral particle distri-butions and magnetic field perturbations associated with field-aligned currents, J. Geophys. Res., 84, 6524–6532, 1979. Klumpar, D. M., Burrows, J. R., and Wilson, M. D.: Simultaneous
observations of field-aligned currents and particle fluxes, Geo-phys. Res. Lett., 3, 395–398, 1976.
Lockwood, M., Milan, S. E., Onsager, T., Perry, C. H., Scudder, J. A., Russell, C. T., and Brittnacher, M.: Cusp ion steps,
field-aligned currents and poleward moving auroral forms, J. Geophys. Res., 106, 29 555–29 569, 2001.
Marchaudon, A., Cerisier, J.-C., Greenwald, R., and Sofko, G.: Electrodynamics of a FTE: Experimental test of the Southwood model, Geophys. Res. Lett., 31, doi:10.1029/2004GL019922, 2004.
McDiarmid, D. R. and McNamara, A. G.: Radio aurora in the day-side auroral oval spatial relationships with field-aligned currents and energetic particles, J. Geophys. Res., 83, 3226–3234, 1978. Oksavik, K., Søraas, F., Moen, J., Pfaff, R., Davies, J. A., and
Lester, M.: Simultaneous optical, CUTLAS HF radar, and FAST spacecraft observations: signatures of boundary layer processes in the cusp, Ann. Geophys., 22, 511–525, 2004,
http://www.ann-geophys.net/22/511/2004/.
Potemra, T. A.: Field-aligned (Birkeland) currents, Space Sci. Rev., 42, 295–311, 1985.
Potemra, T. A., Peterson, W. K., Doering, J. P., Bostrom, C. O., McEntire, R. W., and Hoffman, R. A.: Low-energy particle ob-servations in the quiet dayside cusp from AE-C and AE-D, J. Geophys. Res., 82, 4765–4776, 1977.
Reiff, P. H., Burch, J. L., and Hill, T. W.: Solar wind plasma injec-tions at the dayside magnetospheric cusp, J. Geophys. Res., 82, 479–491, 1977.
R`eme H., Aoustin, C., Bosqued, J.-M., et al.: First multispacecraft ion measurements in and near the Earth’s magnetosphere with the identical Cluster ion spectrometry (CIS) experiment, Ann. Geophys., 19, 1303–1354, 2001,
http://www.ann-geophys.net/19/1303/2001/.
Robert, P. R., Gendrin, R., Perraut, S., Roux, A., and Pedersen, A.: GEOS-2 identification of rapidly moving current structures in the equatorial outer magnetosphere, J. Geophys. Res., 89, 819–840, 1984.
Sandholt, P. E., Farrugia, C. J., and Denig, W. F.: Dayside aurora and the role of IMF|By/Bz|: detailed morphology and response to magnetopause reconnection, Ann. Geophys., 22, 613–628, 2004a.
Sandholt, P. E., Farrugia, C. J., and Denig, W. F.: Detailed day-side auroral morphology as a function of local time for southeast IMF orientation: implications for solar wind - magnetosphere coupling, Ann. Geophys., 22, 3537–3560, 2004b.
Seran, E., and Cerisier, J.-C.: Current layers: Influence of the fi-nite size and non-uniform current distribution, J. Atmos. Solar-Terrestr. Phys., 67, 729–737, 2005.
Southwood, D. J.: The ionospheric signature of flux transfer events, J. Geophys. Res., 92, 3207–3213, 1987.
Sugiura, M., Iyemori, T., Hoffman, R. A., Maynard, N. C., Burch, J. L., and Winningham, J. D.: Relationships between field-aligned currents, electric fields, and particle precipitation as observed by Dynamics Explorer-2, in: Magnetospheric Currents, Geophys. Monogr. Ser., 28, edited by: Thomas, A., Potemra, 96–103, AGU, Washington, D. C., 1984.
Theile, B. and Wilhelm, K.: Field-aligned currents above an auroral arc, Planet. Space Sci., 28, 351–355, 1980.