ACPD
9, 1489–1520, 2009Differences in cloud properties observed
by MODIS
N. Meskhidze et al.
Title Page
Abstract Introduction
Conclusions References
Tables Figures
◭ ◮
◭ ◮
Back Close
Full Screen / Esc
Printer-friendly Version
Interactive Discussion
Atmos. Chem. Phys. Discuss., 9, 1489–1520, 2009 www.atmos-chem-phys-discuss.net/9/1489/2009/ © Author(s) 2009. This work is distributed under the Creative Commons Attribution 3.0 License.
Atmospheric Chemistry and Physics Discussions
This discussion paper is/has been under review for the journalAtmospheric Chemistry
and Physics (ACP). Please refer to the corresponding final paper inACPif available.
Exploring the di
ff
erences in cloud
properties observed by the Terra and
Aqua MODIS sensors
N. Meskhidze1, L. A. Remer2, S. Platnick2, R. Negr ´on Ju ´arez3, A. M. Lichtenberger1, and A. R. Aiyyer1
1
Marine Earth and Atmospheric Sciences, North Carolina State University, Raleigh, NC 27695, USA
2
NASA Goddard Space Flight Center, Greenbelt, MD 20771, USA
3
Ecology and Evolutionary Biology, Tulane University, New Orleans, LA 70118, USA
Received: 4 November 2008 – Accepted: 1 December 2008 – Published: 16 January 2009
Correspondence to: N. Meskhidze ([email protected])
ACPD
9, 1489–1520, 2009Differences in cloud properties observed
by MODIS
N. Meskhidze et al.
Title Page
Abstract Introduction
Conclusions References
Tables Figures
◭ ◮
◭ ◮
Back Close
Full Screen / Esc
Printer-friendly Version
Interactive Discussion
Abstract
The aerosol-cloud interaction in different parts of the globe is examined here using multi-year statistics of remotely sensed data from two MODIS sensors aboard NASA’s
Terra (morning) and Aqua (afternoon) satellites. Simultaneous retrievals of aerosol
loadings and cloud properties by the MODIS sensor allowed us to explore intra-diurnal
5
variation of liquid cloud fraction (CF) and optical thickness (COT) for clean, moderately polluted and heavily polluted clouds in different seasons. Data analysis for six-years of MODIS retrievals revealed strong temporal and spatial patterns in intra-diurnal vari-ation of cloud fraction and optical thickness over different parts of the global oceans and the land. For the vast areas of stratocumulus cloud regions, the data shows
10
that the presence of aerosols can more than double afternoon reduction of CF and COT pointing to the possible predominance of semi-direct over the indirect effects of aerosols in stratocumulus clouds. A positive relationship between AOD and morning-to-afternoon variation of trade wind cumulus cloud cover was also found over the north-ern Indian Ocean, though no clear correlation between the concentration of Indo-Asian
15
haze and intra-diurnal variation of COT was established. Over the Amazon region during wet conditions, aerosols are associated with an enhanced convective process in which morning shallow warm clouds are organized into afternoon deep convection with greater ice cloud coverage. Analysis presented here demonstrates that the new technique for exploring intra-diurnal variability in cloud properties by using the diff
er-20
ences in data products from the two daily MODIS overpasses is capable of capturing some of the major features of morning-to-afternoon variations in cloud properties and can be used for improved understanding of aerosol radiative effects.
1 Introduction
It is now well documented that anthropogenic aerosols can alter cloud microphysical
25
bud-ACPD
9, 1489–1520, 2009Differences in cloud properties observed
by MODIS
N. Meskhidze et al.
Title Page
Abstract Introduction
Conclusions References
Tables Figures
◭ ◮
◭ ◮
Back Close
Full Screen / Esc
Printer-friendly Version
Interactive Discussion
get and climate (Ackerman et al., 2000; Ramanathan et al., 2001; Schwartz et al., 2002; Rosenfeld et al., 2002; Andreae et al., 2004; Penner et al., 2004; Kaufman et al., 2005a; Koren et al., 2004, 2005). An increase in cloud condensation nuclei (CCN) number concentration from anthropogenic aerosols was shown to yield a higher number of cloud droplets that, for fixed liquid water path (LWP), may lead to a
re-5
duced droplet size and thereby enhanced reflectance of solar radiation. This is the so-called first indirect effect of anthropogenic aerosols (Twomey, 1977; Kaufman and Fraser, 1997; Br ´eon et al., 2002; Feingold et al., 2003). Reduction of cloud droplet size may also inhibit precipitation and increase cloud lifetime, the second indirect ef-fect (Albrecht, 1989; Rosenfeld, 1999, 2000). Furthermore, recent studies have shown
10
that absorbing aerosols, e.g., black carbon and dust can affect clouds semi-directly by evaporating existing cloud droplets through solar (shortwave) absorption and inhibiting cloud formation through suppression of the convection in the boundary layer (Acker-man et al., 2000; Johnson et al., 2004; Erlick and Schlesinger, 2008). Recently Koren et al. (2008) using results from the Amazon basin developed a theoretical basis for the
15
opposing effect of aerosols on clouds: the microphysical (i.e., indirect) and the radia-tive (i.e., semi-direct). Elucidation of the effects of natural and anthropogenic aerosols on clouds and analysis of these variations in space and time is crucial for improved understanding and predicting climate change (Forest et al., 2002; Knutti et al., 2002; Anderson et al., 2003).
20
Today, the relative importance of indirect and semi-direct effects in the Earth’s en-ergy budget and hydrological cycle remain poorly quantified and therefore our ability to represent these effects in global models is hampered. It is necessary to seek more knowledge of aerosol-cloud interaction using remotely sensed data and in-situ obser-vations. Satellite platforms have been widely used for characterization of cloud
micro-25
ACPD
9, 1489–1520, 2009Differences in cloud properties observed
by MODIS
N. Meskhidze et al.
Title Page
Abstract Introduction
Conclusions References
Tables Figures
◭ ◮
◭ ◮
Back Close
Full Screen / Esc
Printer-friendly Version
Interactive Discussion
Ocean (Kaufman et al., 2005a; Koren et al., 2005) and Europe (Devasthale et al., 2005). It was also shown, that heavy smoke over the Amazon forest (Koren et al., 2004; Feingold et al., 2005) and pollution over China (Kr ¨uger and Graßl, 2004) decrease the cloud cover by heating the atmosphere and cooling the surface. However, the global description of aerosol influence on cloud development using satellite data still remains
5
a challenging task. Current geostationary satellites that give information on cloud tem-poral development, suffer from spatial limitations. Polar orbiting satellites provide global coverage but only give a snapshot of clouds and therefore are difficult to use to charac-terize the effect of aerosols on cloud development. In addition, both clouds and aerosol may be correlated; they may both depend on synoptic and mesoscale weather systems
10
in which case relationships between cloud microphysical parameters and aerosol op-tical depth (AOD) become highly complicated. Cloud contamination may also cause a false relationship between the retrievals of cloud properties and AOD (Kaufman et al., 2005b; Brennan et al., 2005).
In this study, the two Moderate Resolution Imaging Spectroradiometer (MODIS)
sen-15
sors aboard NASA’sTerra and Aqua satellites are used for characterization of cloud development and identification of processes affecting cloud formation. With 3 h diff er-ences in equatorial crossing times (10:30 a.m. forTerraand 01:30 p.m. forAqua), the MODIS sensors offer an unprecedented opportunity to study the intra-diurnal variability of cloud properties and the effect of different processes on cloud development in
dif-20
ferent parts of the globe. In addition to cloud fraction, cloud-top temperature and pres-sure, effective radius, optical thickness and the thermodynamic cloud phase, MODIS also provides systematic and accurate information on AOD and the contribution to the optical thickness by the fine mode (Tanr ´e et al., 1997; King et al., 1999, 2003; Remer et al., 2005). Therefore the combination of the MODIS instruments can be used to study
25
ACPD
9, 1489–1520, 2009Differences in cloud properties observed
by MODIS
N. Meskhidze et al.
Title Page
Abstract Introduction
Conclusions References
Tables Figures
◭ ◮
◭ ◮
Back Close
Full Screen / Esc
Printer-friendly Version
Interactive Discussion
2 Data and methodology
In this study we use the MODIS Collection 5 (C5) Level-3 global daily gridded products averaged at 1◦×1◦(longitude and latitude) resolution. The C5 data is generated using recently updated operational cloud and aerosol retrieval algorithms and is the most up to date dataset available for the MODIS retrievals (Hubanks et al., 2008). MODIS
5
measures radiances in 36 spectral bands from 0.4 to 14.24µm and has a swath width of
2330 km. The spatial resolution at nadir has the following ranges: 250 m (2 channels), 500 m (5 channels), and 1 km (29 channels). The aerosol retrieval makes use of the first seven of these channels (0.47–2.13µm) while additional wavelengths in other parts of
the spectrum are used to identify cloud properties and ocean products (Esaias et al.,
10
1998; Platnick et al., 2003; Remer et al., 2005). MODIS daily mean for AOD and quality assured (QA)-weighted means for liquid cloud products (cloud retrieval fraction, CF, and optical thickness, COT) from July 2002 to December 2007 are used in the present analysis. Only the data with available retrievals from both Terra and Aqua
satellite sensors are used in the analysis.
15
To quantify the effects of aerosols on the evolution of warm clouds we examine morning-to-afternoon variation of CF and COT in association with the abundance of aerosols. Intra-diurnal variation of cloud properties is captured by subtracting
MODISAqua data products (MOD08 D3) from corresponding MODISTerra retrievals
(MYD08 D3). This method is similar to one used by Han et al. (1994) to quantify
20
morning-to-afternoon contrast in cloud effective radii and optical thickness. Due to the relatively short time scale between MODIS overpasses (∼3 h) such a procedure can be viewed as a high pass temporal filter largely removing the effects of synoptic and the large scale processes. Furthermore, since the results shown here represent averages over 6 years, it is anticipated that synoptic and mesoscale variability – which can be
25
surro-ACPD
9, 1489–1520, 2009Differences in cloud properties observed
by MODIS
N. Meskhidze et al.
Title Page
Abstract Introduction
Conclusions References
Tables Figures
◭ ◮
◭ ◮
Back Close
Full Screen / Esc
Printer-friendly Version
Interactive Discussion
gate for the concentration of aerosols that interact with the cloud affecting its short-term variation and properties. The relationship between aerosol concentration and the intra-diurnal variation in cloud properties is explored by separating morning-to-afternoon differences in cloud properties into three broad categories based on MODIS retrieved AOD values from the Terra satellite. The episodes with AOD<0.1 are quantified as 5
“clean”, 0.1≤AOD≤0.25 are considered as “moderately polluted” and 0.25<AOD≤0.8 is treated as “heavily polluted”. Data with AOD>0.8 were removed from the analysis
to avoid misclassification of clouds and aerosols under high-AOD conditions (Brennan et al., 2005). The AOT≈0.25 is used here as a transitional value between moderately and heavily polluted regimes in accordance to the recent observations for the optimal
10
cloud development (Koren et al., 2008; Rosenfeld et al., 2008). To factor out potential dynamical and other local effects, the data are further stratified by typical cloud types (stratocumulus and trade cumulus) and locations (ocean and land). Although MODIS measures the aerosol optical thickness in cloud-free (sun-glint-free) conditions, simul-taneous observations of aerosols in cloud-free regions of the grid box and clouds in the
15
cloudy regions of the grid box are possible (Kaufman et al., 2005a). If the grid box is completely covered by the clouds and no AOD retrievals are available, we use an av-erage of AOD data from the surrounding 1◦resolution boxes. Since aerosol correlation length is∼100 km (and could be as large as 400 km in areas far away from the source) (Anderson et al., 2003), such treatment should not lead to significant errors in AOD
20
values for a given pixel. When no AOD data is available for any of the surrounding grid points, cloud products for a given grid box are removed from the analysis.
For a study in which multiple satellite sensors are employed it is crucial to correctly estimate cross-platform agreement and accuracy. The two MODIS instruments and the algorithms applied to the MODIS-measured radiances for both aerosols and clouds are
25
ge-ACPD
9, 1489–1520, 2009Differences in cloud properties observed
by MODIS
N. Meskhidze et al.
Title Page
Abstract Introduction
Conclusions References
Tables Figures
◭ ◮
◭ ◮
Back Close
Full Screen / Esc
Printer-friendly Version
Interactive Discussion
ometries and subsequent retrievals (Platnick et al., 2003). Despite this, there are no known large uncertainties or biases in cloud properties retrieved by the two MODIS sensors. Spurious biases and unrealistic skewness that may still be associated with few individual measurements are avoided in this study by examining very large num-ber of MODIS retrievals and looking at the average seasonal patterns in intra-diurnal
5
variation of different cloud parameters. Pixels with less than 5% of available data were also removed from the analysis.
3 Cloud properties
Here we analyze geographical and seasonal distributions of morning-to-afternoon dif-ferences of warm (liquid) cloud optical and microphysical properties observed by the
10
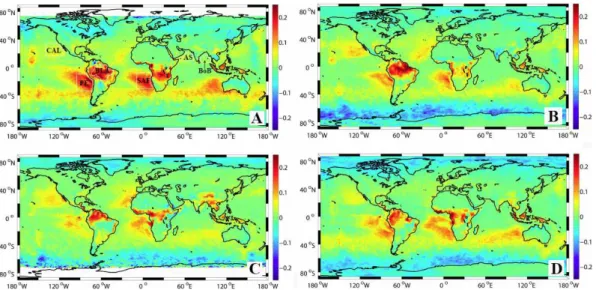
MODIS sensors. We examine intra-diurnal variations in CF and COT for four different seasons: boreal winter (DJF), spring (MAM), summer (JJA) and fall (SON). To cap-ture possible effects of aerosols on intra-diurnal variation of cloud properties separate analyses are carried out for clean, moderately polluted and heavily polluted cases. Figures 1 and 2 show that the major morning-to-afternoon variations in CF and COT
15
are observed over subtropical oceans and the three largest rainforests – the American, African, and Asian. Since cloud formation over the oceans and continents is influenced by different dynamic processes, intra-diurnal variation of clouds are considered sepa-rately in three stratocumulus cloud regions over cool subtropical waters off the coast of California (CAL), Peru (PE), and southern Africa (SAF), two trade wind cumuli
re-20
ACPD
9, 1489–1520, 2009Differences in cloud properties observed
by MODIS
N. Meskhidze et al.
Title Page
Abstract Introduction
Conclusions References
Tables Figures
◭ ◮
◭ ◮
Back Close
Full Screen / Esc
Printer-friendly Version
Interactive Discussion
3.1 Over the oceans
3.1.1 Stratocumulus clouds
Marine stratocumulus clouds occur over extensive areas of the extratropical oceans and play a central role in the global energy budget. Because these clouds have a powerful influence on the radiation budget primarily through their albedo, the diurnal
5
cycle of their radiative properties may have global consequences (Rozendaal et al., 1995). As the factors that regulate the reflectivity of low-level marine stratocumulus can critically affect the climate system as a whole (e.g., Randall et al., 1984; Stevens et al., 2005), it is important to understand the processes that control the intra-diurnal variation of stratocumulus coverage and optical thickness, and the possible effect of
10
aerosols on modification of cloud properties.
Figure 1 demonstrates significant morning-to-afternoon reductions (i.e.,Terra-Aqua, warm colors on the figure) in cloud cover over marine stratocumulus regions off the coast of California, Peru, and southern Africa. Such decreases in afternoon cloud cover is consistent with the previous reports showing that the largest cover for
stra-15
tocumulus clouds is typically reached early in the morning (∼06:00 LT) and decreases to a minimum value around 17:00 LT (Minnis et al., 1992; Rozendaal et al., 1995). Measured summertime (30 June–19 July) morning minus afternoon changes in CF be-tween 10:00 LT and 13:00 LT offthe coast of California in the vicinity of San Nicholas Island (SNI) were ∼0.15 to 0.2 (Minnis et al., 1992). This is in a good agreement 20
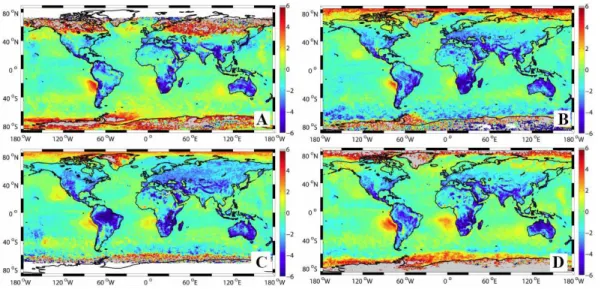
with the intra-diurnal variation in CF over stratocumulus topped boundary layers off the coast of California observed by the two MODIS sensors (Fig. 1c). Considerable morning-to-afternoon decreases in COT (Fig. 2) for selected stratocumulus regions are also consistent with the previous reports (Minnis et al., 1992), suggesting that the two MODIS sensors are capable of capturing intra-diurnal variation of cloud properties
25
ACPD
9, 1489–1520, 2009Differences in cloud properties observed
by MODIS
N. Meskhidze et al.
Title Page
Abstract Introduction
Conclusions References
Tables Figures
◭ ◮
◭ ◮
Back Close
Full Screen / Esc
Printer-friendly Version
Interactive Discussion
The morning-to-afternoon variation of stratocumulus cloud coverage has been de-scribed previously and was suggested that it should be viewed as a typical property of this cloud type in the subtropics (e.g., Minnis et al., 1992). Previous studies high-lighted the importance of shortwave heating of the cloud layer relative to the longwave radiative cooling at the cloud top. It was shown that intense afternoon solar heating of
5
marine stratocumulus clouds may cause decoupling of cloud and sub-cloud layers and promote entrainment, leading to reduction in liquid water path and even evaporation of the entire cloud layer (Rogers and Kora ´ein, 1992). However, it was also shown, that “continentally influenced marine” clouds can absorb nearly twice the amount of solar radiation and have 2–4% lower albedo compared to clean marine clouds (Erlick et al.,
10
2001). Year-round retrievals of aerosol and cloud properties by the MODIS sensors allow us to further explore the intra-diurnal variation of stratocumulus cloud properties segregated by aerosol loadings and seasonality. Such analysis cannot resolve all the conceivable issues associated with aerosol-cloud interaction; though, the large number of remotely sensed data involving many different climatic and weather conditions will
15
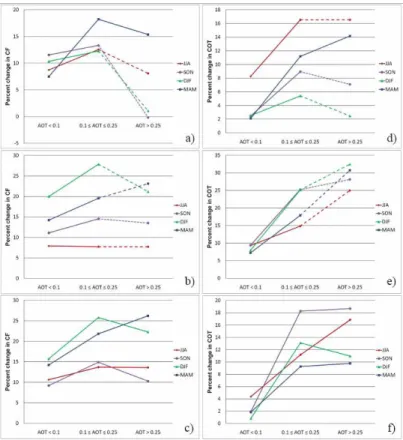
likely reveal some of the main effects of aerosols on the short-term variation of clouds. Figure 3 examines the relationship between AOD and intra-diurnal varia-tion of marine stratocumulus cloud coverage and optical thickness for dif-ferent seasons in three selected stratocumulus cloud regions CAL, PE and SAF. As CF and COT may themselves depend on seasonality (auxiliary
ma-20
terial Fig. S1 and S2: http://www.atmos-chem-phys-discuss.net/9/1489/2009/
acpd-9-1489-2009-supplement.pdf) on Fig. 3 we plot morning-to-afternoon changes in CF and COT relative to their value in the morning (from theTerrasatellite). It should be noted that cloud contamination of aerosol retrievals (particularly for higher AOD sam-ples) has been discussed in the literature (Kaufman et al., 2005b) and could potentially
25
ACPD
9, 1489–1520, 2009Differences in cloud properties observed
by MODIS
N. Meskhidze et al.
Title Page
Abstract Introduction
Conclusions References
Tables Figures
◭ ◮
◭ ◮
Back Close
Full Screen / Esc
Printer-friendly Version
Interactive Discussion
with higher AOD (auxiliary material Fig. S3: http://www.atmos-chem-phys-discuss.net/
9/1489/2009/acpd-9-1489-2009-supplement.pdf). Therefore, correlations between
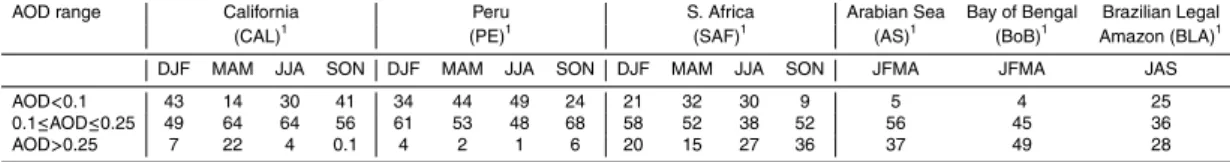
morning-to-afternoon changes in CF and COT, and AOD (Fig. 3) are likely to be real an indication for the effect of aerosols on intra-diurnal cycle of stratocumulus clouds. In order to estimate overall importance of each regime on cloud properties, in Table 1 we
5
show fraction of time, when out of all six years of available data, clouds were classified as clean, moderately and heavily polluted based on the remotely sensed AOD values. This table shows that with the exception of the spring season, clouds offthe coast of California and Peru are classified as clean or moderately polluted, while stratocumulus clouds off the coast of southern Africa are largely moderately polluted with the equal
10
amount of time shared between clean and heavily polluted regimes. Figure 3 shows that for the clean clouds (AOD<0.1) there is∼10 to 15% reduction in afternoon cloudi-ness and 5 to 10% in afternoon optical thickcloudi-ness (positive Terra-Aqua differences). Such changes could perhaps be viewed as a typical intra-diurnal variation of stra-tocumulus cloud properties under the clean background conditions. However, Fig. 3
15
also shows that transition of stratocumulus clouds from clean to moderately polluted case over the selected regions is always associated with the enhancement of after-noon “burn-off” (increasedTerra-Aquadifferences). Figure 3 shows that in moderately polluted case, within 3 h differences of MODIS crossing times, CF and COT can be reduced by 20 to 30% of their morning values. This reduction is twice as large as one
20
observed under the clean conditions. Observed connection between AOD and intra-diurnal variation of CF and COT could be a consequence of two opposing effects of aerosols on clouds: the microphysical and radiative. Increase in aerosol loadings in these moderately polluted clouds favors semi-direct effects associated with absorbing aerosols, leading to the net reduction of cloud coverage and optical thickness.
Fig-25
ACPD
9, 1489–1520, 2009Differences in cloud properties observed
by MODIS
N. Meskhidze et al.
Title Page
Abstract Introduction
Conclusions References
Tables Figures
◭ ◮
◭ ◮
Back Close
Full Screen / Esc
Printer-friendly Version
Interactive Discussion
advected aloft, above the stratus deck, without interacting with the clouds below (e.g., Husar et al., 2001; Ginoux et al., 2001). In general, Fig. 3 and Table 1 indicate the predominance of semi-direct over indirect effects of aerosols for the selected stratocu-mulus clouds under a wide range of climatological conditions and aerosol loadings.
There are several additional factors that could contribute to the observed changes
5
in the aerosol-cloud relationship over the selected stratocumulus cloud regions. Fig-ure 3 shows that for a given change in aerosol abundance, intra-diurnal variation of CF and COT may also depend on seasonality. Seasonal variation of mesoscale climato-logical parameters, sea surface temperature (SST), and aerosol chemical composition should be considered for comprehensive characterization of intra-diurnal variation of
10
stratocumulus clouds in selected regions.
3.1.2 Trade wind cumulus clouds
Possible relationships between AOD and trade wind cumulus cloud coverage and opti-cal thickness are examined over the AS and the BoB region. This part of the northern Indian Ocean was chosen for the analysis because it is often subjected to heavy
air-15
pollution with a large fraction of absorbing black carbon aerosols (Ramanathan et al., 2001). This Indo-Asian haze could lead to a considerable reduction in afternoon cloud cover and decrease in aerosol-induced radiative cooling at the top of the atmosphere on a regional scale (Ackerman et al., 2000). Through their effect on clouds, these ab-sorbing aerosols may influence the hydrological cycle, regional precipitation and even
20
large scale atmospheric circulations (Ramanathan et al., 2001). The added importance of this oceanic region is that it borders rapidly developing nations with the potential for large future increases in heavy pollution.
Observational and modeling studies for the time series of trade cumulus cloud cover-age suggest that, similar to stratocumulus clouds, there is a natural diurnal variation in
25
ACPD
9, 1489–1520, 2009Differences in cloud properties observed
by MODIS
N. Meskhidze et al.
Title Page
Abstract Introduction
Conclusions References
Tables Figures
◭ ◮
◭ ◮
Back Close
Full Screen / Esc
Printer-friendly Version
Interactive Discussion
1982). Compared to stratocumulus clouds, the observed morning-to-afternoon diff er-ences in cloud coverage for trade wind cumulus regime are smaller, typically between 0.1–0.15 (Brill and Albrecht, 1982). Such variations in cloud cover primarily occur due to diurnal changes in the radiative forcing that could be strongly amplified by absorbing aerosols (Brill and Albrecht, 1982; Ackerman et al., 2000; Johnson, 2005).
5
To assess the effect of Indo-Asian haze on trade cumulus clouds on Figs. 4 and 5 we plot intra-diurnal variations of CF and COT andTerra satellite retreived AOD over the northern Indian Ocean during January–April season (JFMA). According to Table 1 during this time clouds over AS and BoB are primarily classified as moderately or heavily polluted. Over the northern Indian Ocean, JFMA is the time for the northeast
10
(NE) monsoon during which prevailing low-level winds flow from the heavily polluted land bringing a thick haze layer over most of the AS and BoB (Ramanathan et al., 2001; Ramachandran and Jayaraman, 2002). The air masses in the northern part of the AS originate primarily from Saudi Arabia, Iran and Afghanistan, while over the southern AS the outflow occurs primarily from the Indian subcontinent (Rasch et al.,
15
2001; Lelieveld et al., 2001). Over BoB, the highest concentration of aerosols is ob-served near the Indian subcontinent in the pathway by which smog drifts down India’s populous Ganges valley and out into the Bay of Bengal (Lelieveld et al., 2001). This source of “atmospheric brown clouds” is advected over the Indian Ocean at altitudes between 1 and 3 km (Lelieveld et al., 2001; Ramanathan et al., 2007) and has an ample
20
opportunity to interact with cumulus clouds in the region. Figure 4 shows that the intra-diurnal differences in CF during the JFMA period are well correlated with AODs and their outflow channels in the region (Fig. 4d). This result is in agreement with previous findings (e.g., McFarquhar et al., 2004) suggesting the dominance of semidirect over indirect effect of the Indo-Asian haze. Unlike cloud fraction, there is no clear
relation-25
ACPD
9, 1489–1520, 2009Differences in cloud properties observed
by MODIS
N. Meskhidze et al.
Title Page
Abstract Introduction
Conclusions References
Tables Figures
◭ ◮
◭ ◮
Back Close
Full Screen / Esc
Printer-friendly Version
Interactive Discussion
clouds in northern Indian Ocean may consider separation of clean and polluted clouds by cloud dimensions. Heavily polluted clouds typically are more numerous but have smaller horizontal dimension (Xue et al., 2008). Satellite retrievals of COT for clean and heavily polluted trade cumulus clouds were shown to be almost indistinguishable for the cloud diameters less than 1 km (McFarquhar et al., 2004). Semidirect effect of
5
aerosol on shallow cumulus clouds was also proposed to be very different for buoyant or “active” clouds that convect freely through the boundary layer and “passive” clouds that have diverged upon reaching the inversion (Johnson, 2005).
3.2 Over the land
It is significantly harder to interpret intra-diurnal variation cloud properties over land,
10
since dynamic processes such as variation of boundary layer height, or local topogra-phy can easily influence cloud microtopogra-physical properties within the narrow time window of the two MODIS sensor overpasses. Nonetheless, looking at Figs. 1 and 2, some of the spatial patterns become evident. Over most of the low-latitude continental regions (excluding the tropical rain forests) Figs. 1 and 2 show slightly negative values (or no
15
change) for intra-diurnal variation of CF and larger negative values for COT. This is mainly due to the initiation of natural convection that, compared to mostly cloud free skies in the morning, brings more clouds in the afternoon. Over the high latitudes, Figs. 1 and 2 show near neutral intra-diurnal variation for cloud fraction and negative values for COT, indicating that in these regions Terra overpass retrieves some late
20
morning clouds that deepen through the afternoon (Aquaoverpass) without significant changes in their horizontal extent. Figures 1 and 2 also show that intra-diurnal vari-ations in CF over the three largest rainforests – the American, the African, and the Asian are very different from the rest of the land regions. The intra-diurnal variability in cloud cover and optical thickness and their possible relationship to AOD over the
25
ACPD
9, 1489–1520, 2009Differences in cloud properties observed
by MODIS
N. Meskhidze et al.
Title Page
Abstract Introduction
Conclusions References
Tables Figures
◭ ◮
◭ ◮
Back Close
Full Screen / Esc
Printer-friendly Version
Interactive Discussion
3.2.1 The Amazon region
The climate and circulation of the tropical Americas and the behavior of clouds and precipitation in the Amazon region have been investigated in a series of research pa-pers (Greco et al., 1990; Garstang et al., 1994). The importance of diurnal convective forcing over the Amazon region was noted in observational studies (Foltz and Gray,
5
1979) and model results (Silva Dias et al., 1983, 1987). Figures 1 and 2 demon-strate large changes in intra-diurnal variation of CF and COT over the Amazon during the seasons of transition from wet to dry. Over the Amazon region the wet season is typically defined as November–May, while the dry season is from July to October. However, this definition of wet and dry seasons is not exact, as the onset of rain and
10
amount of precipitation varies considerably over the different regions of the Amazon; e.g., the northwestern part of the region is located in the path of seasonal migration of the convective activity and has almost no dry season (Machado et al., 2004).
Under natural (clean) conditions typically observed during the rainy season, con-vection increases in the afternoon. This concon-vection organizes not from the
cloud-15
free skies but rather from the wide-spread small clouds with high cloud fraction
and low COT that are prevalent in the morning (Vera et al., 2006). During the
rainy season the minimum cloud cover occurs only a few hours before the maxi-mum precipitation in the early afternoon, whereas maximaxi-mum cloud cover occurs at night (Machado et al., 2002; Vera et al., 2006). During the afternoon, strong
con-20
vective elements develop with low cloud fraction and large COT. These “convec-tive towers” also produce high clouds (mainly cirrus), which cover a large fraction
of the territory. Such conversion of a predominantly water cloud fraction in the
morning into a predominantly ice cloud fraction in the afternoon is seen in Fig. 6. (See also Auxiliary material Fig. S4: http://www.atmos-chem-phys-discuss.net/9/1489/
25
ACPD
9, 1489–1520, 2009Differences in cloud properties observed
by MODIS
N. Meskhidze et al.
Title Page
Abstract Introduction
Conclusions References
Tables Figures
◭ ◮
◭ ◮
Back Close
Full Screen / Esc
Printer-friendly Version
Interactive Discussion
AOD positively correlates with the afternoon enhancement (cold colors on Fig. 6) of the ice cloud fraction (IF). In the dry season, a lesser amount of convective available poten-tial energy and a capping inversion suppress the deep convection and the organization of the shallow clouds into convective towers. Under such conditions in the dry season, the tropical rainforest demonstrates diurnal characteristics typical of other land forest
5
regions (i.e., no change in CF and slight increase in COT).
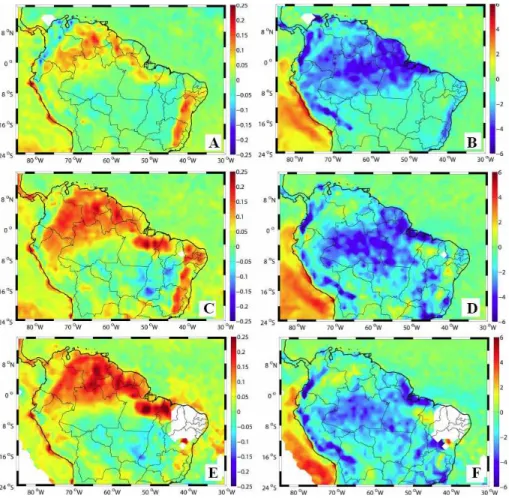
How do aerosols affect this natural pattern seen in the Amazon? To explore the ef-fect of aerosols on morning-to-afternoon changes in cloud properties over the Amazon region, we examine the July–September time period. This time period was chosen, be-cause it is associated with high aerosol content from biomass burning, natural biogenic
10
emissions, and soil dust resuspension (Echalar et al., 1998). Large contrasts in avail-able precipitation between northern and the southern parts of the region associated with climatological features of North American Monsoon System (Vera et al., 2006) also allow us to quantify aerosol effect on clouds during both rainy and dry conditions. Figure 7 shows, that addition of aerosols can strongly influence intra-diurnal variation
15
of clouds and amplify dissimilarities between the northern and the southern parts of the Amazon basin. According to this figure, the strong afternoon decrease (positive
Terra-Aquavalues) in warm cloud cover, characteristic of the wet season (see Fig. 1a,
b), is now only visible in the far northern corner of the Amazon basin. This is the region with high rates of precipitation during this time period. The area along the southern and
20
south eastern margin of the Amazon forest, known as the “arc of deforestation” due to widespread fire activity, demonstrates different behavior: slightly amplified afternoon cloudiness and considerable increase in water cloud optical thickness. Figure 7 also shows that with the addition of aerosols the typical contrast in intra-diurnal variation of cloud properties between the northern and the southern parts of the Amazon deepens.
25
ACPD
9, 1489–1520, 2009Differences in cloud properties observed
by MODIS
N. Meskhidze et al.
Title Page
Abstract Introduction
Conclusions References
Tables Figures
◭ ◮
◭ ◮
Back Close
Full Screen / Esc
Printer-friendly Version
Interactive Discussion
lead to stronger convection is described in Rosenfeld et al. (2008). While previous observational results have also confirmed this model (Andreae et al., 2004; Koren et al., 2005) this is the first time we have seen satellite confirmation of the process occurring on a diurnal scale. We do not see the same dependence on AOD in the arc of deforestation, where convection is suppressed by the prevailing meteorology. Here
5
the intra-diurnal pattern resembles typical patterns seen over other continental areas and does not appear to be affected by the addition of smoke. This does not preclude the effect of smoke on the overall cloud properties during this season and region; it only affects the changes from morning to afternoon.
4 Conclusions
10
A new technique for exploring morning-to-afternoon variability in cloud properties us-ing the differences from theTerraandAquaMODIS overpasses was developed in this study and used to assess the importance of aerosols on intra-diurnal variability of liq-uid clouds. Long-term statistics for the aerosol optical depth and cloud microphysical data obtained from the two MODIS sensors have been used to explore the influence
15
of atmospheric aerosols on the intra-diurnal variability of warm clouds under maritime and continental regimes and different seasons. For the analysis we have selected large areas of marine stratocumulus and trade wind cumulus regions and tropical rainforest. Simultaneous retrievals of aerosol loadings and cloud properties by the MODIS sen-sor allowed us to explore intra-diurnal variation of CF and COT for clean, moderately
20
and heavily polluted clouds in different seasons. Analysis of remotely sensed data revealed that in the afternoon, under the natural conditions (i.e., clean case), stratus clouds become optically thinner with reduced cloud fraction. However, data analysis shows that such natural afternoon “burn-off” is strongly enhanced in the presence of aerosols. We propose that a combination of microphysical and radiative effects is
re-25
numer-ACPD
9, 1489–1520, 2009Differences in cloud properties observed
by MODIS
N. Meskhidze et al.
Title Page
Abstract Introduction
Conclusions References
Tables Figures
◭ ◮
◭ ◮
Back Close
Full Screen / Esc
Printer-friendly Version
Interactive Discussion
ous droplets that are easily evaporated, while absorbing aerosols change atmospheric heating rates and can accelerate the decoupling of the cloud layer from the boundary layer fluxes and speed up entrainment. Although reduction of cloud droplet sizes may also inhibit precipitation, decreasing drizzle just cannot compete with the semi-direct effect of aerosols and the net effect is the reduction in cloud fraction and liquid water
5
path. This was interpreted as the predominance of semi-direct over indirect effect of aerosol in selected stratocumulus clouds. Aerosol enhancement of the afternoon re-duction of CF and COT can be twice as high under polluted conditions than in clean (natural conditions). The stratocumulus clouds offthe coasts of California, Peru and southern Africa are affected by pollution more than 50% of the time. Thus, the findings
10
here imply that aerosols are significantly affecting these stratus cloud decks, which in turn can strongly influence the Earth’s radiation budget with a positive aerosol forcing. This forcing is not apparent in once-a-day views of the Earth.
Data analysis for the trade wind cumulus clouds over the northern Indian Ocean also demonstrated afternoon reduction of CF with enhanced aerosol loadings, also
15
suggesting the dominance of semi-direct over indirect forcing of the Indo-Asian haze. However, unlike stratocumulus clouds, no clear correlation between AOD and COT of trade cumulus clouds was established. Future studies should perhaps consider separation of trade cumulus clouds by their horizontal dimension and their convective activity.
20
Our analysis also revealed that intra-diurnal variation of CF and COT over the Ama-zon region is strikingly different between the northern part with typical dense rainforest and heavy precipitation and the southern and south eastern margins. This difference is further amplified by the presence of biomass burning aerosols that in the northern part of the Amazon basin are associated with strong reduction in the afternoon liquid
25
ACPD
9, 1489–1520, 2009Differences in cloud properties observed
by MODIS
N. Meskhidze et al.
Title Page
Abstract Introduction
Conclusions References
Tables Figures
◭ ◮
◭ ◮
Back Close
Full Screen / Esc
Printer-friendly Version
Interactive Discussion
Aerosol-cloud interaction is a complex problem and all the mechanisms responsible for the intra-diurnal variation of cloud properties cannot be captured by the analysis of remotely sensed data offered in this study. Future research coupling satellite data analysis for diurnal variation of clouds with atmospheric models with detailed cloud microphysical and radiative properties will be necessary to fully explore the validity of
5
our results. Nonetheless, we were able to show that the technique developed in this study can capture some of the major features of aerosol-cloud interaction revealed by previous studies using detailed modeling, in situ measurements and remotely sensed data. Concomitant information about the aerosol loadings and cloud properties avail-able from the MODIS sensors offers an unprecedented opportunity for exploring
intra-10
diurnal variability of cloud properties and we expect that the technique proposed here will be used in the future for improved understanding of indirect and semi-direct radia-tive effects of aerosols on clouds.
Acknowledgements. Meskhidze would like to acknowledge the support from National
Aero-nautics and Space Administration (NASA) Goddard Visiting Fellowship. Remer acknowledges 15
support from the NASA Interdisciplinary Sciences Program.
References
Ackerman, A. S., Toon, O. B., Stevens, D. E., Heymsfield, A. J., Ramanathan, V., and Welton, E. J.: Reduction of tropical cloudiness by soot, Science, 288, 1042–1047, doi:10.1126/science.288.5468.1042, 2000.
20
Albrecht, B. A.: Aerosols, cloud microphysics, and fractional cloudiness, Science, 245, 1227– 1230, doi:10.1126/science.245.4923.1227, 1989.
Anderson, T. L., Charlson, R. J., Winker, D. M., Ogren, J. A., and Holm ´en, K.: Mesoscale Variations of Tropospheric Aerosols, J. Atmos. Sci., 60, 119–136, 2003.
Andreae, M. O., Rosenfeld, D., Artaxo, P. A., Costa, A., Frank, G. P., Longo, K. M., and 25
ACPD
9, 1489–1520, 2009Differences in cloud properties observed
by MODIS
N. Meskhidze et al.
Title Page
Abstract Introduction
Conclusions References
Tables Figures
◭ ◮
◭ ◮
Back Close
Full Screen / Esc
Printer-friendly Version
Interactive Discussion Barnes, W. L., Xiong, X., and Salomonson V. V.: MODIS instrument status and operational
activities, Proc. SPIE Conf, Earth Observing Systems IX, 5542, 14–23, 2004.
Betts, A. K., Bretherton, C. S., and Klinker, E.: Relation between mean boundary-layer structure and cloudiness at the R/V Valdivia during ASTEX, J. Atmos. Sci., 52, 2752–2762, 1995. Brennan, J. I., Kaufman, Y. J., Koren, I., and Li, R. R.: Aerosol-Cloud Interaction – Misclassifi-5
cation of MODIS Clouds in Heavy Aerosol, IEEE Trans. Geosci. Rem. Sens., 43, 911–915, 2005.
Br ´eon, F.-M., Tanr ´e, D., and Generoso, S.: Aerosol effect on cloud droplet size monitored from satellite, Science, 295, 834–838, 2002.
Brill, K. and Albrecht, B.: Diurnal variation of the trade wind boundary layer, Mon. Weather 10
Rev., 110, 601–613, 1982.
Devasthale, A., Kruger, O., and Grassl, H.: Change in cloud-top temperatures over Europe, IEEE Geosci. Rem. Sens. Lett., 2, 333–336, doi:10.1109/LGRS.2005.851736, 2005. Durieux, L., Machado, L. A. T., and Laurent, H.: The impact of deforestation on cloud coverover
the Amazon arc of deforestation, Remote Sens. Environ., 86, 132–140, doi:10.1016/S0034-15
4257(03)00095-6, 2003.
Echalar, F., Artaxo, P., Martins, J. V., Yamasoe, M., Gerab, F., Maenhaut, W., and Holben, B.: Long-term monitoring of atmospheric aerosols in the Amazon Basin: Source identification and apportionment, J. Geophys. Res., 103(D24), 31849–31864, 1998.
Erlick, C. and Schlesinger, D.: Another Look at the Influence of Absorbing Aerosols in Drops 20
on Cloud Absorption: Large Aerosols, J. Atmos. Sci., 65(22), 661–669, 2008.
Erlick, C., Russell, L. M., and Ramaswamy, V.: A microphysicsbased investigation of the radia-tive effects of aerosol-cloud interactions for two MAST Experiment case studies, J. Geophys. Res., 106(D1), 1249–1270, 2001.
Esaias, W. E., Abbott, M. R., Barton, I., Brown, O. B., Campbell, J. W., Carder, K. L., Clark, D. 25
K., Evans, R. H., Hoge, F. E., Gordon, H. R., Balch, W. M., Letelier, R., and Minnett, P. J.: An overview of MODIS capabilities for Ocean science observations, IEEE Trans. Geosci. Rem. Sens., 36(4), 1250–1265, 1998.
Feingold, G., Jiang, H., and Harrington, J. Y.: On smoke suppression of clouds in Amazonia, Geophys. Res. Lett., 32, L02804, doi:10.1029/2004GL021369, 2005.
30
ACPD
9, 1489–1520, 2009Differences in cloud properties observed
by MODIS
N. Meskhidze et al.
Title Page
Abstract Introduction
Conclusions References
Tables Figures
◭ ◮
◭ ◮
Back Close
Full Screen / Esc
Printer-friendly Version
Interactive Discussion Foltz, G. S. and Gray, W. M.: Diurnal variation in the troposphere’s energy balance, J. Atmos.
Sci., 36(8), 1450–1466, 1979.
Forest, C. E., Stone, P. H., Sokolov, A. P., Allen, M. R., and Webster, M. D.: Quantifying uncer-tainties in climate system properties with the use of recent climate observations, Science, 295, 113–117, 2002.
5
Garstang, M., Massie Jr., H. L., Halverson, J., Greco, S., and Scala, J.: Amazon coastal squall lines. Part I: Structure and kinematics, Mon. Weather Rev., 122(4), 608–622, 1994.
Ginoux, P., Chin, M., Tegen, I., Prospero, J. M., Holben, B., Dubovik, O., and Lin, S.: Sources and distributions of dust aerosols simulated with the GOCART model, J. Geophys. Res., 106(D17), 22055–22074, 2001.
10
Greco, S., Swap, R., Garstang, M., Ulanski, S., Shipham, M., Harriss, R. C., Talbot, R., An-dreae, M. O., and Artaxo, P.: Rainfall and surface kinematic conditions over central Amazonia during ABLE 2B, J. Geophys. Res., 95(D10), 17001–17014, 1990.
Han, Q., Rossow, W. B., and Lacis A. A.: Near-global survey of effective droplet radii in liquid water clouds using ISCCP data, J. Climate, 7(4), 465–497, 1994.
15
Holben, B. N., Eck, T. F., Slutsker, I., Tanr ´e, D., Buis, J. P., Setzer, A., Vermote, E., Reagan, J. A., Kaufman, Y. J., Nakajima, T., Lavenu, F., Jankowiak, I., and Smirnov, A.: AERONET – A federated instrument network and data archive for aerosol characterization, Remote Sens. Environ., 66, 1–16, 1998.
Hubanks, P. A., King, M. D., Platnick, S. A., and Pincus, R. A.: MODIS Atmosphere L3 Gridded 20
Product Algorithm Theoretical Basis Document, MODIS Algorithm Theoretical Basis Docu-ment No. ATBD-MOD-30 for Level-3 Global Gridded Atmosphere Products (08 D3, 08 E3, 08 M3), online: http://modis-atmos.gsfc.nasa.gov/ docs/L3 ATBD 2008 12 04.pdf, 2008. Johnson, B. T.: Large-eddy simulations of the semidirect aerosol effect in shallow cumulus
regimes, J. Geophys. Res., 110, D14206, doi:10.1029/2004JD005601, 2005. 25
Johnson, B. T., Shine, K. P., and Forster, P. M.: The semi-direct aerosol effect: Impact of absorbing aerosols on marine stratocumulus, Q. J. Roy. Meteor. Soc., 130(599), 1407–1422, doi:10.1256/qj.03.61, 2004.
Kaufman, Y. J. and Fraser, R. S.: The effect of smoke particles on clouds and climate forcing, Science, 277, 1636–1638, doi:10.1126/science.277.5332.1636, 1997.
30
ACPD
9, 1489–1520, 2009Differences in cloud properties observed
by MODIS
N. Meskhidze et al.
Title Page
Abstract Introduction
Conclusions References
Tables Figures
◭ ◮
◭ ◮
Back Close
Full Screen / Esc
Printer-friendly Version
Interactive Discussion Kaufman, Y. J., Remer, L. A., Tanre, D., Rong-Rong, Li., Kleidman, R., Mattoo, S., Levy,
R. C., Eck, T. F., Holben, B. N., Ichoku, C., Martins, J. V., and Koren, I.: A critical ex-amination of the residual cloud contex-amination and diurnal sampling effects on MODIS estimates of aerosol over ocean, IEEE Trans. Geosci. Rem. Sens., 43(12), 2886–2897, doi:10.1109/TGRS.2005.858430, 2005b.
5
King, M. D., Platnick, S., Moeller, C. C., Revercomb, H. E., and Chu, D. A.: Remote sensing of smoke, land, and clouds from the NASA ER-2 during SAFARI 2000, J. Geophys. Res., 108(D13), 8502, doi:10.1029/2002JD003207, 2003.
King, M. D., Kaufman, Y. J., Tanr ´e, D. and Nakajima, T.: Remote sensing of tropospheric aerosols from space: Past, present, and future, B. Am. Meteorol. Soc., 80(11), 2229–2259, 10
1999.
Knutti, R., Stocker, T. F., Joos, F., and Plattner, G.-K.: Constraints on radiative forcing and future climate change from observations and climate model ensembles, Nature, 416, 719– 723, 2002.
Koren, I., Martins, J. V., Remer, L. A., and Afargan, H.: Smoke invigoration versus inhibition of 15
clouds over the Amazon, Science, 321, 846–949, 2008.
Koren, I., Kaufman, Y. J., Remer, L. A., and Martins, J. V.: Measurement of the ef-fect of Amazon smoke on inhibition of cloud formation, Science, 303, 1342–1345, doi:10.1126/science.1089424, 2004.
Koren, I., Kaufman, Y. J., Remer, L. A., Rosenfeld, D., and Rudich, Y.: Aerosol invigora-20
tion and restructuring of Atlantic convective clouds, Geophys. Res. Lett., 32(14), L14828, doi:10.1029/2005GL023187, 2005.
Kr ¨uger, O. and Graßl, H.: The indirect aerosol effect over Europe, Geophys. Res. Lett., 29(19), 1925, doi:10.1029/2001GL014081, 2002.
Lelieveld, J., Crutzen, P. J., Ramanathan, V., Andreae, M. O., Brenninkmeijer, C. A. M., Cam-25
pos, T., Cass, G. R., Dickerson, R. R., Fischer, H., de Gouw, J. A., Hansel, A., Jefferson, A., Kley, D., de Laat, A. T. J., Lal, S. Lawrence, M. G. Lobert, J. M., Mayol-Bracero, O. L., Mitra, A. P., Novakov, T., Oltmans, S. J., Prather, K. A., Reiner, T., Rodhe, H., Scheeren, H. A., Sikka, D., and Williams, J.: The Indian Ocean experiment: Widespread air pollution from South and Southeast Asia, Science, 291, 1031–1036, doi:10.1126/science.1057103, 2001. 30
ACPD
9, 1489–1520, 2009Differences in cloud properties observed
by MODIS
N. Meskhidze et al.
Title Page
Abstract Introduction
Conclusions References
Tables Figures
◭ ◮
◭ ◮
Back Close
Full Screen / Esc
Printer-friendly Version
Interactive Discussion Machado, L. A. T., Laurent, H., Dessay, N., and Miranda, I.: Seasonal and diurnal variability of
convection over the Amazonia: a comparison of different vegetation types and large scale forcing, Theor. Appl. Climatol., 78(1–3), 61–77, doi:10.1007/s00704-004-0044-9, 2004. McFarquhar, G. M., Platnick, S., Di Girolamo, L., Wang, H., Wind, G., and Zhao, G.: Trade wind
cumuli statistics in clean and polluted air over the Indian Ocean from in situ and remote sens-5
ing measurements, Geophys. Res. Lett., 31, L21105, doi:10.1029/2004GL020412, 2004. Minnis, P., Heck, P. W., Young, D. F., Fairall, C. W., and Snider, J. B.: Stratocumulus cloud
prop-erties derived from simultaneous satellite and island-based instrumentation during FIRE, J. Appl. Meteorol., 31(4), 317–339, 1992.
Nobre, C. A., Mattos, L. F., Dereczynski, C. P., Tarasova, T. A., and Trosnikov, I. V.: Overview of 10
atmopheric conditions during the smoke, clouds, and radiation-Brazil (SCAR-B) field experi-ment, J. Geophys. Res., 103(D24), 31809–31820, 1998.
Penner, J. E., Dong, X. Q., and Chen, Y.: Observational evidence of a change in radiative forcing due to the indirect aerosol effect, Nature, 427, 231–234, doi:10.1038/nature02234, 2004.
15
Platnick, S.: Vertical photon transport in cloud remote sensing problems, J. Geophys. Res., 105(D18), 22919-22935, 2000.
Platnick, S. and Valero, F. P. J.: A validation of a satellite cloud retrieval during ASTEX, J. Atmos. Sci., 52(16), 2985–3001, 1995.
Platnick, S., King, M. D., Ackerman, S. A., Menzel, W. P., Baum, B. A., Riedi, J. C., and Frey, R. 20
A.: The MODIS cloud products: Algorithms and examples from Terra, IEEE Trans. Geosci. Rem. Sens., 41(2), 459–473, doi:10.1109/TGRS.2002.808301, 2003.
Ramachandran, S. and Jayaraman, A.: Premonsoon aerosol mass loadings and size distribu-tions over the Arabian Sea and the tropical Indian Ocean, J. Geophys. Res., 107(D24), 4738, doi:10.1029/2002JD002386, 2002.
25
Ramanathan, V., Subasilar, B., Zhang, G. J., Conant, W., Cess, R. D., Kiehl, J. T., Grassl, H., and Shi, L.: Warm pool heat budget and shortwave cloud forcing: A missing physics?, Science, 267, 499–503, 1995.
Ramanathan, V., Ramana, M. V., Roberts, G., Kim, D., Corrigan, C., Chung, C., and Winker, D.: Warming trends in Asia amplified by brown cloud solar absorption, Nature, 448, 575–578, 30
doi:10.1038/nature06019, 2007.
ACPD
9, 1489–1520, 2009Differences in cloud properties observed
by MODIS
N. Meskhidze et al.
Title Page
Abstract Introduction
Conclusions References
Tables Figures
◭ ◮
◭ ◮
Back Close
Full Screen / Esc
Printer-friendly Version
Interactive Discussion F.: The Indian Ocean Experiment: An integrated assessment of the climate forcing and
effects of the great Indo-Asian haze, J. Geophys. Res., 106(D22), 28371–28398, 2001. Randall, D. A., Coakley, J. A., Fairall, C. W., Kropfli, R. A., and Lenschow, D. H.: Outlook for
research on subtropical marine stratiform clouds, B. Am. Meteorol. Soc., 65, 1290–1301, 1984.
5
Rao, S., Zurbenko, I. Neagu, R. Porter, S. Ku, J., and Henry, R.: Space and time scales in ambient ozone data, B. Am. Meteorol. Soc., 78, 2153–2166, 1997.
Rasch, P. J., Collins, W. D., and Eaton, B. E.: Understanding the Indian Ocean Experiment (INDOEX) aerosol distributions with an aerosol assimilation, J. Geophys. Res., 106(D7), 7337–7355, 2001.
10
Remer, L. A., Kaufman, Y. J., and Kleidman, R. G.: Comparison of three years of Terra and Aqua MODIS aerosol optical thickness over the global oceans, IEEE Geosci. Rem. Sens. Lett., 3(4), 537–540, doi:10.1109/LGRS.2006.879562, 2006.
Remer, L. A., Kaufman, Y. J., Tanr ´e, D., Mattoo, S., Chu, D. A., Martins, J. V., Li, R.-R., Ichoku, C., Levy, R. C., Kleidman, R. G., Eck, T. F., Vermote, E., and Holben, B. N.: 15
The MODIS aerosol algorithm, products, and validation, J. Atmos. Sci., 62(4), 947–973, doi:10.1175/JAS3385.1, 2005.
Rogers, D. P. and Kora ´ein, D.: Radiative transfer and turbulence in the cloud-topped marine atmospheric boundary layer, J. Atmos. Sci., 49(16), 1473–1486, 1992.
Rosenfeld, D.: TRMM observed first direct evidence of smoke from forest fires inhibiting rainfall, 20
Geophys. Res. Lett., 26(20), 3105–2108, 1999.
Rosenfeld, D.: Suppression of rain and snow by urban and industrial air pollution, Science, 287, 1793–1796, doi:10.1126/science.287.5459.1793, 2000.
Rosenfeld, D., Lohmann, U., Raga, G. B., O’Dowd, C. D., Kulmala, M., Fuzzi, S., Reissell, A., and Andreae, M. O.: Flood or drought: how do aerosols affect precipitation?, Science, 321, 25
1309–1313, doi:10.1126/science.1160606, 2008.
Rozendaal, M., Leovy, C., and Klein, S. A.: An observational study of diurnal variations of marine stratiform cloud, J. Climate, 8(7), 1795–1809, 1995.
Schwartz, S., Harshvardhan, E., and Benkovitz, C. M.: Influence of anthropogenic aerosol on cloud optical properties and albedo shown by satellite measurements and chemical transport 30
modeling, P. Natl. Acad. Sci. USA, 99, 1784–1789, 2002.
ACPD
9, 1489–1520, 2009Differences in cloud properties observed
by MODIS
N. Meskhidze et al.
Title Page
Abstract Introduction
Conclusions References
Tables Figures
◭ ◮
◭ ◮
Back Close
Full Screen / Esc
Printer-friendly Version
Interactive Discussion Silva Dias, P. L., Schubert, W. H., and DeMaria, M.: Largescale response of the tropical
atmo-sphere to transient convection, J. Atmos. Sci., 40, 2689–2707, 1983.
Stevens, B., Vali, G., Comstock, K., Wook, R., Van Zanten, M. C., Austin, P. H., Bretherton, C. S., and Lenschow, D. H.: Pockets of open cells and drizzle in marine stratocumulus, B. Am. Meteorol. Soc., 86(1), 51–57, doi:10.1175/BAMS-86-1-51, 2005.
5
Tanr ´e, D., Kaufman, Y. J., Herman, M., and Mattoo, S.: Remote sensing of aerosol properties over oceans using the MODIS/EOS spectral radiances, J. Geophys. Res., 102(D14), 16971– 16988, 1997.
Twomey, S.: The influence of pollution on the short wave albedo of clouds, J. Atmos. Sci., 34, 1149–1152, 1977.
10
Vera, C., Higgins, W., Amador, J., Ambrizzi, T., Garreaud, R., Gochis, D., Gutzler, D., Letten-maier, D., Marengo, J., Mechoso, C. R., Nogues-Paegle, J., Silva Dias, P. L., and Zhang, C.: Toward a unified view of the American Monsoon Systems, J. Climate, 19(20), 4977–5000, 2006.
Xiong, X., Chiang, K.-F., Sun, J., Che, N., and Barnes, W. L.: Aqua MODIS first year on-15
orbit calibration and performance, Proc. SPIE Conf. Sensors, Systems and Next-Generation Satellites VII, 5234, 391–399, 2004.
ACPD
9, 1489–1520, 2009Differences in cloud properties observed
by MODIS
N. Meskhidze et al.
Title Page
Abstract Introduction
Conclusions References
Tables Figures
◭ ◮
◭ ◮
Back Close
Full Screen / Esc
Printer-friendly Version
Interactive Discussion
Table 1.Fraction of total time, when out of all six years of available data, clouds were classified
as clean, moderately polluted and heavily polluted.
AOD range California Peru S. Africa Arabian Sea Bay of Bengal Brazilian Legal
(CAL)1 (PE)1 (SAF)1 (AS)1 (BoB)1 Amazon (BLA)1
DJF MAM JJA SON DJF MAM JJA SON DJF MAM JJA SON JFMA JFMA JAS
AOD<0.1 43 14 30 41 34 44 49 24 21 32 30 9 5 4 25
0.1≤AOD≤0.25 49 64 64 56 61 53 48 68 58 52 38 52 56 45 36
AOD>0.25 7 22 4 0.1 4 2 1 6 20 15 27 36 37 49 28
1
ACPD
9, 1489–1520, 2009Differences in cloud properties observed
by MODIS
N. Meskhidze et al.
Title Page
Abstract Introduction
Conclusions References
Tables Figures
◭ ◮
◭ ◮
Back Close
Full Screen / Esc
Printer-friendly Version
Interactive Discussion
Fig. 1.Global distribution of 6-yr averaged morning minus afternoon values for liquid cloud
ACPD
9, 1489–1520, 2009Differences in cloud properties observed
by MODIS
N. Meskhidze et al.
Title Page
Abstract Introduction
Conclusions References
Tables Figures
◭ ◮
◭ ◮
Back Close
Full Screen / Esc
Printer-friendly Version
Interactive Discussion
Fig. 2. Global distribution of 6-yr averaged morning minus afternoon values for liquid cloud
optical thickness for (A) December–February; (B) March–May; (C) June–August; and (D)
ACPD
9, 1489–1520, 2009Differences in cloud properties observed
by MODIS
N. Meskhidze et al.
Title Page
Abstract Introduction
Conclusions References
Tables Figures
◭ ◮
◭ ◮
Back Close
Full Screen / Esc
Printer-friendly Version
Interactive Discussion
Fig. 3. The 6-yr averaged percent change in morning minus afternoon values for CF (left
col-umn) and COT (right colcol-umn) relative to their value in the morning (∆CF(Terra-Aqua)/CFTerra
and (∆COT(Terra-Aqua)/COTTerra) for marine stratocumulus cloud in selected regions:(a),(d)
ACPD
9, 1489–1520, 2009Differences in cloud properties observed
by MODIS
N. Meskhidze et al.
Title Page
Abstract Introduction
Conclusions References
Tables Figures
◭ ◮
◭ ◮
Back Close
Full Screen / Esc
Printer-friendly Version
Interactive Discussion
Fig. 4.Morning minus afternoon values for 6-yr averaged trade wind cumuli cloud coverage for
ACPD
9, 1489–1520, 2009Differences in cloud properties observed
by MODIS
N. Meskhidze et al.
Title Page
Abstract Introduction
Conclusions References
Tables Figures
◭ ◮
◭ ◮
Back Close
Full Screen / Esc
Printer-friendly Version
Interactive Discussion
Fig. 5. Morning minus afternoon values for 6-yr averaged trade wind cumuli cloud optical
ACPD
9, 1489–1520, 2009Differences in cloud properties observed
by MODIS
N. Meskhidze et al.
Title Page
Abstract Introduction
Conclusions References
Tables Figures
◭ ◮
◭ ◮
Back Close
Full Screen / Esc
Printer-friendly Version
Interactive Discussion
Fig. 6.Morning minus afternoon values for 6-yr averaged differences in ice cloud fraction over
the Amazon basin for July–September period. Morning to afternoon differences are for (A)
ACPD
9, 1489–1520, 2009Differences in cloud properties observed
by MODIS
N. Meskhidze et al.
Title Page
Abstract Introduction
Conclusions References
Tables Figures
◭ ◮
◭ ◮
Back Close
Full Screen / Esc
Printer-friendly Version
Interactive Discussion
Fig. 7. Morning minus afternoon values for 6-yr averaged differences in liquid cloud fraction
(left column) and optical thickness (right column) over the Amazon basin for July–September period. Morning to afternoon differences are for(A),(B)clean(C),(D)moderately polluted, and