ACPD
7, 17537–17558, 2007GOME-2 global water vapour columns
S. No ¨el et al.
Title Page
Abstract Introduction
Conclusions References
Tables Figures
◭ ◮
◭ ◮
Back Close
Full Screen / Esc
Printer-friendly Version
Interactive Discussion
EGU Atmos. Chem. Phys. Discuss., 7, 17537–17558, 2007
www.atmos-chem-phys-discuss.net/7/17537/2007/ © Author(s) 2007. This work is licensed
under a Creative Commons License.
Atmospheric Chemistry and Physics Discussions
Retrieval of global water vapour columns
from GOME-2 and first applications in
polar regions
S. No ¨el, S. Mieruch, H. Bovensmann, and J. P. Burrows
Institute of Environmental Physics, University of Bremen, FB 1, P. O. Box 330440, 28334 Bremen, Germany
Received: 18 October 2007 – Accepted: 15 November 2007 – Published: 3 December 2007
ACPD
7, 17537–17558, 2007GOME-2 global water vapour columns
S. No ¨el et al.
Title Page
Abstract Introduction
Conclusions References
Tables Figures
◭ ◮
◭ ◮
Back Close
Full Screen / Esc
Printer-friendly Version
Interactive Discussion
EGU Abstract
Global total water vapour columns have been derived from measurements of the Global Ozone Monitoring Experiment 2 (GOME-2) on MetOp. For this purpose, the Air Mass Corrected Differential Optical Absorption Spectroscopy (AMC-DOAS) method has been adapted, which has already been applied successfully to GOME (on
ERS-5
2) and SCIAMACHY (SCanning Imaging Absorption spectroMeter for Atmospheric CHartographY, on ENVISAT) data. Comparisons between the derived GOME-2 and SCIAMACHY water vapour columns show a good overall agreement. This gives con-fidence that the time series of water vapour columns from GOME-type instruments which started in 1995 can be continued by the MetOp instrumentation until at least
10
2020. The enhanced temporal and spatial resolution of GOME-2 enables the analysis of short-term variations particularly in the polar regions. This is especially important since atmospheric data sources in the polar regions are generally sparse. As an ex-emplary application, daily water vapour concentrations over the polar research station Ny ˚Alesund (78◦55′19′′N/11◦56′33′′E) are investigated. At this latitude GOME-2 gives
15
about six data points during daylight hours at varying local times. The results of this study show that it is possible to derive information about the diurnal variability of water vapour in polar regions from GOME-2 measurements.
1 Introduction
Several retrieval approaches have shown that satellite measurements in the visible
20
spectral region can be used to derive global water vapour concentrations (see e.g.
No ¨el et al.,1999;Casadio et al.,2000;Maurellis et al.,2000;Lang et al.,2003;Wagner
et al.,2003;Buchwitz et al.,2004). One of these retrieval methods is the so-called Air Mass Corrected Differential Optical Absorption Spectroscopy (AMC-DOAS) approach (see e.g.No ¨el et al., 1999, 2004, 2005, for details) using water vapour and
molecu-25
ACPD
7, 17537–17558, 2007GOME-2 global water vapour columns
S. No ¨el et al.
Title Page
Abstract Introduction
Conclusions References
Tables Figures
◭ ◮
◭ ◮
Back Close
Full Screen / Esc
Printer-friendly Version
Interactive Discussion
EGU The AMC-DOAS method has already been successfully applied to measurements of
the Global Ozone Monitoring Experiment (GOME), see e.g.Burrows et al. (1999), on ERS-2 and the SCanning Imaging Absorption spectroMeter for Atmospheric CHar-tographY (SCIAMACHY), see e.g.Bovensmann et al.(1999), on-board the European environmental satellite ENVISAT.
5
In addition to GOME and SCIAMACHY there are various other space-borne instru-ments providing global water vapour data, some of them with much longer heritage. Most notably here is the series of Special Sensor Microwave Imager (SSM/I) instru-ments (and successors), see e.g.Bauer and Schluessel(1993), which started in 1987 and provides good information about total water vapour columns over ocean. Whereas
10
the SSM/I type instruments work in the microwave (MW) spectral region, other sen-sors, like the Moderate Resolution Imaging Spectroradiometer (MODIS) on Aqua/Terra
(Gao and Kaufman,2003) or the Medium Resolution Imaging Spectrometer (MERIS)
on ENVISAT (Li et al., 2003), operate in the near infrared (NIR). Similar to GOME and SCIAMACHY NIR instruments can provide water vapour data over all surfaces but
15
are typically hampered by clouds. Additional information about the distribution of wa-ter vapour can be derived by utilising data from the Global Positioning System (GPS) satellites (see e.g.Dai et al.,2002).
AMC-DOAS water vapour total column data are available over both ocean and land, but only measurements on the day side and under almost cloud free conditions can be
20
used. In contrast to e.g. water vapour columns derived by microwave instruments like SSM/I, which are typically calibrated by using collocated radio sonde data, the AMC-DOAS water vapour results do not rely on any other measurement data, thus providing a completely new and independent data set. Previous investigations have shown that GOME and SCIAMACHY water vapour data sets can be successfully combined to
25
generate a water vapour climatology covering up to now more than 11 years (No ¨el
ACPD
7, 17537–17558, 2007GOME-2 global water vapour columns
S. No ¨el et al.
Title Page
Abstract Introduction
Conclusions References
Tables Figures
◭ ◮
◭ ◮
Back Close
Full Screen / Esc
Printer-friendly Version
Interactive Discussion
EGU GOME measurements alone have already been performed by Wagner et al. (2006)
andLang et al.(2007).
Although these studies show that even the analysis of short time series can pro-vide interesting results about the global water vapour variability, the applicability of the GOME/SCIAMACHY data set is currently limited by its (in the climatological sense)
5
short duration. Global GOME measurements are only available from June 1995 until May 2003. SCIAMACHY is measuring since 2002 and has already exceeded its orig-inally specified life time. However, the SCIAMACHY instrument is still in good shape and the ENVISAT mission has been extended to 2010; a further extension is currently under investigation.
10
The launch of the MetOp satellite in October 2006 provides a potential further water vapour data source. One instrument on-board of MetOp is GOME-2 (Munro et al.,
2006), an enhanced version of GOME. Because of the similarities between GOME-2 and GOME, the AMC-DOAS retrieval method can also be applied to GOME-2 data. MetOp is only the first in a series of three similar meteorological satellites which gives
15
confidence that the AMC-DOAS water vapour time series can be continued until at least 2020 (have a look at the EUMETSAT web site,http://www.eumetsat.int, for more details).
Beside the usefulness of the combined GOME/SCIAMACHY/GOME-2 data set for climatological trend studies the improved spatial and temporal coverage of
GOME-20
2 will be especially helpful for studies of the polar regions. Although the absolute contribution of the polar regions to the global water vapour budget is comparably small, the Arctic and Antarctic water cycle play a significant role for global climate, mainly due to the coupling of temperature increase (which is expected to be largest in the Arctic
IPCC,2007), water vapour feedback, precipitation and ice melt.
25
ACPD
7, 17537–17558, 2007GOME-2 global water vapour columns
S. No ¨el et al.
Title Page
Abstract Introduction
Conclusions References
Tables Figures
◭ ◮
◭ ◮
Back Close
Full Screen / Esc
Printer-friendly Version
Interactive Discussion
EGU measurements try to fill these gaps, but depending on the underlying measurements
techniques with different advantages and limitations. Microwave measurements are typically limited to ocean areas (although there have been some successful efforts to derive also information over ice, see e.g. Melsheimer and Heygster, 20071) whereas optical sensors can only measure under daylight conditions, usually limited by the
pres-5
ence of clouds.
In this paper we present first AMC-DOAS retrieval results based on GOME-2 mea-surements and compare them with corresponding validated SCIAMACHY data. In addition, advantages resulting from the improved spatial and temporal coverage of GOME-2 are pointed out. Especially, first results on diurnal variations of water vapour
10
in polar regions derived from GOME-2 measurements over the polar research station Ny ˚Alesund are presented.
2 GOME-2 on MetOp
In October 2006 the first of a series of operational meteorological satellites (MetOp) has been launched. One instrument on-board of MetOp is GOME-2, an enhanced version
15
of GOME covering the same spectral range from about 240 to 790 nm. Compared to the GOME instrument, GOME-2 has a higher spatial resolution (80 km×40 km, compa-rable to the SCIAMACHY resolution of typically 60 km×30 km) and a larger swath width of 1920 km, resulting in a daily coverage at mid-latitudes. The MetOp orbit is – as the ERS-2 and ENVISAT orbit – sun-fixed with an equator crossing time of 09:30 LT
(com-20
pared to 10:00 LT for ENVISAT and 10:30 LT for ERS-2). All three instruments (GOME, SCIAMACHY and GOME-2) therefore can observe the same scene within about one hour. This small time difference facilitates the combination of the retrieval results.
Cur-1
ACPD
7, 17537–17558, 2007GOME-2 global water vapour columns
S. No ¨el et al.
Title Page
Abstract Introduction
Conclusions References
Tables Figures
◭ ◮
◭ ◮
Back Close
Full Screen / Esc
Printer-friendly Version
Interactive Discussion
EGU rently, GOME-2 is still in its Calibration/Validation phase, therefore all GOME-2 data
presented here are of preliminary nature.
3 Intercomparison between GOME-2 and SCIAMACHY water vapour data
The AMC-DOAS algorithm could be applied to GOME-2 data without major modifica-tions; it was only necessary to adapt the radiative transfer data base to the GOME-2
5
instrument slit function which is somewhat broader for GOME-2 (Full Width at Half Maximum (FWHM) 0.488 nm) than for SCIAMACHY (FWHM 0.4 nm). Figure1shows a map of the GOME-2 water vapour columns derived this way and the corresponding SCIAMACHY results (V1.0) for the same day (26 March 2007). The larger swath of GOME-2 is clearly visible. An eye inspection of these swath data already reveals that
10
the observed water vapour structures agree quite well. This is confirmed by a more quantitative analysis for which all data are spatially gridded to 0.5◦
×0.5◦and compared.
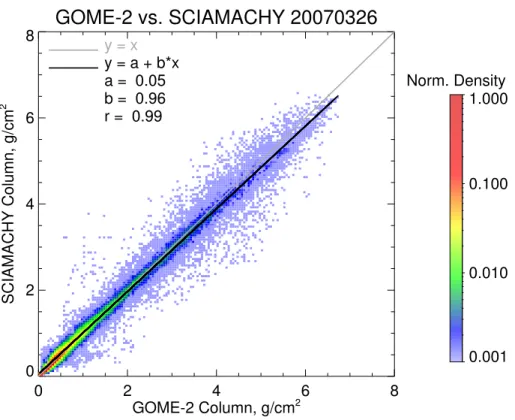
A scatter plot of all resulting collocated data points of GOME-2 and SCIAMACHY for this day is shown in Fig. 2. For this plot, all collocated GOME-2 and SCIAMACHY results have been put on a 0.05 g/cm2×0.05 g/cm2grid. The colours in the plot show
15
the numbers of collocations per grid point, normalised to the maximum value (in this case 6561; the total number of collocated data points is 93 620). Furthermore, a linear curve has been fitted to the data, involving a latitudinal weighting factor which takes into account the different surface area of the spatial grid pixels. As can be seen from Fig.2, the agreement between the two data sets is quite good; the linear correlation
20
coefficient is 0.99, and the fitted straight line reveals a slope of 0.96 and a small bias of 0.05 g/cm2. The density distribution shows that most of the collocations occur at low columns below about 1 g/cm2and that the fraction of data deviating from the 1:1 line is considerably small.
However, this is only a single day example for a comparison between GOME-2 and
25
ACPD
7, 17537–17558, 2007GOME-2 global water vapour columns
S. No ¨el et al.
Title Page
Abstract Introduction
Conclusions References
Tables Figures
◭ ◮
◭ ◮
Back Close
Full Screen / Esc
Printer-friendly Version
Interactive Discussion
EGU 2007). There are some small gaps in the time series which are either caused by
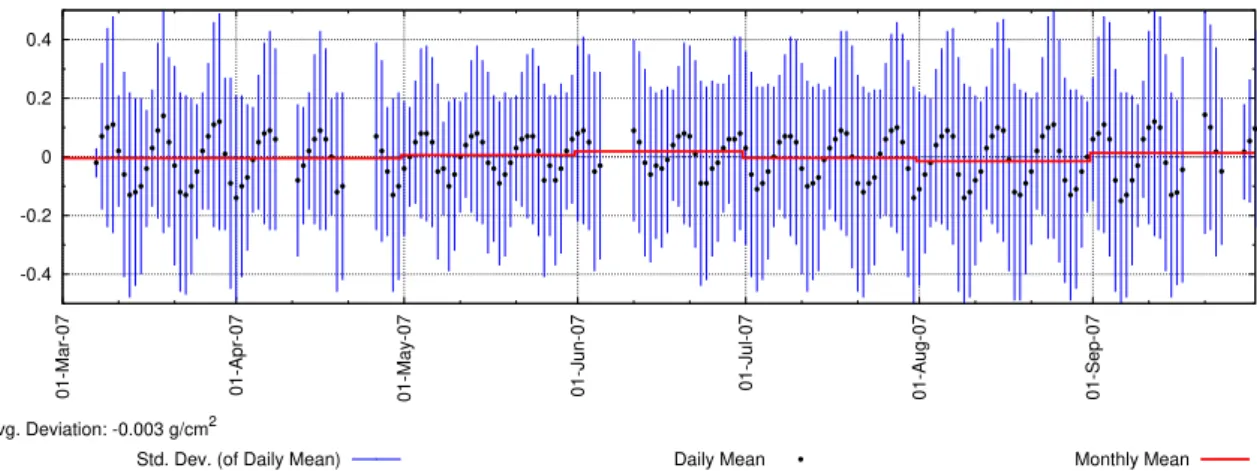
in-strument switch-offs or problems in the reception of the distributed data products. The black dots in Fig.3represent the globally averaged deviation (weighted accounting for the different latitudes) between collocated GOME-2 and SCIAMACHY water vapour columns for one day; the vertical blue bars are the corresponding standard deviations.
5
The red line is the monthly average of the daily means. As can be seen from Fig.3the overall deviation between the GOME-2 and SCIAMACHY results is rather small. How-ever, the observed standard deviations in the order of 0.2–0.3 g/cm2 indicate larger deviations on the local scale, which can be mainly attributed to the strong spatial and temporal variability of water vapour. In fact, a standard deviation of 0.3 g/cm2is quite
10
small when looking at intercomparisons between water vapour data sets derived from measurements of different instruments at larger temporal distances which are typically in the order of 0.5 g/cm2(see e.g.No ¨el et al.,2004;Lang and Lawrence,2005).
A striking feature in Fig. 3 is the sinusoidal variation of the mean deviations as a function of time. With a period of about 9 days the global mean deviations vary with
15
an amplitude of about 0.1–0.15 g/cm2, with somewhat smaller amplitudes towards June which then slowly increase again towards the end of the time series. Related to the average global water vapour column of about 2 g/cm2 this variation is very small (∼6%). This is the order of magnitude of the accuracy of the AMC-DOAS product,
which makes an investigation about the causes for the varying differences between the
20
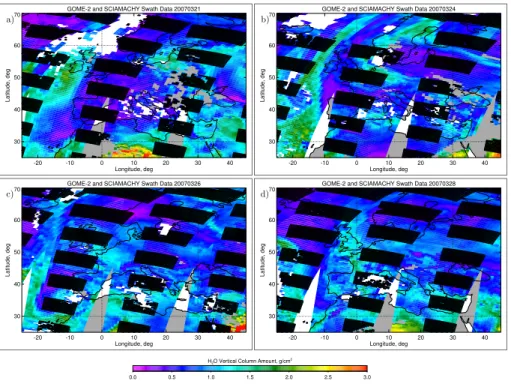
GOME-2 and SCIAMACHY results difficult. Obviously, this variation is related to the relative shift between the ENVISAT and MetOp ground tracks (see Fig. 4). A good agreement between GOME-2 and SCIAMACHY is achieved under symmetrical condi-tions, i.e. when the SCIAMACHY ground pixels are either in the centre of the (larger) GOME-2 swath (Fig.4c) or equally displaced to the East and the West (Fig. 4a). If
25
ACPD
7, 17537–17558, 2007GOME-2 global water vapour columns
S. No ¨el et al.
Title Page
Abstract Introduction
Conclusions References
Tables Figures
◭ ◮
◭ ◮
Back Close
Full Screen / Esc
Printer-friendly Version
Interactive Discussion
EGU be seen directly in the plots.
One possibile explanation for the observed deviations is an East-West asymmetry in the GOME-2 swath data which results in typically higher columns in the eastern part of the scan than in the western part. This is qualitatively supported by plots of daily swath data (like Fig.1) where especially tropical GOME-2 water vapour columns tend to be
5
higher in the eastern part of the swath. This East-West asymmetry could be either related to the calibrated spectra or to the retrieval method, which could be affected by the extreme scan angles of GOME-2. Although the AMC-DOAS method is very insensitive to geometrical issues because of the involved air mass factor correction using O2absorption features, small second order effects caused e.g. by differences in
10
the vertical distribution of O2and H2O can not be completely ruled out.
This assumption has been checked by applying the AMC-DOAS retrieval to simu-lated spectra corresponding to a GOME-2 forward scan. These spectra have been derived from calculations with the radiative transfer model SCIATRAN. The modelled scenario corresponds to a GOME-2 forward scan over the Pacific close to the
equa-15
tor in spring (solar zenith angle about 42◦); a tropical atmosphere is assumed. This
scenario somehow resembles the situation where Fig.1seems to show an East-West asymmetry.
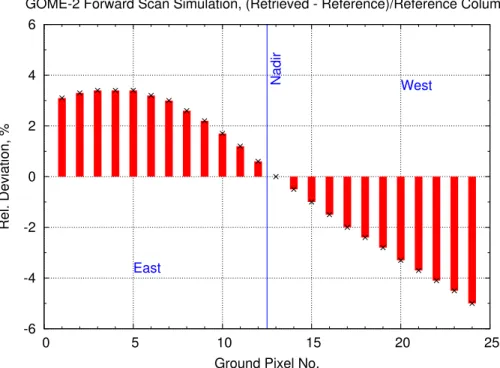
Figure 5 shows the derived relative deviation of the retrieved water vapour column from the known column (4.18 g/cm2) of the tropical reference atmosphere as function
20
of the GOME-2 ground pixel number within the scan. The scan starts on the Eastern side (ground pixel no. 1) and ends on the Western side (ground pixel no. 24). The maximum scan angle is about 45◦with respect to the nadir direction which lies between
ground pixels 12 and 13. The scan is symmetric with respect to nadir, but the velocity of the scan is chosen such that the same spatial resolution is kept along the scan, as
25
GOME-2 does.
ACPD
7, 17537–17558, 2007GOME-2 global water vapour columns
S. No ¨el et al.
Title Page
Abstract Introduction
Conclusions References
Tables Figures
◭ ◮
◭ ◮
Back Close
Full Screen / Esc
Printer-friendly Version
Interactive Discussion
EGU the observed amplitude in Fig.3. Deviations in the East are positive (i.e. the retrieved
column is too high) whereas deviations in the West are negative (i.e. the retrieved column is too low). For larger scan angles deviations are slightly higher in the West than in the East. The derived sign of the deviations is in line with the impression from the swath data (Fig.1) and the occurrence of maxima and minima of the mean deviation
5
between GOME-2 and SCIAMACHY (Fig.3) and i.e. higher GOME-2 columns in the East.
Another potential explanation is that the variations in the mean differences are caused by the large GOME-2 swath of almost 2000 km. The local time difference be-tween a SCIAMACHY and a GOME-2 ground pixel at the same geographic location on
10
the same day depends on the relative position of the SCIAMACHY ground pixels within the GOME-2 swath. The SCIAMACHY measurements occur (with respect to the local time of the GOME-2 measurements) later on the West side than on the East side of the GOME-2 swath. Depending on the relative location of the ground tracks the local time differences can be much larger than the 30 min distance due to the different ENVISAT
15
and MetOp orbits. Local variability and the daily water vapour cycle may then cause systematic deviations between the GOME-2 and SCIAMACHY columns. The seasonal dependence of the daily cycle could then be the reason for the varying amplitude in Fig. 3. This assumption of course can only be verified when more GOME-2 data (at least one year) are available.
20
4 GOME-2 water vapour columns at mid and high latitudes
Although the spatial resolution of the GOME-2 measurements is slightly worse than for SCIAMACHY, the GOME-2 coverage is much better due to the wide swath. This is especially the case for mid-latitudes. Figure6shows as an example for the largely improved spatial and temporal coverage of GOME-2 the daily gridded water vapour
25
ACPD
7, 17537–17558, 2007GOME-2 global water vapour columns
S. No ¨el et al.
Title Page
Abstract Introduction
Conclusions References
Tables Figures
◭ ◮
◭ ◮
Back Close
Full Screen / Esc
Printer-friendly Version
Interactive Discussion
EGU of 320 km with a six times increased spatial resolution. For May 2007 these
measure-ments occur on the 8th, 17th and 27th, as can be seen from Fig.6.
Except for these days GOME-2 measurements provide daily coverage for almost the whole of Europe (limited of course by the presence of clouds). The increase of total water vapour especially over the eastern part of Europe by the end of May 2007 is
5
clearly visible as well as the wind-driven general movement of air masses (including water vapour fields) from the West to the East. The derived GOME-2 water vapour columns therefore provide the possibility to study short-term variations of the water vapour concentrations at latitudes above about 40◦and to potentially separate transport
effects from regional effects.
10
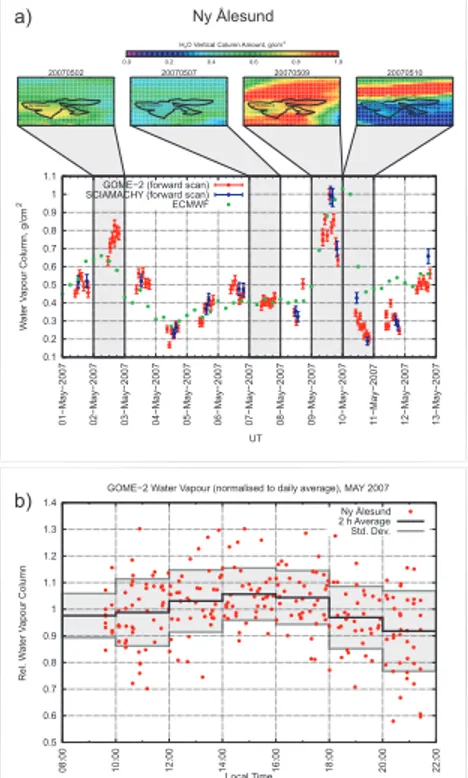
For higher latitudes the temporal coverage of the GOME-2 data is even better. As an example, Fig.7a shows GOME-2 and SCIAMACHY measurements over the polar research station Ny ˚Alesund (78◦55′19′′N/11◦56′33′′E, located at the western coast of
the island Spitsbergen) for twelve days beginning of May 2007. For comparison, corre-sponding water vapour columns from model data of the European Centre for
Medium-15
Range Weather Forecasts (ECMWF) are also plotted in Fig.7a. The ECMWF water vapour columns have been derived using a combination of assimilated meteorological fields (geopotential height, temperature, pressure, and specific humidity) from the op-erational daily analysis data. These data are provided on a 1.5◦
×1.5◦ spatial grid at
91 altitude levels every 6 h. To obtain total water vapour columns the ECMWF data
20
have been integrated over height. As can be seen from this figure, there are typi-cally about six GOME-2 measurements over Ny ˚Alesund per day, compared to two for SCIAMACHY (limited of course by cloudiness and daylight). Obviously, there are four ECMWF data points per day. In the case that adjacent GOME-2 ground pixels overlap (like on 9 May 2007) there may be more than one measurements at almost the same
25
ACPD
7, 17537–17558, 2007GOME-2 global water vapour columns
S. No ¨el et al.
Title Page
Abstract Introduction
Conclusions References
Tables Figures
◭ ◮
◭ ◮
Back Close
Full Screen / Esc
Printer-friendly Version
Interactive Discussion
EGU on other days. Obviously, the precision of the AMC-DOAS water vapour product is high
enough to follow these changes of very low absolute columns. It is also notable that the individual SCIAMACHY measurements are in good agreement with the corresponding GOME-2 results, demonstrating the high precision of the AMC-DOAS method. The overall agreement between the satellite data sets and the ECMWF model data is also
5
quite good, but the temporal variation of the model data is much smoother such that not all small term variations in the water vapour columns seen by the satellite instruments are followed by the ECMWF data. In some cases small columns are overestimated by up to a factor of two by ECMWF whereas larger columns are sometimes underes-timated. This is also partly related to the different spatial resolution of the data sets,
10
as the local variability of water vapour is both of temporal and spatial nature. This is illustrated by some examples for the spatial distribution of water vapour given at the top of Fig.7a. Here, daily gridded (0.5◦
×0.5◦) GOME-2 water vapour total columns around
the region of Spitsbergen are shown for four selected days.
On 7 May 2007 water vapour is quite homogeneously distributed over Spitsbergen;
15
in this case both GOME-2 and ECMWF data show not much variation over the day and agree quite well. On 2 May 2007 most of the derived GOME-2 water vapour columns are higher than the ECMWF data. This could be related to a small plume of water vapour (yellow in the plot) passing Spitsbergen that day which is not resolved by the ECMWF model. The water vapour concentrations on 9 May 2007 are considerably
20
high (sometimes larger than 1 g/cm2) over the whole Spitsbergen area. These high columns as well as their temporal variation is seen by all three data sets, but the rapid decrease of water vapour towards the end of the day is followed by the ECMWF only with some delay. On the next day (10 May 2007) there is a quite sharp north-south gradient of water vapour just above the Spitsbergen island. In this case the ECMWF
25
ACPD
7, 17537–17558, 2007GOME-2 global water vapour columns
S. No ¨el et al.
Title Page
Abstract Introduction
Conclusions References
Tables Figures
◭ ◮
◭ ◮
Back Close
Full Screen / Esc
Printer-friendly Version
Interactive Discussion
EGU the same local time. The resulting increased temporal coverage of GOME-2 enables
studies of daily variability of atmospheric constituents especially at higher latitudes. As an example, Fig. 7b shows the relative variation of GOME-2 water vapour columns measured over Ny ˚Alesund in May 2007 as a function of local time. These data have been derived by dividing all measured columns of one day by the corresponding daily
5
average; this is done to remove the effects of varying absolute amounts of water vapour. Without any daily variations the relative column data would be equal to 1. The Ny
˚
Alesund data span almost the whole day from 9:30 LT to 21:30 LT. Although the scatter of the data is quite high – which is not unusual for water vapour – the Ny ˚Alesund data show a small daily cycle. Highest columns occur around 15:00 LT, lowest columns
10
in the morning and in the evening. The difference between average maximum and minimum water vapour column is about 14%.
5 Conclusions
After GOME and SCIAMACHY the AMC-DOAS method has now also been success-fully applied to GOME-2 measurements in the visible spectral region. The resulting
15
water vapour total columns compare well with corresponding SCIAMACHY data, al-though there is some indication for a small scan angle dependency. The observed systematic East-West differences are on average below about 6% and thus in the or-der of the accuracy of the water vapour product. The scan angle dependency may be partly related to systematic effects of the AMC-DOAS retrieval caused by the wide
20
GOME-2 swath range. Other effects, like systematic mismatches in local time, may also not been ruled out and need further investigation.
One major advantage of the GOME-2 data is the increased coverage compared to e.g. GOME and SCIAMACHY. For middle and higher latitudes GOME-2 provides an at least daily coverage at similar spatial resolution as SCIAMACHY. In polar regions
25
ACPD
7, 17537–17558, 2007GOME-2 global water vapour columns
S. No ¨el et al.
Title Page
Abstract Introduction
Conclusions References
Tables Figures
◭ ◮
◭ ◮
Back Close
Full Screen / Esc
Printer-friendly Version
Interactive Discussion
EGU investigation of sources and transport processes. Especially, the large GOME-2 swath
width allows for the study of trace gas variations as a function of local time at higher latitudes, as has been shown by the analysis of GOME-2 measurements obtained in May 2007 over Ny ˚Alesund which revealed a small average daily variation of water vapour in the order of 14%. Although this is only a first result which requires further
5
confirmation by independent measurements it shows the potential of GOME-2 to pro-vide new information about water vapour concentrations and variations especially in the polar regions.
Acknowledgements. SCIAMACHY is a national contribution to the ESA ENVISAT project, funded by Germany, The Netherlands, and Belgium. SCIAMACHY data have been provided 10
by ESA. GOME-2 data have been provided by EUMETSAT. We thank the European Center for Medium Range Weather Forecasts (ECMWF) for providing us with analysed meteorological fields. This work has been funded by DLR-Bonn and by the University of Bremen and is part of and supported by the EU ACCENT Network of Excellence.
References
15
Bauer, P. and Schluessel, P.: Rainfall, total water, ice water, and water vapor over sea from polarized microwave simulations and Special Sensor Microwave/Imager data, J. Geophys.
Res., 98, 20 737–20 759, 1993.17539
Bovensmann, H., Burrows, J. P., Buchwitz, M., Frerick, J., No ¨el, S., Rozanov, V. V., Chance, K. V., and Goede, A. H. P.: SCIAMACHY – Mission Objectives and Measurement Modes, J. 20
Atmos. Sci., 56, 127–150, 1999. 17539
Buchwitz, M., No ¨el, S., Bramstedt, K., Rozanov, V. V., Bovensmann, H., Tsvetkova, S., and Burrows, J. P.: Retrieval of trace gas vertical columns from SCIAMACHY/ENVISAT
near-infrared nadir spectra: First preliminary results, Adv. Space Res., 34, 809–814, 2004.17538
Burrows, J. P., Weber, M., Buchwitz, M., Rozanov, V., Ladst ¨atter-Weißenmayer, A., Richter, A., 25
de Beek, R., Hoogen, R., Bramstedt, K., Eichmann, K.-U., Eisinger, M., and Perner, D.: The Global Ozone Monitoring Experiment (GOME): Mission Concept and First Scientific Results,
ACPD
7, 17537–17558, 2007GOME-2 global water vapour columns
S. No ¨el et al.
Title Page
Abstract Introduction
Conclusions References
Tables Figures
◭ ◮
◭ ◮
Back Close
Full Screen / Esc
Printer-friendly Version
Interactive Discussion
EGU
Casadio, S., Zehner, C., Pisacane, G., and Putz, E.: Empirical retrieval of the atmospheric air mass factor (ERA) for the measurement of water vapour vertical contenet using GOME data,
Geophys. Res. Lett., 27, 1483–1486, 2000. 17538
Dai, A., Wang, J., Ware, R. H., and Hove, T. V.: Diurnal variation in water vapor over North America and its implications for sampling errors in radiosonde humidity, J. Geophys. Res., 5
107, 10.1029/2001JD000642, 2002. 17539
Gao, B.-C. and Kaufman, Y. J.: Water vapor retrievals using Moderate Resolution Imaging Spectroradiometer (MODIS) near-infrared channels, J. Geophys. Res., 108, 4389, doi:10.
1029/2002JD003023, 2003.17539
Gerding, M., Ritter, C., M ¨uller, M., and Neuber, R.: Tropospheric water vapour soundings by 10
lidar at high Arctic latitudes, Atm. Res., 71, 289–302, 2004. 17540
IPCC: Climate Change 2007: The Physical Science Basis. Contribution of Working Group I to the Fourth Assessment Report of the Intergovernmental Panel on Climate Change, S. Solomon, D. Qin, M. Manning, Z. Chen, M. Marquis, K.B. Averyt, M. Tignor and H.L. Miller, eds., Cambridge University Press, Cambridge, United Kingdom and New York, NY, USA, 996 15
pp., 2007. 17540
Lang, R. and Lawrence, M. G.: Evaluation of the hydrological cycle of MATCH driven by NCEP reanalysis data: comparison with GOME water vapor field measurements, Atmos. Chem.
Phys., 5, 887–908, 2005,http://www.atmos-chem-phys.net/5/887/2005/. 17543
Lang, R., Williams, J. E., van der Zande, W. J., and Maurellis, A. N.: Application of the Spectral 20
Structure Parameterization technique: retrieval of total water vapor columns from GOME,
At-mos. Chem. Phys., 3, 145–160, 2003,http://www.atmos-chem-phys.net/3/145/2003/. 17538
Lang, R., Casadio, S., Maurellis, A. N., and Lawrence, M. G.: Evaluation of the GOME Water Vapor Climatology 1995–2002, J. Geophys. Res., 112, D17 110, doi:10.1029/
2006JD008246, 2007. 17540
25
Li, Z., Muller, J.-P., Cross, P., Albert, P., Hewison, T., Watson, R., Fischer, J., and Bennartz, R.: Validation of MERIS Near IR Water Vapour Retrievals Using MWR and GPS Measurements, in: Proceedings of the MERIS User Workshop 10–13 November 2003 ESA-ESRIN, Frascati,
Italy,http://envisat.esa.int/workshops/meris03/proceedings.html, 2003.17539
Maurellis, A. N., Lang, R., van der Zande, W. J., Aben, I., and Ubachs, W.: Precipitable Water 30
Vapor Column Retrieval from GOME Data, Geophys. Res. Lett., 27, 903–906, 2000. 17538
Dis-ACPD
7, 17537–17558, 2007GOME-2 global water vapour columns
S. No ¨el et al.
Title Page
Abstract Introduction
Conclusions References
Tables Figures
◭ ◮
◭ ◮
Back Close
Full Screen / Esc
Printer-friendly Version
Interactive Discussion
EGU
cuss., 7, 11 761–11 796, 2007.17539
Munro, R., Eisinger, M., Anderson, C., Callies, J., Corpaccioli, E., Lang, R., Lefebvre, A., Livschitz, Y., and Albi ˜nana, A. P.: GOME-2 on MetOp, in: Proc. of The 2006 EUMETSAT Meteorological Satellite Conference, Helsinki, Finland, 12–16 June 2006, EUMETSAT P.48,
2006. 17540
5
No ¨el, S., Buchwitz, M., Bovensmann, H., Hoogen, R., and Burrows, J. P.: Atmospheric Water Vapor Amounts Retrieved from GOME Satellite Data, Geophys. Res. Lett., 26, 1841–1844,
1999. 17538
No ¨el, S., Buchwitz, M., and Burrows, J. P.: First retrieval of global water vapour column amounts from SCIAMACHY measurements, Atmos. Chem. Phys., 4, 111–125, 2004,
10
http://www.atmos-chem-phys.net/4/111/2004/. 17538,17543
No ¨el, S., Buchwitz, M., Bovensmann, H., and Burrows, J. P.: Validation of SCIAMACHY AMC-DOAS water vapour columns, Atmos. Chem. Phys., 5, 1835–1841, 2005,
http://www.atmos-chem-phys.net/5/1835/2005/. 17538
No ¨el, S., Mieruch, S., Bovensmann, H., and Burrows, J. P.: A Combined GOME and SCIA-15
MACHY Global Water Vapour Data Set, in: Proc. ENVISAT Symposium, Montreux,
Switzer-land, 23–27 April 2007 (ESA SP-636), 2007. 17539
Wagner, T., Heland, J., Z ¨oger, M., and Platt, U.: A fast H2O total column density product from
GOME – Validation with in-situ aircraft measurements, Atmos. Chem. Phys., 3, 651–663,
2003,http://www.atmos-chem-phys.net/3/651/2003/.17538
20
Wagner, T., Beirle, S., Grzegorski, M., and Platt, U.: Global trends (1996–2003) of total column precipitable water observed by Global Ozone Monitoring Experiment (GOME) on ERS-2 and their relation to near-surface temperature, J. Geophys. Res., 111, D12 102, doi:10.1029/
ACPD
7, 17537–17558, 2007GOME-2 global water vapour columns
S. No ¨el et al.
Title Page
Abstract Introduction
Conclusions References
Tables Figures
◭ ◮
◭ ◮
Back Close
Full Screen / Esc
Printer-friendly Version
Interactive Discussion
EGU a)
Preliminary GOME-2 AMC-DOAS Water Vapour 20070326
-180 -150 -120 -90 -60 -30 0 30 60 90 120 150 180
Longitude, deg -90
-60 -30 0 30 60 90
Latitude, deg
0 2 4 6 8 10
H2O Vertical Column Amount, g/cm
2
b)
SCIAMACHY AMC-DOAS Water Vapour 20070326
-180 -150 -120 -90 -60 -30 0 30 60 90 120 150 180
Longitude, deg -90
-60 -30 0 30 60 90
Latitude, deg
0 2 4 6 8 10
H2O Vertical Column Amount, g/cm
2
Fig. 1. (a)GOME-2 water vapour columns derived with the AMC-DOAS method for 26 March
ACPD
7, 17537–17558, 2007GOME-2 global water vapour columns
S. No ¨el et al.
Title Page
Abstract Introduction
Conclusions References
Tables Figures
◭ ◮
◭ ◮
Back Close
Full Screen / Esc
Printer-friendly Version
Interactive Discussion
EGU
GOME-2 vs. SCIAMACHY 20070326
0 2 4 6 8
GOME-2 Column, g/cm2
0 2 4 6 8
SCIAMACHY Column, g/cm
2
0.001 0.010 0.100 1.000 Norm. Density
y = x
y = a + b*x a = 0.05 b = 0.96 r = 0.99
Fig. 2. Comparison of water vapour columns derived from preliminary GOME-2 spectral data
from 26 March 2007 with corresponding SCIAMACHY results. The different colors give the
ACPD
7, 17537–17558, 2007GOME-2 global water vapour columns
S. No ¨el et al.
Title Page
Abstract Introduction
Conclusions References
Tables Figures
◭ ◮
◭ ◮
Back Close
Full Screen / Esc
Printer-friendly Version
Interactive Discussion
EGU
-0.4 -0.2 0 0.2 0.4
01-Mar-07 01-Apr-07 01-May-07 01-Jun-07 01-Jul-07 01-Aug-07 01-Sep-07
Mean Deviation GOME2-SCIAMACHY, g/cm
2
GOME-2 - SCIAMACHY Global Mean Deviations
Avg. Deviation: -0.003 g/cm2
Std. Dev. (of Daily Mean) Daily Mean Monthly Mean
ACPD
7, 17537–17558, 2007GOME-2 global water vapour columns
S. No ¨el et al.
Title Page
Abstract Introduction
Conclusions References
Tables Figures
◭ ◮
◭ ◮
Back Close
Full Screen / Esc
Printer-friendly Version
Interactive Discussion
EGU
a) b)
GOME-2 and SCIAMACHY Swath Data 20070321
-20 -10 0 10 20 30 40 Longitude, deg
30 40 50 60 70
Latitude, deg
GOME-2 and SCIAMACHY Swath Data 20070324
-20 -10 0 10 20 30 40 Longitude, deg
30 40 50 60 70
Latitude, deg
c) d)
GOME-2 and SCIAMACHY Swath Data 20070326
-20 -10 0 10 20 30 40 Longitude, deg
30 40 50 60 70
Latitude, deg
GOME-2 and SCIAMACHY Swath Data 20070328
-20 -10 0 10 20 30 40 Longitude, deg
30 40 50 60 70
Latitude, deg
0.0 0.5 1.0 1.5 2.0 2.5 3.0 H2O Vertical Column Amount, g/cm2
Fig. 4.GOME-2 (background) and SCIAMACHY (boxes) water vapour swath data over Europe
for three days with different relative locations of the ground tracks. (a)21 March 2007:
SCIA-MACHY ground pixels in-between GOME-2 pixels. (b)24 March 2007: SCIAMACHY ground
pixels in the western part of the GOME-2 swath. (c) 26 March 2007: SCIAMACHY ground
pixels centred on the GOME-2 swath. (d)26 March 2007: SCIAMACHY ground pixels in the
ACPD
7, 17537–17558, 2007GOME-2 global water vapour columns
S. No ¨el et al.
Title Page
Abstract Introduction
Conclusions References
Tables Figures
◭ ◮
◭ ◮
Back Close
Full Screen / Esc
Printer-friendly Version
Interactive Discussion
EGU
-6 -4 -2 0 2 4 6
0 5 10 15 20 25
Rel. Deviation, %
Ground Pixel No.
GOME-2 Forward Scan Simulation, (Retrieved - Reference)/Reference Column
East
West
Nadir
ACPD
7, 17537–17558, 2007GOME-2 global water vapour columns
S. No ¨el et al.
Title Page
Abstract Introduction
Conclusions References
Tables Figures
◭ ◮
◭ ◮
Back Close
Full Screen / Esc
Printer-friendly Version
Interactive Discussion
EGU Fig. 6.GOME-2 daily water vapour data over Europe (gridded to 0.5◦
×0.5◦in latitude/longitude)
ACPD
7, 17537–17558, 2007GOME-2 global water vapour columns
S. No ¨el et al.
Title Page Abstract Introduction Conclusions References Tables Figures ◭ ◮ ◭ ◮ Back Close
Full Screen / Esc
Printer-friendly Version Interactive Discussion EGU a) 0.1 0.2 0.3 0.4 0.5 0.6 0.7 0.8 0.9 1 1.1 01 −May −2007 02 −May −2007 03 −May −2007 04 −May −2007 05 −May −2007 06 −May −2007 07 −May −2007 08 −May −2007 09 −May −2007 10 −May −2007 11 −May −2007 12 −May −2007 13 −May −2007 W aterV apourColumn,g/cm 2 UT GOME−2 (forward scan) SCIAMACHY (forward scan) ECMWF b) 0.5 0.6 0.7 0.8 0.9 1 1.1 1.2 1.3 1.4
08:00 10:00 12:00 14:00 16:00 18:00 20:00 22:00
Rel.W
aterV
apourColumn
Local Time
GOME−2 Water Vapour (normalised to daily average), MAY 2007
Ny Ålesund 2 h Average Std. Dev.
0.0 0.2 0.4 0.6 0.8 1.0 H2O Vertical Column Amount, g/cm2
Ny lesundÅ Ny Alesund Ny Alesund Ny Alesund
20070502 20070507 20070509 20070510
Ny Ålesund
Fig. 7. Local time variations of water vapour over Ny ˚Alesund. (a) GOME-2, SCIAMACHY and ECMWF water vapour total columns 1–12 May 2007. For four selected days the spatial distribution of water vapour over the Spitsbergen area as seen by GOME-2 (daily gridded data)
is shown. (b) Relative variation of GOME-2 water vapour columns over Ny ˚Alesund in May
2007 as function of local time. The black line shows averages of the Ny ˚Alesund data over