AMTD
3, 1495–1510, 2010Prediction of tropical cyclonegenesis
C. Zhang et al.
Title Page Abstract Introduction Conclusions References Tables Figures
◭ ◮
◭ ◮
Back Close Full Screen / Esc
Printer-friendly Version Interactive Discussion
Atmos. Meas. Tech. Discuss., 3, 1495–1510, 2010 www.atmos-meas-tech-discuss.net/3/1495/2010/ © Author(s) 2010. This work is distributed under the Creative Commons Attribution 3.0 License.
Atmospheric Measurement Techniques Discussions
This discussion paper is/has been under review for the journal Atmospheric Measure-ment Techniques (AMT). Please refer to the corresponding final paper in AMT
if available.
Prediction of tropical cyclonegenesis over
the South China Sea using SSM/I satellite
C. Zhang1, Q. Zhang1, and L. Wang2
1
Department of Atmospheric Science, School of Physics, Peking University, Beijing,100871,China
2
International Pacific Research Center, University of Hawaii at Manoa, Honolulu, Hawaii, HI 96822, USA
Received: 3 March 2010 – Accepted: 23 March 2010 – Published: 6 April 2010 Correspondence to: Q. Zhang ([email protected])
AMTD
3, 1495–1510, 2010Prediction of tropical cyclonegenesis
C. Zhang et al.
Title Page Abstract Introduction Conclusions References Tables Figures
◭ ◮
◭ ◮
Back Close Full Screen / Esc
Printer-friendly Version Interactive Discussion
Abstract
We propose a method for predicting tropical cyclonegenesis over the South China Sea (SCS) based on the total latent heat release (TLHR) derived from the Special Sensor Microwave/Imager(SSM/I) satellite observations. A threshold value (3×10¹⁴W) for
dis-tinguishing the non-developing and developing tropical disturbances is obtained based
5
on the analysis for 25 developing and 43 non-developing tropical disturbances over the SCS during 2000 to 2005. One simple idealized model is further designed to verify that mean TLHR of 3×10¹⁴W within 500 km of the center of tropical disturbance could
maintain and develop the tropical disturbance, by heating the air at the upper level and dropping the sea level pressure by 3.2 hPa. A real time testing prediction of tropical
10
cyclonegenesis over the SCS was conducted for the year of 2007 and 2008 using this threshold value of TLHR. We find that the method is successful in detecting the forma-tion of tropical cyclones for 80% of all tropical disturbances over the SCS during 2007 and 2008.
1 Introduction
15
Tropical cyclone (TC) is one of the most destructive mesoscale weather systems. The early precursor of TC is tropical disturbance (Gray, 1968; Emanuel, 1989). A tropical disturbance is a discrete tropical weather system of apparently organized convection, generally 200 to 600 km in diameter, originating in the tropics or subtropics, having a non-frontal migratory character, and maintaining its identity for 24 h or more (Holweg,
20
2000). However, as real-time observations (https://listserv.illinois.edu/archives) show, not all tropical disturbances could develop to depressions, and most of them would become weaker gradually and disappear in the end. The average life time of a tropical disturbance is about two or three days.
Many researches have been done to find out the mechanisms of tropical
cyclonege-25
AMTD
3, 1495–1510, 2010Prediction of tropical cyclonegenesis
C. Zhang et al.
Title Page Abstract Introduction Conclusions References Tables Figures
◭ ◮
◭ ◮
Back Close Full Screen / Esc
Printer-friendly Version Interactive Discussion
2007, 2008). Unfortunately, this background climatology often means little to the cy-clone forecaster with day-to-day requirements to make formation predictions. Katsaros et al. (2001) assumed that the presence of closed circulation in the surface winds be-fore depressions provide valuable guidance for cyclone be-forecasting. Sharp et al. (2002) found positive vorticity signals which exceed a certain threshold magnitude and
hori-5
zontal extent within the swath of vector wind observations are useful for early detection of TC genesis. Venkatesh and Mathew (2004) supposed merger of mesoscale midlevel vortices to be a common precursor event, and used a vortex merger index to detect cyclonegenesis at an early stage. However, the threshold whether a disturbance is able to develop or not remains controversial.
10
The latent heat release through condensation and precipitation processes is essen-tial to the development and maintenance of tropical disturbances. Wang et al. (2008) analyzed disturbances over the SCS in 2000 and 2001, indicating that 2×10¹⁴W and
6×10¹⁴W may be two important value of mean latent heat release within 500 km of the
center of tropical disturbance to distinguish the developing and non-developing
tropi-15
cal disturbances. This paper is organized to extend the statistics to 2005, proposing a criterion of prediction based on satellite observations and testing the criterion in the prediction of disturbance over SCS in 2007 and 2008.
2 Data
The Special Sensor Microwave/Imager (SSM/I) data products including ocean wind
20
speed (at 10 m), water vapor, cloud water, and rain rate are produced as a part of the Defense Meteorological Satellite Program (DMSP) (Hollinger et al., 1987) since 1987. The DMSP satellite which circles the earth 14 times a day is a polar-orbiting platform in a nearly sun-synchronous orbit. Remote Sensing Systems generates SSM/I data products using a unified, physically based algorithm. This algorithm is a product
25
AMTD
3, 1495–1510, 2010Prediction of tropical cyclonegenesis
C. Zhang et al.
Title Page Abstract Introduction Conclusions References Tables Figures
◭ ◮
◭ ◮
Back Close Full Screen / Esc
Printer-friendly Version Interactive Discussion
which could overlay all of the places we want to study, with a horizontal resolution of 0.25◦
×0.25◦.
The records of tropical disturbances over the SCS are derived from WX-TROPL Tropical Storm and Hurricane WX products issued by the National Hurricane Center in Miami. Satellites data is used in the products to confirm the position of tropical
distur-5
bances and tropical cyclones every day. In this paper, if a disturbance could develop and upgrade to a tropical depression, it is defined as a “developing disturbance”. Oth-erwise, it is defined as a “non-developing disturbance”. A disturbance day is defined as a day in which a disturbance is observed over SCS. A disturbance event is referred to the whole lifetime of a disturbance from its formation to its enhancement or dissipation.
10
3 The statistics of tropical disturbances
3.1 The total latent heat release
The SCS, the largest semi-enclosed marginal sea extending from the equator to 23◦N
and from 99◦to 120◦E in the Northwest Pacific, is an area with frequent occurrence of
TC genesis.
15
The energy for disturbance comes from interaction of cumulus-scale convection and synoptic-scale dynamic field. The large-scale flow provides moisture convergence nec-essary for the convection (Xu and Emanuel, 1989; Williams, 1993), and the heat-ing due to condensation and precipitation maintains the large disturbance (Adler and Rodgers, 1977). The dynamic conditions and thermodynamic conditions both influence
20
the amount of The total Latent Heat Release (TLHR), which may be a good parameter to predict tropical cyclonegenesis. TLHR is calculated by the rain rate observed from SSM/I according to Eq. (1) given by Adler and Rodgers (1977).
TLHR=Lρ
Z
A
AMTD
3, 1495–1510, 2010Prediction of tropical cyclonegenesis
C. Zhang et al.
Title Page Abstract Introduction Conclusions References Tables Figures
◭ ◮
◭ ◮
Back Close Full Screen / Esc
Printer-friendly Version Interactive Discussion
Whereρis the density of rain (1.0×10³kg m−3), andLis the latent heat of
condensa-tion (2.5×10⁶J kg−1). Ais the area of integration (a circle with the radius of 500 km)
andR is the rain rate, which is from the measurements of SSM/I satellites of F13, F14 and F15 every day.
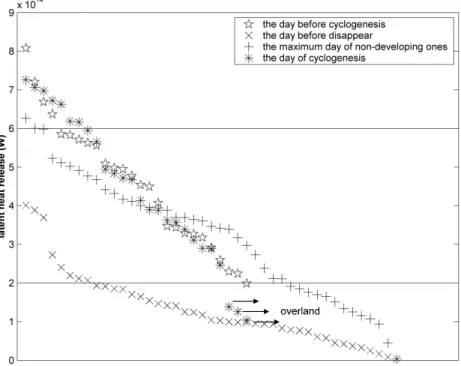
Mean TLHR within 500 km of the center of tropical disturbance for 25 developing
5
ones and 43 non-developing ones over the SCS during 2000 to 2005 is shown in Fig. 1. For developing disturbance, mean TLHR of their generation day(the day when a tropical depression generates) is not always larger than that of the day before cyclonegenesis. If we only analyze the mean TLHR on the day before cyclogenesis or their disappear-ance, 2×10¹⁴W and 6×10¹⁴W are two clear criterions to differentiate them. The mean 10
TLHR for developing disturbances one day before their cyclonegenesis is greater than 2×10¹⁴W, while the mean TLHR is lower than 2×10¹⁴W for 81.4% of non-developing
disturbances one day before their dissipation. There are only 4 developing cases with mean TLHR larger than 6×10¹⁴W one day before their genesis. However, 69.8% of the
non-developing cases have their maximum daily mean TLHR greater than 2×10¹⁴W. It 15
is difficult to do prediction for the tropical disturbances with daily mean TLHR between 2×10¹⁴W and 6×10¹⁴W.
3.2 Accumulated latent heat release
Accumulated latent heat release (ALHR) is defined as the summation of daily TLHR during the lifetime of a tropical disturbance. The ALHR at the day n of the tropical
20
disturbance can be calculated according to Eq. (2).
(ALHR)n= n
X
i=1
(TLHR)i (2)
Where, (TLHR)i is TLHR at the dayi.
Figure 2 presents the variation of mean ALHR within 500 km of the center of tropical disturbance during their whole life over SCS during 2000 to 2005. The green line and
AMTD
3, 1495–1510, 2010Prediction of tropical cyclonegenesis
C. Zhang et al.
Title Page Abstract Introduction Conclusions References Tables Figures
◭ ◮
◭ ◮
Back Close Full Screen / Esc
Printer-friendly Version Interactive Discussion
pink line are criterions with the constant daily mean TLHR of 2×10¹⁴W and 6×10¹⁴W
per day separately. The slopes of red lines which represent developing disturbance are nearly greater than that of blue lines which represent non-developing ones in Fig. 2. One dark line with the constant daily mean TLHR of 3×10¹⁴W is used to separate
developing disturbances and non-developing disturbances, which are better than using
5
the pink or green line. 21 out of 25 developing disturbances and 34 out of 43 non-developing disturbances could be estimated according to this standard. Most tropical disturbances over SCS may need certain energy every day to maintain their intensity and to develop. The amount of energy determines whether a disturbance could develop to a tropical depression or not.
10
As shown in Fig. 1, The value of mean TLHR for nearly all of the developing dis-turbances is larger than 2×10¹⁴W. For a developing disturbance with mean TLHR of
3×10¹⁴W, the energy of 2×10¹⁴W is assumed to maintain itself and 1×10¹⁴W is to
heat the upper level of cumulus. The decrease of surface pressure could be estimated by a simple calculation as follow.
15
3.3 Idealized model
We assumed an air column with radius of 500 km, the air in which only flow out on the top. In an isometric process, when TLHR is released, the air at upper level will expand and flow out of this air column and the surface pressure decrease at last. The decrease of surface pressure (p) is determined by air mass loss of the whole column.
20
d Q=Cpmd T (3)
d H=R d T
g ln(
p500 hPa p200 hPa
) (4)
d p=ρgd H (5)
Where dQ is the energy of 1×10¹⁴W. Cp is specific heat content at constant
AMTD
3, 1495–1510, 2010Prediction of tropical cyclonegenesis
C. Zhang et al.
Title Page Abstract Introduction Conclusions References Tables Figures
◭ ◮
◭ ◮
Back Close Full Screen / Esc
Printer-friendly Version Interactive Discussion
is the variation of temperature. dH means the height increase of air column. R is the molar gas constant (287 J kg−1K−1). g is the acceleration of gravity (10 m s−2). ρ is
the density of air at the upper level which is equal to 0.33 kg m−3 according to
Amer-ican Standard Atmosphere. The equations show that when the air column between 500 hPa and 200 hPa is heated by 1×10¹⁴W, the surface pressure could decrease for 5
3.2 hPa, which matches the real TC genesis well. This simple model proves 1014W is a reasonable magnitude in theory.
3.4 The two threshold to distinguish developing and non-developing disturbances
In conclusion, average daily mean TLHR of 3×10¹⁴W within 500 km of the center 10
of tropical disturbance during their life is a good threshold to distinguish developing disturbances from developing disturbances. As shown in Fig. 2, for some non-developing disturbances, the mean TLHR on the first day is so large that the average daily mean TLHR in the following days is greater than 3×10¹⁴W, even though the mean
TLHR may be less than 3×10¹⁴W after the first day. To avoid this error, whether daily 15
mean TLHR is more than 3×10¹⁴W should be considered. Then the threshold for
de-veloping and non-dede-veloping disturbances can be concluded into two conditions: one is that its average daily mean TLHR is greater than 3×10¹⁴W , and the other one is
that the mean TLHR of the latest day is greater than 3×10¹⁴W. If these conditions are
satisfied, a disturbance will be more possible to upgrade in the future. Otherwise, it will
20
tend to dissipate.
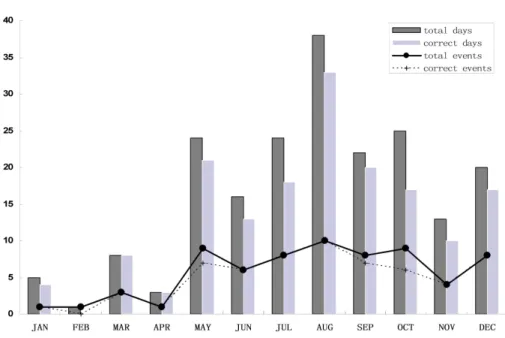
According to the two conditions above, all of the tropical disturbances during 2000 to 2005 are examined and the results are compared with the observation, both for disturbance days and disturbance events (Fig. 3). If the prediction of a day agrees with the observation next day, it is called as “correct day”. Otherwise, it is called as
25
AMTD
3, 1495–1510, 2010Prediction of tropical cyclonegenesis
C. Zhang et al.
Title Page Abstract Introduction Conclusions References Tables Figures
◭ ◮
◭ ◮
Back Close Full Screen / Esc
Printer-friendly Version Interactive Discussion
to 2005. Among 199 disturbance days, 164 of them are correct days. The accurate rate of disturbance day is 82.4%. Of all the disturbance events, 61 are correct events, and the success rate is 89.7%. As shown in many former researches (Li et al., 2007; Wang et al., 2008), seasonal variation of disturbances is obvious in the SCS. The period from Jul to Oct is “peak TC season”, in which the monthly average number of events is 8.75,
5
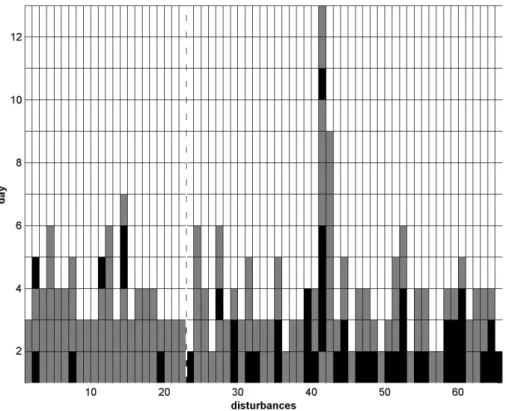
while in the “neap TC season” from January to April, the monthly average number of events is 1.5. The months with the highest success rate are March and April, in which every day and event is correct. October has the lowest success rate of event (66.7%) and day (68%). In most cases correct day has a positive correlation with correct events. Figure 4 presents the correct and incorrect days of each disturbance in its lifetime.
10
For developing disturbances, the rate of correct day is 89.3%, while it is 68% for non-developing disturbances. 51.4% disturbances can be predicted correctly three days before, and 78.6% disturbances can be predicted correctly two days before, and 92.3% disturbances can be predicted one day before their upgrading or dissipation. Another important phenomenon is that for non-developing disturbancesonce the previous daily
15
mean TLHR is less than 3×10¹⁴W, they will never upgrade to depression any more
even though some of them may last for a long time.
3.5 Real time predicting for 2007 and 2008
Based on the criterion above, a real time prediction system is set to predict the trop-ical cyclonegenesis in 2007 and 2008 over SCS (Fig. 5). There are 20 events (6 of
20
them are developing ones and 14 are non-developing ones) and 55 disturbance days from 2007 to 2008. Among the 55 (20) disturbance days (events), 46 (16) are correct days (events). The rate of correct days is 83.6%, and the rate of correct events is 80%. The real time prediction results prove that it is an effective method to predict the disturbances using TLHR from SSM/I satellite. It should be noted that the four
failed-25
AMTD
3, 1495–1510, 2010Prediction of tropical cyclonegenesis
C. Zhang et al.
Title Page Abstract Introduction Conclusions References Tables Figures
◭ ◮
◭ ◮
Back Close Full Screen / Esc
Printer-friendly Version Interactive Discussion
4 Conclusions
On the basis of disturbance records from WX-TROPL Tropical Storm and Hurricane WX products and satellite data from SSM/I, TLHR of developing and non-developing disturbances during 2000 to 2005 over the SCS is analyzed, and an attempt is made in this study to assess and predict whether a disturbance could develop or not every day
5
by calculating TLHR. Our analysis shows that if the mean TLHR within 500 km of the center of a disturbance on the latest day and its daily mean TLHR during previous life are both greater than 3×10¹⁴W, the disturbance will be a developing one in the future.
Otherwise it is a non-developing one. Among 199 disturbance days from 2000 to 2005, 164 of them can be predicted correctly one day before, and the success rate is 82.4%.
10
In the 68 disturbance events from 2000 to 2005, 61 disturbances can be predicted one day before their upgrading or dissipation, and the success rate is 89.7%. According to the criterion, a real time prediction system is established. From the verification in 20 disturbance events and 55 disturbance days over the SCS from 2007 to 2008, the success rate of disturbance events is 80%, and the success rate of disturbance day
15
is 83.6%. The result suggests that TLHR is an available factor in the prediction of tropical cyclogenesis. For non-developing disturbances, our statistics imply that once the average daily mean TLHR is less than 3×10¹⁴W, they would never reach the level
of depression.
In addition, some questions are still unresolved. For instance, some disturbances
20
are not well predicted in autumn during statistic and real-time forecasting, which needs to be studied in more details.
Acknowledgements. The authors are grateful to Remote Sensing Systems for providing the SSM/I satellite data. This work was supported by Chinese Key 973 project 2009CB421500 and NSFC Grant 40921160380 and 40975059.
AMTD
3, 1495–1510, 2010Prediction of tropical cyclonegenesis
C. Zhang et al.
Title Page Abstract Introduction Conclusions References Tables Figures
◭ ◮
◭ ◮
Back Close Full Screen / Esc
Printer-friendly Version Interactive Discussion
References
Adler, R. F. and Rodgers, E. B.: Satellite-observed latent heat release in a tropical cyclone. Mon. Weather Rev., 105, 956–963, 1977.
Emanuel, K. A.: The finite-amplitude nature of tropical cyclogenesis, J. Atmos. Sci., 46, 3431– 3456, 1989.
5
Gray, W. M.: Global view of the origin of tropical disturbances and storms. Mon. Weather Rev., 96, 669–700, 1968.
Hollinger, J. R. Lo, Poe, G., Savage, R., and Pierce, J.: Special Sensor Microwave/Imager user’s guide, Naval Research Laboratory Tech. Report, 120 pp., 1987.
Holweg, E. J.: Mariner’s guide for hurricane awareness in the North Atlantic Basin, 2000. 10
Katsaros, K. B., Forde, E. B., Chang, P., and Liu, W. T.: QuikSCAT’s sea winds facilitates early identification of tropical depressions in 1999 Hurricane season, Geophys. Res. Lett., 28(6), 1043–1046, 2001.
Li, C., Liu, C., and Cheng, Z.: The characteristics of temporal and spatial distribution of tropical cyclone frequencies over the South China Sea and its affecting oceanic factors in the past 15
50 years, J. Trop. Meteorol., 13, 189–192, 2007.
Sharp, R. J., Bourassa, M. A., and O’Brien, J.: Early detection of tropical cyclones using seawinds-derived vorticity, Bull. Am. Meteorol. Soc., 83(6), 879–889, 2002.
Venkatesh, T. N. and Mathew, J.: Prediction of tropicalcyclone genesis using a vortex merger index, Geophys. Res. Lett., 31, L04105, doi:10.1029/2003GL019005, 2004.
20
Wang, G., Su, J., and Ding, Y.: Tropical cyclone genesis over the South China Sea, J. Marine Syst., 68, 318–326, 2007.
Wang, G. H., Chen, D., and Su, J.: Winter Eddy Genesis in the Eastern South China Sea due to Orographic Wind Jets, J. Phys. Oceanogr., 38, 726–732, 2008.
Wang, L., Lau, K., Zhang, Q., and Fung, C.: Observation of non-developing and developing 25
tropical disturbances over the South China Sea using SSM/I satellite, Geophys. Res. Lett., 35, L10802, doi:10.1029/2008GL033446, 2008.
Wentz, F. J.: A well-calibrated ocean algorithm for Special Sensor Microwave/Imager, J. Geo-phys. Res., 102, 8703–8718, 1997.
Wentz, F. J. and Spencer, R. W.: SSM/I rain retrievals within a unified all-weather ocean algo-30
AMTD
3, 1495–1510, 2010Prediction of tropical cyclonegenesis
C. Zhang et al.
Title Page Abstract Introduction Conclusions References Tables Figures
◭ ◮
◭ ◮
Back Close Full Screen / Esc
Printer-friendly Version Interactive Discussion Williams, E.: An analysis of the conditional instability of the tropical atmosphere, Mon. Weather
Rev., 121, 21–36, 1993.
AMTD
3, 1495–1510, 2010Prediction of tropical cyclonegenesis
C. Zhang et al.
Title Page Abstract Introduction Conclusions References Tables Figures
◭ ◮
◭ ◮
Back Close Full Screen / Esc
Printer-friendly Version Interactive Discussion
AMTD
3, 1495–1510, 2010Prediction of tropical cyclonegenesis
C. Zhang et al.
Title Page Abstract Introduction Conclusions References Tables Figures
◭ ◮
◭ ◮
Back Close Full Screen / Esc
Printer-friendly Version Interactive Discussion
AMTD
3, 1495–1510, 2010Prediction of tropical cyclonegenesis
C. Zhang et al.
Title Page Abstract Introduction Conclusions References Tables Figures
◭ ◮
◭ ◮
Back Close Full Screen / Esc
Printer-friendly Version Interactive Discussion
AMTD
3, 1495–1510, 2010Prediction of tropical cyclonegenesis
C. Zhang et al.
Title Page Abstract Introduction Conclusions References Tables Figures
◭ ◮
◭ ◮
Back Close Full Screen / Esc
Printer-friendly Version Interactive Discussion
AMTD
3, 1495–1510, 2010Prediction of tropical cyclonegenesis
C. Zhang et al.
Title Page Abstract Introduction Conclusions References Tables Figures
◭ ◮
◭ ◮
Back Close Full Screen / Esc
Printer-friendly Version Interactive Discussion