www.biogeosciences.net/7/3459/2010/ doi:10.5194/bg-7-3459-2010
© Author(s) 2010. CC Attribution 3.0 License.
Biogeosciences
CO
2
, CH
4
and N
2
O fluxes from soil of a burned grassland in Central
Africa
S. Castaldi1,5, A. de Grandcourt2,6, A. Rasile1, U. Skiba3, and R. Valentini4,5
1Dipartimento di Scienze Ambientali, Seconda Universit`a di Napoli, via Vivaldi 43, 81100 Caserta, Italy
2Centre de Cooperation Internationale en Recherche Agronomique pour le Developpement (CIRAD), Persyst, UPR80, TA
B-80/D, 34398 Montpellier Cedex 5, France
3Centre for Ecology and Hydrology, Edinburgh, Bush Estate, Penicuik, Midlothian EH26 QB, UK
4Dept. of Forest Environment and Resources (DISAFRI), University of Tuscia, via S. Camillo de Lellis, 01100 Viterbo, Italy 5Euro Mediterranean Center for Climate Change, via Augusto Imperatore 16, 73100, Lecce, Italy
6Centre de Recherche sur la Durabilit´e et la Productivit´e des Plantations Industrielles, BP 1291, Pointe Noire, Republic of
Congo
Received: 17 April 2010 – Published in Biogeosciences Discuss.: 1 June 2010
Revised: 24 October 2010 – Accepted: 25 October 2010 – Published: 8 November 2010
Abstract.The impact of fire on soil fluxes of CO2, CH4and
N2O was investigated in a tropical grassland in Congo
Braz-zaville during two field campaigns in 2007–2008. The first campaign was conducted in the middle of the dry season and the second at the end of the growing season, respectively one and eight months after burning. Gas fluxes and several soil parameters were measured in each campaign from burned plots and from a close-by control area preserved from fire. Rain events were simulated at each campaign to evaluate the magnitude and duration of the generated gas flux pulses. In laboratory experiments, soil samples from field plots were analysed for microbial biomass, net N mineralization, net nitrification, N2O, NO and CO2 emissions under different
water and temperature soil regimes. One month after burn-ing, field CO2emissions were significantly lower in burned
plots than in the control plots, the average daily CH4 flux
shifted from net emission in the unburned area to net con-sumption in burned plots, no significant effect of fire was observed on soil N2O fluxes. Eight months after burning,
the average daily fluxes of CO2, CH4and N2O measured in
control and burned plots were not significantly different. In laboratory, N2O fluxes from soil of burned plots were
sig-nificantly higher than fluxes from soil of unburned plots only above 70% of maximum soil water holding capacity; this was never attained in the field even after rain simulation. Higher
Correspondence to:S. Castaldi (simona.castaldi@unina2.it)
NO emissions were measured in the lab in soil from burned plots at both 10% and 50% of maximum soil water holding capacity. Increasing the incubation temperature from 25◦C to 37◦C negatively affected microbial growth, mineraliza-tion and nitrificamineraliza-tion activities but enhanced N2O and CO2
production. Results indicate that fire did not increase post-burning soil GHG emissions in this tropical grasslands char-acterized by acidic, well drained and nutrient-poor soil.
1 Introduction
1996). Sub-Saharan Africa grasslands occupy approximately 14.5 millions of km2and most of this area is affected by fire (White et al., 2000). Fire influences nutrient cycling patterns by modifying plant cover and biodiversity (Menault, 1977; Swaine et al., 1992; Sankaran et al., 2005) and by directly altering chemical, biological and physical properties of soil (Menaut et al., 1993; Andersson et al., 2004a, b). Enhanced rates of mineralization and nitrification have been reported in burned savannas at the beginning of the rainy season (Ad-edejii, 1983; Singh et al, 1991). Soil NH+4concentration was found to increase in savanna and shrubland soils af-ter burning (Christensen, 1973; Singh, 1994; Castaldi and Aragosa, 2002) in consequence of organic matter combustion and heath-induced release from organo-mineral soil com-plexes (Raison, 1979; Kovacic et al., 1986; Prieto-Fernandez et al., 2004 ). Andersson et al. (2004b) measured increased values of NH+4 and dissolved organic N and C in savanna soil after burning, resulting in higher rates of mineraliza-tion and nitrificamineraliza-tion when soil water content enabled micro-bial activation. This generally occurs in the event of rain in seasonally-dry ecosystems and is often accompanied by pulses of NOx, N2O, CO2emissions (Davidson et al., 1993;
Breuer et al., 2000; Garcia-Montiel et al., 2003; Butterbach-Bahl et al., 2004; van Haren et al., 2005). Duration and mag-nitude of these gas pulses vary in relation to frequency and intensity of fire occurrence, plant cover, soil nutrient status and soil matrix potential (Pinto et al., 2002; Rees et al., 2006; Williams et al., 2009). Gas emissions are generally enhanced by wetting-drying cycles (Davidson et al., 1993; Mills and Fey, 2004; van Haren et al., 2005; Jenerette et al., 2008).
Fire may influence the rate of soil CO2efflux by
chang-ing the contribution of autotrophic respiration to total soil CO2emissions and by modifying the amount of soil organic
matter in the top soil. Burning of grasslands often results in earlier growth of grass in the growing season, increasing the length of the biomass growth period (Ojima et al., 1994). On the one hand, by maintaining the dominance of grasses over shrubs and trees, fire-based management of grassland increases the detritus in the upper soil centimetres as grasses have a shallower rooting system as compared to shrubs and trees (Ansley et al., 2002). On the other hand, frequent fires (yearly to once every three years) have been reported to lead to a decline in soil C, as a result of fire combustion of above-ground biomass, leaf litter and soil organic matter in the upper few centimetres (Fynn et al., 2003; Knicker, 2007). Furthermore, fire might influence gas diffusivity by chang-ing soil porosity and water balance (Snyman, 2003; Knicker, 2007), which affects soil potential for CH4oxidation. Most
of the available studies on tropical seasonally-dry ecosys-tems indicate that fire increases the net consumption of CH4
(Castaldi et al., 2006).
Savannas are generally regarded as modest carbon sinks (per surface unit area) (Bombelli et al., 2009), or, where fire frequency is high, they are considered to have an almost neu-tral carbon balance (Saarnak, 2001, Bombelli et al. 2009).
However, data on post burning variations of soil greenhouse gas fluxes in tropical environments are relatively scarce and do not give a clear and univocal answer (Levine et al., 1996; Zepp et al., 1996; Andersson et al., 2004b; Michelsen et al., 2004, Castaldi et al., 2006). The present work inves-tigates the impact of fire on post-burning fluxes of CO2,
CH4and N2O from a grassland ecosystem of central-western
Africa. Specific objectives were to verify (a) whether burn-ing increases the availability of extractable N substrates and stimulates microbial growth, microbial activity, CO2, N2O
and NO production, (b) how simulated rain events affect fluxes of CO2and N2O in burned soils, and (c) whether fire
enhances soil CH4sink.
For this purpose, gas fluxes were measured in the field one month and eight months after an induced fire. A rain simula-tion experiment was also carried out in burned and unburned plots. Lab experiments were performed with soil from exper-imental plots, incubated at different soil water contents and temperatures. The study site was in Congo Brazzaville in view of the presence of extended grassland areas subjected to frequent (yearly) man induced fires.
2 Materials and methods
2.1 Study site
content is>85%), structure (always distinctive), and chem-ical composition (CEC<0.5 cmolckg−1 whatever the soil
layer). These soils have a low clay content, are poor in nutri-ents and therefore unsuitable for agricultural purposes. Sim-ilar soil characteristics are found in most of the coastal re-gion of central Africa (Kouilou rere-gion in Republic of Congo, coastal Gabon). The studied area is subjected to extensive fires every year, between mid-June and mid-July; fires may also occur during the short dry season in February. Fire gen-erally spreads very rapidly and with low intensity. No agri-culture or cattle grazing are conducted in the grasslands; the only human activity that occurs is the mushroom harvest at the beginning of the wet season. The soil in the study site presents a bulk density of 1.43 g cm−3 and a water-holding capacity of 20%.
2.2 Experimental design
Two intensive experimental campaigns were organized, one starting one month after the day of burning (11 June 2007), during the dry season, and the other eight months after burn-ing, in February 2008. This latter period corresponded to a particularly severe “short dry season”, between mid-January to mid-April during a period generally regarded as the “wet season”. At the moment of burning the grassland still had approximately 20% of green biomass. As the area is sub-jected every year to big fires, an area of about 1/2 hectare was isolated from fire by burning preventively a perimeter of vegetation around it, in order to create an “unburned treat-ment”.
To simulate dry-wet cycle events, a 20 m2area was rain-sheltered with a transparent plastic tent, mounted at a height of two meters (to limit sun shading and temperature increase) in each treatment (unburned and burned). The purpose of the tent was to partially limit the input of rain on the plots in the 15 days before the beginning of gas sampling. Rain simu-lation was performed with 30 mm of water (tap water taken in the laboratory just before use). This amount of water cor-responds to a typical large rain event, based on the analy-sis of rain events occurring at the station in the two previ-ous years. Each rain-sheltered area, was divided into 4 plots (2 m×2.5 m), three of which were watered in different mo-ments before the starting of gas sampling (15, 7, 1 day before gas sampling). One subplot in each treatment under the tent was left unwatered. In order to verify the influence of the tent on gas fluxes and on some key soil characteristics (wa-ter content and temperature), another subplot outside the tent was left unwatered.
2.3 Field GHG flux sampling and measurements
CO2, N2O and CH4 fluxes were measured from each plot
on 4 replicates. In order to measure N2O and CH4 fluxes,
we used closed static chambers (Hutchinson and Mosier, 1981; Smith et al., 1995). These were made of PVC
col-lars (7 cm high with a diameter of 15 cm), inserted in the soil to about 5 cm depth in a slot previously dug by a metal cutting ring, and chamber lids (20 cm high with a diameter of 15 cm) provided with a 2-way stopcock sampling port. To determine N2O and CH4 fluxes, gas (20 ml) was
sam-pled from 9 a.m. to 12 a.m., using gas-tight syringes, from the chamber headspace at 0, 20 and 60 min after closure; it was immediately stored in pre-evacuated gas-tight vials, which were sealed with thermal glue and shipped within a month from gas sampling to the Department of Envi-ronmental Sciences (DSA-SUN,ITALY) for gas chromato-graphic analysis. Flux rates were determined via linear re-gression of the three sampling points (0, 20, 60 min) for each chamber and by applying a temperature and pressure correc-tion. The minimum detectable flux over a period of 60 min was 0.10 mg N2O m−2d−1and 0.07 mg CH4m−2d−1. The
analytical precision of the GC for standards at ambient concentration was approximately 1.5%, using one standard deviation as a measure of mean error. Any flux below these reported detection limits was assigned a value of zero. Soil temperature (HI93510 thermometer, Hanna In-struments Canada Inc., Laval, Quebec) and soil water con-tent (ThetaProbe ML2, Delta-T Device Ltd, Cambridge, UK) were measured in correspondence of each chamber (0–10 cm depth), 5 cm from the chamber edge, at each sampling date.
Soil respiration (Rs) was measured using the Li 8100 soil respiration infrared gas analyzer system with a 8 cm-diameter chamber (LiCor Inc, Lincoln, NE, USA) which was placed on collars (7 cm high, 4 collars per each plot) inserted in the soil to a depth of 5 cm inside the PVC collars used for N2O and CH4fluxes measurements. The increase of the CO2
concentration was measured over an interval of 2 minutes (including a dead band of 30 seconds) starting at the ambient CO2concentration. Soil temperature at 0-40 cm depth was
monitored simultaneously with soil CO2efflux using a
ther-mocouple penetration probe (Li6000-09 TC, LiCor Inc) in the vicinity of the soil respiration chamber. This temperature value was used to normalize soil respiration values at 25◦C, using the temperature function: R(T )=R(25◦).Q
(T−25)
10 10 , with
a Q10value equal to 2.78, determined from a dataset of soil
respiration measured on the site since 2006 (Caquet et al., in preparation). This normalization was used to compare the effect of wetting treatments independently from temper-ature effects on soil respiration. In fact, soil respiration was measured during different hours of the day depending on the daily experimental load with a variation of soil temperature in a range of 4.2◦C (measured from from 9 a.m. to 5 p.m.) in the first campaign and 2.7◦C (measured from from 9 a.m. to 1 p.m.) in the second campaign. The volumetric soil water content in the topsoil layer (0–6 cm) was monitored just after respiration measurements at 5 cm from chamber edge.
2.4 Soil sampling
Soil was sampled at 0–10 cm depth at the end of the two campaign periods from unburned and burned control plots (unwatered) by taking 4 soil cores from each plot. The soil samples were immediately sieved (2 mm mesh), air-dried (2 day max required) and shipped to DSA-SUN and the Cen-tre for Ecology and Hydrology (CEH, UK) for subsequent analyses.
2.5 Laboratory incubations
Two laboratory experiments were set up. In the first (at DSA-SUN), soil samples from the two treatments were analysed for microbial biomass, net N mineralization, net nitrification, N2O, NO and CO2emissions under different soil water and
soil temperature regimes. For this purpose, 50 g of sieved soil samples were repacked into columns (10 cm height, 5.5 cm inner diameter, the volume occupied by the soil about 50 cm3, bulk density 1.00±0.07 and 1.03±0.1 g cm−3, for
un-burned and un-burned soil, respectively) that were incubated in half-litre flasks (on triplicate). Soils were incubated for 15 days at 0, 25%, 50%, 100% of maximum water-holding ca-pacity, WHCmax, (WHCmax33% for burned and 37% for
un-burned soil measured on repacked sieved soil columns) and at two temperatures (25◦C and 37◦C). In order to observe the pulse effect of water addition on dry soil, pre-incubation was omitted. The flasks were kept open and water loss was corrected every day by gravimetrical determination. Gas fluxes were measured on days 0, 1, 3, 10 and 15, by clos-ing the flasks with air-tight lids and samplclos-ing gas att0 and
after 24 h. At the beginning and at the end of the incubation (15 days), soil mineral N was determined to quantify min-eralization and nitrification net rates; soil microbial biomass was quantified at the end of the experiment.
For the second incubation experiment (at Centre for Ecol-ogy and HydrolEcol-ogy, Edinburgh), sieved soil samples (100 g on triplicate) repacked into clear Perspex columns (20 cm height, 5.5 cm inner diameter, volume occupied by soil around 100 cm3)were incubated at 25 ◦C at 10% and 50% of WHCmax. NO emissions were measured one hour, 5
days and 7 days after water addition, using a gas flow-through system described in details by Dick et al. (2001). NO was analysed by chemiluminescence (42C model, Thermo-Environmental Instrument) and O3 by UV absorption (427
model, Thermo-Environmental Instrument). N2O fluxes
were determined in the same day (30 min after NO flux deter-mination) closing the columns for 30 minutes and sampling 20 ml of gas from the column headspace att0andt30 min.
N2O concentration in the samples was determined by gas
chromatography. Soil cores were left uncapped in between gas sampling events and losses of water were corrected ev-eryday by gravimetrical determination
2.6 Analytical technique
Soil mineral N was extracted with 0.5 M K2SO4(1:4 soil
ex-tractant v/v) and filtered with Whatman filter no. 42. NH+4 and NO−3 were then determined on extracts by potentiomet-ric analysis using specific electrodes for NH+4 (Model Orion 9512) and NO−3 (Model Orion 9707). Soil total carbon and nitrogen content were determined on homogenized soil sam-ple by flash combustion-gas chromatography on a NCS-soil Thermo FlashEA 1112. Net N mineralization and net nitri-fication rates over 15 days were calculated respectively as the difference between total mineral N (NH+4 + NO−3) or nitric N, measured after 15-day incubation and att0. The
spectrophotometric ninhydrin method developed by Moore and Stein (1954) was used to quantifyα-amino-N in soil ex-tracts (soil: extract 1:5) using 0.5 MK2SO4. This procedure
enables the quantification of soluble proteins, aminoacids and molecules containing α-amino-groups. A fumigation-extraction method was used in order to estimate theα -amino-N fraction associated with soil microbial biomass. Soil (5 g) was fumigated for 24 h with chloroform. The fraction of the cell constituents, made available by fumigation, was ex-tracted by shaking the soil with 20 ml of 0.5 MK2SO4 for
1 h and filtering the suspension with paper filter (Whatman no. 42). The ninhydrin-N deriving from the biomass was calculated as µg ninhydrin-N g−1 dry soil of the fumigated samples minus the µg ninhydrin-N g−1dry soil of the unfu-migated samples. By using this value, the µg biomass N g−1 was calculated using a conversion factor of 62 (Ocio and Brookes, 1990).
CH4, N2O and CO2 determinations on field and
labora-tory gas samples were made at DSA-SUN using a gas chro-matograph (Fison series 800) equipped with an electron cap-ture detector (ECD) maintained at 280◦C and a flame ion-ization detector (FID) set up to analyse the three gases on the same sample, using a frontflush and a backflush system (Castaldi et al., 2004). Column and precolumn were stain-less steel packed with Porapak Q, both maintained at 60◦C. N2 was used as carrier gas (flow rate 40 cm3min−1). The
injection port was provided with a 2-ml loop. N2O
analy-sis at CEH were done using a gas chromatograph (Hewlett Packard, 5890) equipped with an electron capture detector kept a 320◦C, columns were stainless steel packed with
Po-rapak Q (oven 60◦C) and Ar/CH4 was used as carrier at a
flow rate of 40 ml min−1. Standards were injected every 20 samples to allow for GC drift.
2.7 Statistical analyses
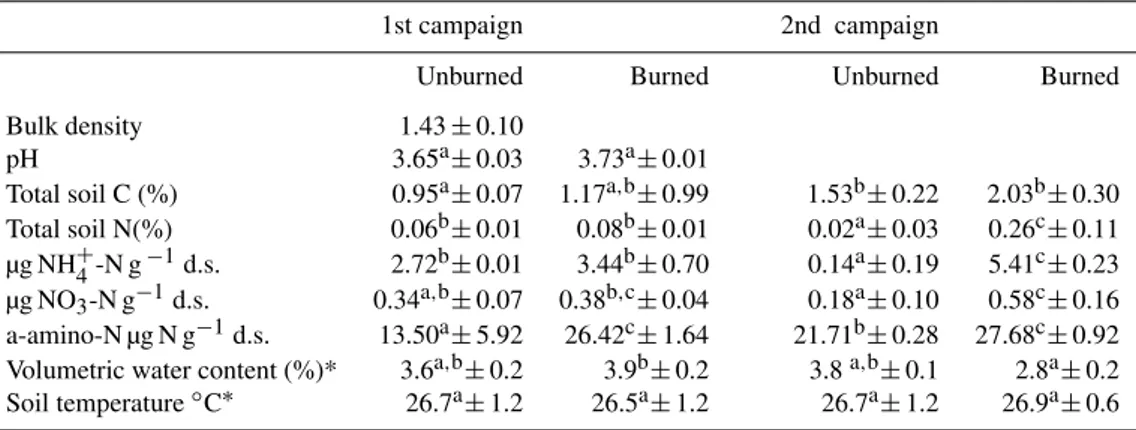
Table 1.A selection of soil chemical characteristics of the unburned and burned plot soils measured during the first (one month after burning) and second field campaign (eight months after burning) for the top 10 cm of soil. Different superscript letters indicate significant differences (two-Way ANOVA,P <0.005) among values in the same row.
1st campaign 2nd campaign
Unburned Burned Unburned Burned
Bulk density 1.43±0.10
pH 3.65a±0.03 3.73a±0.01
Total soil C (%) 0.95a±0.07 1.17a,b±0.99 1.53b±0.22 2.03b±0.30 Total soil N(%) 0.06b±0.01 0.08b±0.01 0.02a±0.03 0.26c±0.11 µg NH+4-N g−1d.s. 2.72b±0.01 3.44b±0.70 0.14a±0.19 5.41c±0.23 µg NO3-N g−1d.s. 0.34a,b±0.07 0.38b,c±0.04 0.18a±0.10 0.58c±0.16 a-amino-N µg N g−1d.s. 13.50a±5.92 26.42c±1.64 21.71b±0.28 27.68c±0.92 Volumetric water content (%)* 3.6a,b±0.2 3.9b±0.2 3.8a,b±0.1 2.8a±0.2 Soil temperature◦C∗ 26.7a±1.2 26.5a±1.2 26.7a±1.2 26.9a±0.6
∗average of 5 days of field measurements taken during 2 weeks of campaign
Newman-Keul test”. When normality test failed, a Kruskal-Wallis ANOVA on ranks was performed. Simple linear re-gressions, multiple linear regression and non- linear regres-sion analysis were performed to find the relationship between independent and dependent variables (Sigma Stat, Jandel Scientific). To test for significant differences between slopes and intercepts of two different linear regressions, an analysis of covariance (ANCOVA) by the GLM procedure was per-formed using SAS/STAT 9.00 (SAS Institute Inc, Cary, NC, USA). Significant differences were at theP <0.05 level.
3 Results
3.1 Soil parameters
The analysed soil was characterized by an acidic pH, slightly higher in the burned plots, and relatively low content of total C and N (Table 1). Total C increased in both treatments af-ter eight months but no significant difference was observed between burned and unburned plots. Total N was signifi-cantly higher after eight months in burned plots, while one month after burning it was equally low in both treatments (Table 1). NH+4-N was the dominant form of soil mineral N in both sampling campaigns (Table 1), and it was slightly higher in burned plots than in controls (Table 1). The soil content of extractable organic N, measured as α-amino-N (aminoacids, peptides, proteins, etc), was much higher than mineral N in both sampling periods, and it was significantly higher in burned plots (Table 1). Soil water content (average of five sampling days over 2 weeks of campaign) measured in unwatered plots was extremely low during both campaigns and, as also observed for soil temperature, did not change significantly between treatments (Table 1, Fig. 1). The rain-sheltering tent did not significantly influence soil water con-tent and temperature in both campaigns, as no significant
dif-ference (P >0.05 two-way ANOVA) between datasets ob-tained outside and inside the tent was observed for these two variables
When the rain event was simulated, the maximum soil water-filled pore space (WFPS), measured in the top 10 soil centimetres, was approximately 42.8% during the first cam-paign and 51% during the second camcam-paign (Fig. 1). Soil WFPS decreased rapidly after water addition, going back to values comparable to the control plots within 10 days, in the first campaign, and 7 days, in the second campaign (Fig. 1), with no significant difference between burned and unburned treatments (Fig. 1).
3.2 Soil respiration
As no difference between CO2effluxes measured from
un-watered controls outside and inside the tent was found, av-erage daily fluxes of soil respiration were calculated us-ing all the replicates from unwatered plots. The aver-age daily soil respiration, not normalized for temperature, was 7.8±0.3 mg of CO2m−2d−1(unburned) and 5.6±0.1
(burned) mg of CO2m−2d−1 (calculated from 12 days of
measurements) one month after burning. Eight months af-ter burning average daily soil respiration was 11.2±0.6 mg
of CO2m−2d−1(unburned) and 11.8±0.9 (burned) mg of
CO2m−2d−1 (calculated from 6 days of measurements).
The increase in soil respiration observed after eight months, for both treatments, was statistically significant (P <0.05 using a two-way ANOVA). The difference between treat-ments was statistically significant (P <0.05 using a two-way ANOVA) one month after burning (first campaign) but not after eight months. Watering induced a pulse of CO2
Fig. 1.Soil water filled pore space (%) (0–10 cm soil depth) in function of time after watering (days) during the 1st campaign(A)one month after burning and the 2nd campaign(B)eight months after burning. The vertical bars correspond to one standard error (n=3 to 12).
Fig. 2.Soil respiration normalized at 25◦C, using a Q10of 2.78 (g CO2m−2d−1)in function of time after watering during the 1st campaign (A)one month after burning and the 2nd campaign(B)eight months after burning. The vertical bars correspond to one standard error (n=3 to 9).
soil WFPS (Figs. 1 and 2). Comparing data sampled in the same days shows that CO2emissions from unburned watered
plots were usually significantly higher than emissions from burned watered plots one month after burning (Fig. 2a).
The normalized soil respiration increased linearly with the increase in soil water-filled pore space (WFPS) in both cam-paigns (Fig. 3). The slopes of the regression lines, which fitted the data from burned and unburned plots (equations re-ported in Fig. 3), were not significantly different (P >0.05, ANCOVA) in either campaigns, whereas the y-axis intercept was significantly higher in unburned than in burned plots (P <0.0001, ANCOVA) in both campaigns. In the present study, the applied normalization to soil respiration data, us-ing Q10 correction, did not affect the result. In fact, both
normalized and raw data of soil respiration increased linearly with increasing soil WFPS, moreover, the normalization did not significantly alter differences in slopes and intercepts be-tween burned and unburned plots.
No significant difference was observed between the fre-quency distribution of soil respiration values for unburned
and burned treatments in both campaigns, and the data were normally distributed (Kolmogorov-Smirnov test)
3.3 Methane fluxes
CH4 flux in unwatered plots (average of data from
outside and inside the tent) one month after burn-ing (1st campaign) resulted in a net emission in un-burned plots (0.70±0.62 mg CH4m−2d−1) and in a net, although weak, sink in burned plots (−0.34±0.27 mg CH4m−2d−1).The difference was statistically significant
(P <0.05). Eight months after burning (second cam-paign), the site acted as a weak net CH4 sink in
both unburned (−0.40±0.57 mg CH4m−2d−1)and burned (−0.75±0.75 mg CH4m−2d−1) plots, with no significant difference between treatments. CH4fluxes were highly
vari-able, as indicated by the flux distribution reported in Fig. 4. A significant difference in the distribution of CH4 fluxes,
Fig. 3. Soil respiration normalized at 25◦C, using a Q10of 2.78 (g CO2m−2d−1)in function of water filled pores space (%) during the 1st campaign (A) one month after burning and the 2nd campaign (B) eight months after burning. Each point refers to one single chamber measurement. Lines (continuous unburned, dotted burned) represent linear regressions indicated by the correspondent equations.
the frequency of fluxes above 0.80 mg CH4m−2d−1and an
increase of fluxes below 0 mg CH4m−2d−1 was observed
in burned plots (Fig. 4). Eight months after burning, the frequency distributions in the two treatments were similar (Fig. 4). Analysing the relationship between soil water-filled pore space and CH4fluxes, obtained including the watered
plots (Fig. 5), we observe that in the first month after burn-ing most of the fluxes were positive (net emission) in un-burned plots and negative (net consumption) in un-burned plots for values of WFPS below 15%. Most of the measured fluxes were positive in both treatments above this threshold. Eight months after burning there was no clear difference between fluxes measured in either treatment. In contrast to what ob-served in the first campaign, the increase in soil WFPS did not induce a clear shift from net CH4sink to net CH4source
in the second campaign, although above 10% of WFPS the frequency of net CH4emissions increased (Fig. 5).
3.4 Nitrous oxide fluxes
Nitrous oxide fluxes were low, and in the second campaign many of the analyzed fluxes were below the detection limit of the technique used. The daily average N2O flux,
cal-culated from 5 days of measurements in both campaigns, was 0.02±0.13 mg of N2O m−2d−1 in unburned plots
(range−0.7 to 0.6) and 0.02±0.10 mg of N2O m−2d−1 in
burned plots (range−0.4 to 0.5) one month after burning;
−0.03±0.11 mg of N2O m−2d−1 in unburned plots (range
−0.6 to 0.0) and 0.0±0.4 mg of N2O m−2d−1 in burned
plots (range−0.1 to 0.2) eight months after burning. A slight
shift of flux frequency distribution towards more positive (emission) fluxes was observed in burned plots, compared with unburned ones (Fig. 6). The average flux in the two treatments, however, was not significantly different. Water addition produced no detectable increase of N2O emissions
(data not shown) in both unburned or burned plots.
Fig. 5.Single chamber CH4fluxes (mg CH4m−2d−1)plotted versus soil water filled pore space (%) reported for the 1st campaign (A) one month after burning and the 2nd campaign (B) eight months after burning. In graph A line represents the fit of data from burned plots (y0=
−0.53; a = 0.008; b = 1.54;R2=0.76).
Fig. 6. The frequency distribution of single-chambers estimates of N2O fluxes (mg N2O-N m−2d−1)measured in unburned and burned plots (no water treatment) during the 1st campaign (A) one month after burning (n=32) and the 2nd campaign (B) eight months after burning (n=30). The range of each size class interval is 0.2 mg N2O-N m−2d−1.
3.5 Laboratory incubations
In the first incubation experiment, 92% of N2O production
occurred within the first day after water addition; there-after N2O fluxes decreased exponentially (data not shown).
N2O emission was significantly enhanced in soil from burned
plots but differences with soil from unburned plots were found only above 50% of WHCmax(Fig. 7). N2O fluxes rose
exponentially with increasing water content, with a faster rate in soil from burned plots (Fig. 7, insert). Rising the temperature from 25 to 37◦C had no significant effect on N2O emissions even at 100% of WHCmax. The pulse of CO2
peaked the first day after water addition, accounting for about 50% of total cumulative CO2emission over about 15 days.
At the end of the incubation (day 15), CO2 emissions from
watered soil (25, 50 and 100% of WHCmax)were still
signif-icantly higher than from unwatered soil (0% WHCmax)(data
not shown). Figure 7, reporting the cumulative CO2
emis-sions at day 1, 2, 3, 4, 5, 7 and 15 of incubation, shows that respiration was significantly stimulated by water addition at 25% of WHCmax. Further water addition induced no further
significant change in the rate of CO2 production. The
in-crease of incubation temperature from 25◦C to 37◦C signif-icantly stimulated CO2 production. The highest respiration
rates were found in watered soil from burned plots (Fig. 7). Microbial biomass N, net N mineralization and net nitrifica-tion were lower at 37◦C than at 25◦C (Fig. 8). Net nitri-fication was close to zero for all tested soil water contents at 37◦C. At 25◦C both nitrification and microbial biomass showed a maximum between 25 and 50% of WHCmax; at
100% of WHCmax, biomass growth was significantly
re-duced and no net nitrification was observed. Net N miner-alization increased with increasing soil water content up to 100% of WHCmax(Figs. 7 and 8), following the same
pat-tern as for N2O production. Rates of net N mineralization
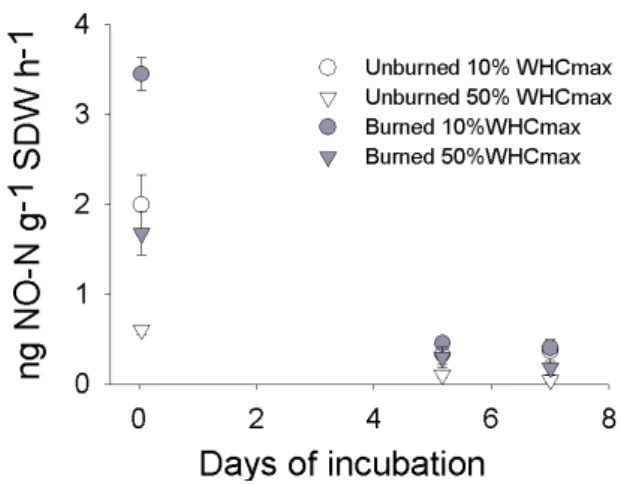
and values of microbial biomass N were slightly higher in soil from burned plots. Higher NO emission were measured in soil from burned plots compared with that from unburned plots and NO fluxes were significantly higher at 10% of WHCmaxcompared with 50% WHCmax, for both treatments
Fig. 7.(A) Emissions of N2O (ng N2O g−1soil dry weight h−1)measured during the day of maximal N2O production after water addition (day 1) and (B) cumulative CO2emissions (mg CO2g−1soil dry weight) over 15 days from soil of burned and unburned plots incubated at 0, 25, 50 and 100% of maximal water holding capacity saturation (WHCmax) and at two temperatures (25◦C or 37◦C). In the small insert is N2O emissions (ng N2O g−1soil dry weight h−1)vs. % of WHCmax. Bars are one standard deviation.
Bio
m
a
ss
m
ic
N
(
g
N
g
-1
SD
W
)
0 500 1000 1500
2000 0% WHCmax25% WHCmax 50 % WHCmax 100 % WHCmax
BURNED UNBURNED
25°C 37°C 25°C 37°C
N
e
t min
e
ra
liza
tio
n
(
g
N
g
-1SD
W
1
5
d
-1)
-2 0 2 4
6 0% WHCmax
25 % WHCmax 50 % WHCmax 100% WHCmax
BURNED UNBURNED
25°C 37°C 25°C 37°C
N
e
t n
itrifica
tio
n
(
g
N
g
-1 SD
W
1
5
d
-1)
-2 0 2 4 6
0% WHCmax 25% WHCmax 50% WHCmax 100% WHCmax
BURNED UNBURNED
25°C 37°C 25°C 37°C
Fig. 8. Microbial biomass N (µg N g−1soil dry weight) and rates of net N mineralization (µg N g−1soil dry weight) and net nitrification (µg N g−1soil dry weight) measured after 2 weeks of incubation in soil from burned and unburned plots incubated at 0, 25, 50 and 100% of WHCmaxand at two temperatures (25◦C or 37◦C).
at time zero, 1 h before watering, data not shown) decreased significantly after 5 days of incubation. At 10% WHCmaxno
N2O production was detected whereas at 50% of WHCmax
N2O emissions never exceeded 0.10 ng N g−1h−1.
4 Discussion
4.1 Soil respiration
Results indicate that fire had a transient effect on soil respi-ration in the studied savanna grassland. Burned plots emitted significantly less CO2 than unburned plots during the first
campaign (one month after burning, dry season); however, this difference was no longer detectable eight months after burning (growing season). A first explanation for the ob-served difference in CO2emissions, one month after
burn-ing, is that fire destroyed the above-ground vegetation, which partly contributed to the maintenance activity of grass roots.
Thus, fire reduced the autotrophic component of the soil res-piration in burned plots. A second explanation is that fire reduced the heterotrophic component of soil respiration by consuming the litter, which represent a source of C for mi-crobes, or by killing part of soil microflora directly. Indeed, a higher content of extractableα-amino-N was found in burned soil one month after fire. Andersson et al. (2004b) reported an increase of dissolved organic C in savanna soils imme-diately after burning and suggested that this may partly de-rive from peptides and proteins released from the microbial biomass killed by heating. However, laboratory data do not indicate a reduction of microbial biomass and activity in the soil from burned plots. Moreover, a comparable amount of CO2was released at 25◦C from the soil sampled in burned
and unburned plots (25–100% WHCmax)and, at 37◦C, CO2
Fig. 9.Emissions of NO (ng NO-N g−1soil dry weight h−1) mea-sured from soil of burned and unburned plots incubated at 10% and 50% of WHCmax.
design did not enable us to establish a conclusive partition-ing of the CO2 flux between autotrophic and heterotrophic
sources. Both laboratory and field data showed that no less than 10 days were necessary to extinguish the CO2pulse
gen-erated by water addition in the dry season, and that the max-imum emission occurred within a day after water addition. Several authors reported a quick response of ecosystem res-piration to rain pulses under dry conditions (Jenerette et al., 2008; Xu and Baldocchi, 2004; Williams et al., 2009), but pulses generally came to an end within one to three days. Eight months after burning, the pulse peak of CO2was
com-parable to the pulse obtained in the first campaign, but its lifetime was shorter (7 days) and the background (unwatered) rate of soil respiration was higher. During this period, both treatments presented similar plant cover density and grass height, and the soil showed a higher content of total C and α-amino N, probably reflecting higher C and N inputs asso-ciated to root growth, turnover and exudation. These con-ditions might have stimulated microbial growth and activity, thereby resulting in higher rates of soil respiration but also in a faster consuming of substrates made available by water addition (shorter pulse lifetime).
Previous studies in Nigeria, Venezuela and South Africa showed no difference in soil CO2emissions between burned
and unburned savannas (Adedeji, 1983; Hao et al., 1988; Zepp et al., 1996). A slight stimulating effect of fire on soil respiration was found in Brazilian cerrado, but only after wa-tering of the soil (Poth et al., 1995). Michelsen et al. (2004) found higher soil respiration in forest and woodland subject to sporadic burning compared with frequently burned grass-lands. In line with the results obtained in the present study, lower soil respiration rates were found in burned grassland savannah areas in Ethiopia compared with unburned areas (Andersson et al., 2004a).
4.2 Methane fluxes
The very low soil water content at the time of measure-ments and its loose structure, mainly dominated by sand, are likely to create favourable conditions for significant methan-otrophic activity (Striegl et al., 1992; Potter et al., 1996; Castaldi and Fierro, 2005; Castaldi et al., 2006). However, our data showed that the unburned grassland plots were a CH4 source or a weak sink. Similar results were also
re-ported for some tropical ecosystems (Hao et al., 1988; Poth et al., 1995; Scharffe et al., 1990; Sanhueza et al., 1994; Zepp et al., 1996: Castaldi et al., 2004; Br¨ummer et al., 2009). In the present study we observed net CH4 emissions even at
7% of WFPS, hence at very dry conditions, which makes it quite unlikely that CH4 derives from anaerobic hotspots of
microbial activity, as hypothesised in other studies (Castaldi et al., 2004; Verchot et al., 2000). A more probable source of CH4might be termite activity, also considering that the study
site presented an extremely high abundance of termite nests. Although great care was taken at the moment of sampling to keep distant from termite nests. It is known that termite activity can affect the soil several meters far from the nest and the pattern of this source is difficult to predict. Fire sig-nificantly reduced the frequency of net CH4emissions, and
this was particularly evident one month after burning. We could hypothesise that fire temporarily reduced termite ac-tivity outside the nest. Indeed, even CH4production inside
the termite nests was significantly reduced in the first months after burning (Castaldi and de Grandcourt, in preparation). Other authors have obtained evidence that clearance of sa-vanna soil surface (grasses and litter) by burning produces a significant reduction of methane emission from the soil-grass system (Poth et al., 1995; Zepp et al., 1996). Indeed, with the destruction of most of the litter, burning reduces the amount of palatable substrate that termites can use, either directly as litter or as soil organic matter. Soil-feeding termites, such as those belonging to the genusCubitermesor those feeding on litter such asNasutitermes, both present in the site, may be affected by substrate reduction due to fire. As observed for CO2 fluxes, the effect of fire on CH4 fluxes was transient.
In fact, eight months after burning the frequency distribution of CH4 fluxes in the two treatments showed no significant
difference.
4.3 Nitrous oxide emissions
As typical of savannas with acidic and nutrient-poor soils (Scholes et al., 1997; Andersson et al., 2004a, b: Castaldi et al., 2006), the grassland ecosystem analysed in this study was characterized by low N2O fluxes. The range of fluxes
reported for undisturbed savanna ecosystems is quite nar-row, going from small uptake values to emissions of few mg N2O-N m−2d−1(Castaldi et al., 2006), except if the soil
in isolated patches of nutrient-rich soil (Otter and Scholes, 2000) or in savannas areas located in valleys characterized by higher soil water retention and accumulation of organic matter (Sanhueza et al., 1990). Higher N2O fluxes in
season-ally dry tropical environments are reported only for forests (Sanhueza et al., 1990; Verchot et al., 1999, Castaldi et al., 2006). A combination of environmental factors contribute to keep N2O fluxes low: good soil drainage, low pH and low
nutrient status (Castaldi et al., 2006). During the dry sea-son the low soil water content is a major controlling factor, which limits the possibility of development of anaerobic mi-crosites, where N2O production could take place (Firestone
and Davidson, 1989; Smith, 1990). In the studied site, the water-filled pore space (WFPS %) was always below 51%, thus below the level at which O2diffusion is sufficiently low
to enable a sharp increase of N2O production (60% – 90%
of WFPS) (Davidson, 1991). Laboratory incubations indi-cated that a significant increase in N2O production is to be
expected only above 75% of WHCmax. This water content
was much higher than the content required to stimulate CO2
production. N availability is also an important limiting fac-tor for N2O production. During the dry season,
mineraliza-tion and nitrificamineraliza-tion activity would probably produce low amounts of mineral N, as demonstrated by laboratory data. At the onset of the rainy season, the increase of soil water content might significantly stimulate mineralization activity leading to an increase of mineral N availability. This would favour the occurrence of pulses of NO and N2O, although
the resprouting of shrubs and growth of herbaceous plants may lead to competition for mineral N between plants and microbes (Bate, 1981). The manipulation rain experiments proposed in this and other studies are probably not sufficient to simulate the conditions occurring at the onset of the rainy season, both in terms of soil water content and mineral N availability. Thus, the response of N2O production to
wa-ter addition observed in this study cannot be taken as rep-resentative of the N2O pulse which would be generated at
the onset of the rainy season. Laboratory data indicated that one small rain event was sufficient to treble NO emission in burned plots, although the pulse was relatively short-lived. Similar results were shown in Brasilian cerrado by Poth et al. (1995) who measured NO fluxes in watered burned sites (1 day or 1 month after fire event) up to three times higher than fluxes from unburned sites. In accordance with our re-sults, Levine et al. (1996) and Johansson et al. (1988) pro-vided evidence that N gaseous emissions in burned savannas and tropical grassland are mostly dominated by NO.
5 Conclusions
Fire increased the availability of extractable N substrates in the soil; it is likely that this fostered higher rates of NO emis-sions measured in the soil from burned plots. Laboratory in-cubation experiments provided evidence that when soil
wa-ter condition were optimal, N2O production was significantly
higher in soil from burned plots. However, in the field, soil water content limited N2O production, even after rain
simu-lation; thus no difference of N2O emission between burned
and unburned plots was observed. Burning did not enhance soil CO2 emissions; on the contrary, a transient
detrimen-tal effect on soil respiration was observed immediately after burning. The studied soil was not, as expected, a CH4sink,
but during part of the year it was a slight CH4source, even
in very dry conditions. Fire seemed to affect the net CH4
flux, shifting CH4 flux distribution towards more negative
values (consumption). Overall, this preliminary data show that fire did not increase post-burning soil GHG emissions in the studied site. However, in order to generalize these find-ings a wider study would be needed to cover spatial variabil-ity of the African landscape mosaic in terms of vegetation, soil characteristics, termites abundance and biodiversity, pos-sibly in the frame of a wider temporal window.
Acknowledgements. Acknowledgements. Financial support for this scientific research was provided by the European Commission through funding of the project “CarboAfrica” (GOCE, 037132) under the VI Framework Programme (FP6).
Edited by: M. Bahn
References
Adedeji, F. O.: Effect of fire on soil microbial activity in Nige-rian southern Guinea savanna, Rev. Ecol. Biol. Sol, 20, 483–492, 1983.
Andersson, M., Michelsen, A., Jensen, M., and Kjoller, A.: Tropi-cal savannah woodland: effects of experimental fire on soil mi-croorganisms and soil emissions of carbon dioxide, Soil Biol. Biochem., 36, 849–858, 2004a.
Andersson, M., Michelsen, A., Jensen, M., Kjoller, A., and Gashew, M.: Carbon stock, soil respiration and microbial biomass in fire-prone tropical grassland, woodland and forest ecosystems, Soil Biol. Biochem., 36, 1707–1717, 2004b.
Ansley, R. J., Dugas, W. A., Heuer, M. L., and Kramp, B. A.: Bowen ratio/energy balance and scaled leaf measurements of CO2flux over burned Prosopsis savanna, Ecol. Appl., 12, 948– 961, 2002.
Bate, G. C.: Nitrogen cycling in savanna ecosystems, in: Terres-trial Nitrogen Cycles, edited by: Clark, F. E. and Rosswall, T., Ecological Bulletin (Stockholm), 33, 463–475, 1981.
Bombelli, A., Henry, M., Castaldi, S., Adu-Bredu, S., Arneth, A., de Grandcourt, A., Grieco, E., Kutsch, W. L., Lehsten, V., Rasile, A., Reichstein, M., Tansey, K., Weber, U., and Valentini, R.: An outlook on the Sub-Saharan Africa carbon balance, Biogeo-sciences, 6, 2193–2205, doi:10.5194/bg-6-2193-2009, 2009. Bond, W. J.: What Limits Trees in C4 Grasslands and Savannas?
Annu. Rev. Ecol. Evol. S, 39, 641–659, 2008.
Breuer, L., Papen, H., and Butterbach-Bahl, K.: N2O emission from tropical forest soils of Australia, J. Geophys. Res., 105, 26353– 26367, 2000.
Br¨ummer, C., Br¨uggemann, N., Butterbach-Bahl, K., Falk, U., Szarzynski, J., Vielhauer, K., Wassmann, R., and Papen, H.: Soil-Atmosphere Exchange of N2O and NO in Near-Natural Savanna and Agricultural Land in Burkina Faso (W. Africa), Ecosystems, 11, 582–600, 2008.
Br¨ummer, C., Papen, H., Wassmann, R., and Br¨uggemann, N.: Fluxes of CH4and CO2from soil and termite mounds in south Sudanian savanna of Burkina Faso (West Africa), Global Bio-geochem. Cy., 23, GB1001, doi:10.1029/2008GB003237, 2009. Butterbach-Bahl, K., Kock, M., Willibald, G. Hewett, B., Buha-giar, S., Papen, H., and Kiese, R.: Temporal variations of fluxes of NO, NO2, N2O, CO2, and CH4 in a tropical rain forest ecosystem, Global Biogeochem. Cy., 18, GB3012, doi:10.1029/2004GB002243, 2004.
Caquet, B., de Grandcourt, A., Thongo Mbou, A., Kinana, A., Epron, D., Saint-Andr´e, L., and Nouvellon, Y.: Soil respiration and belowground carbon allocation in a tropical savanna, Plant Soil, in prep., 2010.
Castaldi, S., Ermice, A., Strumia, S.: Fluxes of N2O and CH4from soils of savannas and seasonally-dry ecosystems, J. Biogeogr., 33, 401–415, 2006.
Castaldi, S. and Fierro, A.: Soil – atmosphere methane exchange in undisturbed and burned Mediterranean shrubland of Southern Italy, Ecosystems, 8(2), 182–190, 2005.
Castaldi, S., De Pascale, R. A., Grace, J., Montes, R., and San Jos´e, J.: Nitrous oxide and Methane fluxes from soil of Orinoco sa-vanna under different land use, Global Change Biol., 10, 1947– 1960. 2004.
Castaldi, S. and Aragosta, D.: Factors influencing nitrification and denitrification variability in a natural and fire disturbed Mediter-ranean shrubland, Soil Biol. Fertil., 36, 418–425, 2002. Castaldi, S. and de Grandcourt A.: CH4fluxes from termite activity
in African grassland savanna and its influence on the CH4flux budget at site, Ecosystems, in prep., 2010.
Christensen, N. L.: Fire and the nitrogen cycle in California cha-parral, Science, 181, 66–68, 1973.
Davidson, E. A.: Fluxes of nitrous oxide and nitric oxide from terrestrial ecosystems, in: Microbial production and con-sumption of greenhouse gases: Methane, nitrogen oxides and halomethanes, edited by: Rogers, J. E. and Whitman, W. B., 219–235, American Society for Microbiology, Washington, D.C., 1991.
Davidson, E. A., Matson, P. A., Vitousek, P. M., Riley, R., Dunkin, K., Garcia-Mendez, G., and Maass, J. M.: Processes regulating soil emission of NO and N2O in a seasonally dry tropical forest, Ecology, 74, 130–139, 1993.
de Grandcourt, A., Thongo Mbou, A., Kinana, A., Ngoyi, S., Minzele, C., Caquet, B., Nouvellon, Y., and Saint-Andr´e, L.: Vegetation dynamics, aboveground and belowground produc-tions in tropical grassland in Congo, J. Tropical Ecol., in prep., 2010.
Dick, J., Skiba, U., and Wilson, J.: The effect of rainfall on NO and N2O emissions from Ugandan agroforest soils, Phyton – Ann. Rei. Bota. A, 41, 73–80, 2001.
Favier, C., de Namur, C., and Dubois, M. A.: Forest progression modes in littoral Congo, Central Atlantic Africa, J. Biogeogr.,
31, 1445–1461, 2004.
Firestone, M. K. and Davidson, E. A.: Microbiological basis of NO and N2O production and consumption in soil, in: Exchange of trace gases between terrestrial ecosystems and the atmosphere, edited by: Andreae, M. O. and Schimel, D. S., 7–21, John Wiley & Sons, New York, USA, 1989.
Fynn, R. W. S., Haynes, R. J., and O’Connor, T. G.: Burning causes long-term changes in soil organic matter content of a South African grassland, Soil Biol. Biochem., 35, 677–687, 2003. Garcia-Montiel, D. C., Steudler, P. A., Piccolo, M., Neill, C.,
Melillo, J. M., and Cerri, C. C.: Nitrogen oxide emissions fol-lowing wetting of dry soils in forest and pastures in Rondonia, Brazil, Biogeochemistry, 64, 319–336, 2003.
Hao, W. M., Scharffe, D., Crutzen, P. J., and Sanhueza, E.: Produc-tion of N2O, CH4and CO2from soils in the tropical savannah during the dry season, J. Atmos. Chem., 7, 93–105, 1988. Hutchinson, G. L. and Mosier, A. R.: Improved soil cover method
for field measurements of nitrous oxide fluxes, Soil Sci. Soc. Am. J., 45, 311–316, 1981.
Huntley, B. J. and Walker, B. H.: Ecology of tropical savannas, Berlin, Springer-Verlag, 1982.
Jenerette, G. D., Scott, R. L., and Huxman, T. E.: Whole ecosystem metabolic pulses following precipitation events, Funct. Ecol., 22, 924–930, 2008.
Johansson, C., Rodhe, H., and Sanhueza, E.: Emissions of NO in tropical savanna and a cloud forest during the dry season, J. Geo-phys. Res.-Atmos, 93, 7180–7192, 1988.
Knicker, H.: How does fire affect the nature and stability of soil organic nitrogen and carbon? A review, Biogeochemistry, 85, 91–118, 2007.
Kovacic, D. A. D., Swift, M., Ellis, J. E., and Hakonson, T. E.: Immediate effects of prescribed burning on mineral soil nitrogen in ponderosa pine of New Mexico, Soil Science, 141, 71–76, 1986
Levine, J. S., Winstead, E. L., Parsons, D. A. B., Scholes, M. C., Scholes, R. J., Cofer, W. R., Cahoon, D. R., and Sebacher D. I.: Biogenic soil emissions of nitric oxide (NO) and nitrous oxide (N2O) from savannas in South Africa: The impact of wetting and burning, J. Geophys. Res.-Atmos, 101(D19), 23689–23697, 1996.
Menault, J. C.: Evolution of plots protected from fire since 13 years in a guinea savanna of Ivory Coast, 4th Symp. Tropical Ecology, Panama, 1977.
Menaut, J. C., Abbadie, L., and Vitousek, P. M.: Nutrient and organic matter dynamics in tropical ecosystems, in: Fire in the Environment: The Ecological, Atmospheric and Climatic Importance of Vegetation Fires, edited by: Crutzen, P. J. and Goldammer, J. G., Wiley, Chichester, 215–231, 1993.
Michelsen, A., Andersson, M., Jensen, M., Kjøller, A., and Gashew, M.: Carbon stocks, soil respiration and microbial biomass in fire-prone tropical grassland, woodland and forest ecosystems, Soil Biol. Biochem., 36, 1707–1717, 2004.
Mills, A. J. and Fey, M. V.: Frequent fires intensify soil crusting: Physico-chemical feedback in the pedoderm of long-term burn experiments in South Africa, Geoderma, 121, 45–64, 2004. Moore, S. and Stein, W. H.: A modified ninhydrin reagent for
the photometric determination of amino acids and related com-pounds, J. Biol. Chem., 211, 907–913, 1954.
mea-suring the microbial biomass in soils following recent additions of wheat straw and the characterization of the biomass that de-velops, Soil Biol. Biochem., 22, 685–694, 1990.
Ojima, D., Schimel, D. S., Parton, W. J., and Owensby, C. E.: Long and short-term effects of fire on nitrogen cycling in tall-grass prairie, Biogeochemistry, 24, 67–84, 1994.
Otter, L. B. and Scholes, M. C.: Methane sources and sinks in a pe-riodically flooded South African savanna, Global Biogeochem. Cy., 14, 97–111, 2000.
Pinto, A. S., Bustamante, M. M. C, Kisselle, K., Burke, R., Zepp, R., Viana, L. T., Varella, R. F., and Molina, M.: Soil emissions of N2O, NO, and CO2in Brazilian savannas: Effects of vege-tation type, seasonality, and prescribed fires, J. Geophys. Res., 107(D20), 8089, doi:10.1029/2001JD000342, 2002.
Poth., M., Anderson, I. C., Miranda, H. S., Miranda, A. C., and Rig-gan, P. G.: The magnitude and persistence of soil NO, N2O, CH4 and CO2fluxes from burned tropical savanna in Brasil, Global Biogeochem. Cy., 9, 503–513, 1995.
Potter, C. S., Davidson, E. A., and Verchot, L. V.: Estimation of global biogeochemical controls and seasonality in soil methane consumption, Chemosphere, 32, 2219–2246, 1996.
Prieto-Fernandez, A., Carballas, M., and Carballas, T.: Inorganic and organic N pools in soils burned or heated: immediate alter-ation and evolution after forest wildfires, Geoderma, 121, 291– 306, 2004.
Raison, R. J.: Modification of the soil environment by vegetation fires, with particular reference to nitrogen transformations: a re-view, Plant Soil 51, 73–108, 1979.
Rees, R. M., Wuta, M., Furley, P. A., and Li, C.: Nitrous oxide fluxes from savanna (miombo) woodlands in Zimbabwe, J. Bio-geogr., 33, 424–437, 2006.
Saarnak, C. F.: A shift from natural to human-driven fire regime: implications for trace-gas emissions, Holocene, 11, 373–375, 2001.
Sanhueza, E., Cardenas, L., Donoso, L., and Santana, M.: Effect of plowing on CO2, CO, CH4, N2O and NO fluxes from tropical savannah soils, J. Geophys. Res., 99(D8), 16429–16434, 1994. Sanhueza, E., Hao, W. M., Scharffe, D., Donoso, L., and Crutzen, P.
J.: N2O and NO emissions from soils of the Northern Part of the Guayana Shield, Venezuela, J. Geophys. Res., 95, 22481–22488, 1990.
Sankaran, M., Hanan, N. P., Scholes, R. J., Ratnam, J., Augustine, D. J., Cade, B. S., Gignoux, J., Higgins, S. I., Le Roux, X., Lud-wig, F., Ardo, J., Banyikwa, F., Bronn, A., Bucini, G., Caylor, K. K., Coughenour, M. B., Diouf, A., Ekaya, W., Feral, C. J., Febru-ary, E. C., Frost, P. G. H., Hiernaux, P., Hrabar, H., Metzger, K. L., Prins, H. H. T., Ringrose, S., Sea, W., Tews, J., Worden, J., and Zambatis, N.: Determinants of woody cover in African sa-vannas, Nature, 438, 846–849, 2005.
Scharffe, D., Hao, W. M., Donoso, L., Crutzen, P. J., and Sanhueza, E.: Soil fluxes and atmospheric concentration of CO and CH4in the northern part of the Guayana Shield, Venezuela, J. Geophys. Res., 95, 22475–22480, 1990.
Scholes, M. C., Martin, R., Scholes, R. J., Parsons, D., and Win-stead, E:. NO and N2O emissions from savanna soils following the first simulated rains of the season, Nutr. Cycl. Agroecosys., 48, 115–122, 1997.
Scholes, R. J. and Hall, D. O.: The carbon budget of tropicals sa-vannas, woodlands and grasslands, in: Global Change: Effects
on Coniferous Forest and Grasslands, edited by: Breymeyer, A. I., Hall, D. O., Melillo, J. M., and Agren, G. I., SCOPE, 56, 69– 100, 1996.
Scholes, R. J. and Walker, B. H.: An African Savanna: Synthesis of the Nylsvley Study, Cambridge Studies in Applied Ecology and Resources Management, Cambridge University Press, pp. 300, 2004.
Singh, R. S., Raghubanshi, A. S., and Singh, J. S.: Nitrogen-mineralization in dry tropical savanna: effects of burning and grazing, Soil Biol. Biochem., 23, 269–273, 1991.
Singh, R. S.: Changes in soil nutrients following burning of dry tropical savanna, Int. J. Wildland Fire, 4, 187–194, 1994. Smith, K. A.: Anaerobic zones and denitrification in soil:
mod-elling and measurements, in: Denitrification in Soil and Sed-iment, edited by: Revsboech, N. P. and Sørensen, J., Plenum Press, New York, 228–240, 1990.
Smith, K. A., Clayton, H., McTaggart, I. P., Thomson, P. E., Arah, J. R. M., and Scott, A.: The measurement of nitrous oxide emis-sions from soil by using chambers, Phil. Trans. R. Soc. Lond. 351, 327–338, 1995.
Snyman, H. A.: Short-term response of rangeland following an un-planned fire in terms of soil characteristics in a semi-arid climate of South Africa, J. Arid. Environ., 55, 160–180, 2003.
Striegl, R. G., McConnaughey, T. A., Thorstenson, D. C., Weeks, E. P., and Woodward, J. C.: Consumption of atmospheric methane by desert soils, Nature, 357, 145–147, 1992.
Swaine, M. D., Hawthorne, W. D., and Orgle, T. K.: The effects of fire exclusion on savanna vegetation at Kpong, Ghana, Biotrop-ica, 24, 166–172, 1992.
Trollope, W. S. W.: Veld management with specific reference to game ranching in the grassland and savanna areas of South Africa, Koedoe, 33, 77–86, 1990.
van Haren, J. L. M., Handley, L. L., Biel, K. Y., Kudeyarov, V. N., McLain, J. E. T., Martens, D. A., and Colodner, D. C.: Drought-induced nitrous oxide flux dynamics in an enclosed tropical for-est, Glob. Change Biol., 11, 1247–1257, 2005.
Verchot, L. V., Davidson, E. A., Cattˆanio, J. H., and Ackerman, I. L.: Land use change and biogeochemical controls of methane fluxes in soils of Eastern Amazonia, Ecosystems, 3, 41–56, 2000. Verchot, L. V., Davidson, E. A., Cattˆanio, J. H., Ackerman, I. L., Er-ickson, H. E., and Keller, M.: Land use change and biogeochem-ical controls of nitrogen oxide emissions from soils in eastern Amazonia, Global Biogeochem. Cy., 13, 31–46, 1999.
White, R. P., Murray, S., and Rohweder, M.: Pilot Analysis of Global Ecosystems (PAGE): Grasslands, World Resources Insti-tute, Washington D.C., pp. 70, 2000.
Williams, C. A., Hanan, N., Scholes, R. J., and Kutsch, W.: Com-plexity in water and carbon dioxide fluxes following rain pulses in an Africa savanna, Oecologia, 161, 469–480, 2009.
Xu, L. K. and Baldocchi, D. D.: Seasonal variation in carbon diox-ide exchange over a Mediterranean annual grassland in Califor-nia, Agric. For. Meteorol., 123, 79–96, 2004.