BGD
8, 12197–12245, 2011
Decadal variability of soil GHG fluxes
G. J. Luo et al.
Title Page
Abstract Introduction
Conclusions References
Tables Figures
◭ ◮
◭ ◮
Back Close
Full Screen / Esc
Printer-friendly Version Interactive Discussion
Discussion
P
a
per
|
Dis
cussion
P
a
per
|
Discussion
P
a
per
|
Discussio
n
P
a
per
|
Biogeosciences Discuss., 8, 12197–12245, 2011 www.biogeosciences-discuss.net/8/12197/2011/ doi:10.5194/bgd-8-12197-2011
© Author(s) 2011. CC Attribution 3.0 License.
Biogeosciences Discussions
This discussion paper is/has been under review for the journal Biogeosciences (BG). Please refer to the corresponding final paper in BG if available.
Decadal variability of soil CO
2
NO, N
2
O,
and CH
4
fluxes at the H ¨oglwald Forest,
Germany
G. J. Luo1, N. Br ¨uggemann2, B. Wolf1, R. Gasche1, and K. Butterbach-Bahl1
1
Institute for Meteorology and Climate Research, Karlsruhe Institute of Technology, Garmisch-Partenkirchen, Germany
2
Forschungszentrum J ¨ulich GmbH, Institute of Bio- and Geosciences – Agrosphere (IBG-3), J ¨ulich, Germany
Received: 30 November 2011 – Accepted: 11 December 2011 – Published: 19 December 2011
Correspondence to: K. Butterbach-Bahl ([email protected])
BGD
8, 12197–12245, 2011
Decadal variability of soil GHG fluxes
G. J. Luo et al.
Title Page
Abstract Introduction
Conclusions References
Tables Figures
◭ ◮
◭ ◮
Back Close
Full Screen / Esc
Printer-friendly Version Interactive Discussion
Discussion
P
a
per
|
Dis
cussion
P
a
per
|
Discussion
P
a
per
|
Discussio
n
P
a
per
|
Abstract
Besides agricultural soils, temperate forest soils have been identified as significant sources of or sinks for important atmospheric trace gases (N2O, NO, CH4, and CO2). Although the number of studies for this ecosystem type increased more than tenfold during the last decade, studies covering an entire year and spanning more than 1–2 yr 5
remained scarce. This study reports the results of continuous measurements of soil-atmosphere C- and N-gas exchange with high temporal resolution carried out since 1994 at the H ¨oglwald Forest spruce site, an experimental field station in Southern
Ger-many. Annual soil N2O emission, NO emission, CH4uptake, and CO2emission (1994–
2010) varied in a range of 0.2–3.2 kg N2O-N ha
−1
yr−1, 6.4–11.4 kg NO-N ha−1yr−1, 10
0.9–3.5 kg CH4-C ha−1yr−1, and 7.0–9.2 t CO2-C ha−1yr−1, respectively. The observed high fluxes of N-trace gases are most likely a consequence of high rates of atmospheric nitrogen deposition (>20 kg N ha−1yr−1) of NH3 and NOx to our site. For N2O
cumu-lative annual emissions were>0.8 kg N2O-N ha−1yr−1 high in years with freeze-thaw
events (5 out 14 yr). This shows that long-term, multi-year measurements are needed 15
to obtain reliable estimates of N2O fluxes for a given ecosystem. Cumulative values
of soil respiratory CO2 fluxes were highest in years with prolonged freezing periods
e.g. the years 1996 and 2006, i.e. years with below average annual mean soil
temper-atures and high N2O emissions. The results indicate that long freezing periods may
even drive increased CO2 fluxes not only during soil thawing but also throughout the
20
following growing season.
Furthermore, based on our unique database on GHGs we analyzed if soil tempera-ture, soil moistempera-ture, or precipitation measurements can be used to approximate GHGs at weekly, monthly, or annual scale. Our analysis shows that simple-to-measure envi-ronmental drivers such as soil temperature or soil moisture are suitable to approximate 25
fluxes of NO and CO2in weekly and monthly scales with a reasonable uncertainty
BGD
8, 12197–12245, 2011
Decadal variability of soil GHG fluxes
G. J. Luo et al.
Title Page
Abstract Introduction
Conclusions References
Tables Figures
◭ ◮
◭ ◮
Back Close
Full Screen / Esc
Printer-friendly Version Interactive Discussion
Discussion
P
a
per
|
Dis
cussion
P
a
per
|
Discussion
P
a
per
|
Discussio
n
P
a
per
|
fluxes. This is most likely due to the complexity of involved processes and counteract-ing effects of soil moisture and temperature, specifically with regard to N2O production and consumption by denitrification and microbial community dynamics.
1 Introduction
Temperate forest soils are significant sources of atmospheric greenhouse gases 5
(GHG), namely CO2, N2O and NO (Brumme and Beese, 1992; Castro et al., 1993;
Butterbach-Bahl et al., 1998; van Dijk and Duyzer, 1999; Pilegaard et al., 2006; Phillips
et al., 2010), and significant sinks for atmospheric CH4 (Borken and Brumme, 1997;
Henkel, 2000; Smith et al., 2000; Brumme and Borken, 1999; Butterbach-Bahl and Papen, 2002; Borken and Beese, 2006). Based on an ISI search, studies on trace 10
gas exchange between temperate forest soils and the atmosphere have increased by a factor of 12 from the decade 1990–2000 to the decade 2001–2010. Nevertheless, continuous field measurements over long time periods (>1–2 yr) at high temporal
res-olution are still required to improve our understanding of the biogeochemical N and C turnover processes and thereby temporal variability of GHG fluxes on daily to multi-year 15
scales.
N-trace gases in forest soil are produced (and consumed) mainly by the microbiolog-ical processes nitrification and denitrification (Firestone and Davidson, 1989; Conrad,
1996). Soil microorganisms, for instance chemolithotrophic CH4 oxidizers, catalyze
the uptake of atmospheric CH4by forest soils as well (Roslev et al., 1997; Schimel and 20
Gulledge, 1998; Henckel et al., 2000). Like all other biogenic processes, the soil
micro-biological processes involved in soil-atmosphere GHG exchange are strongly affected
by a number of soil environmental factors and ecological drivers such as temperature, moisture, precipitation, soil aeration, pH or texture. Among these parameters, soil moisture and temperature are identified as key drivers for soil-atmosphere exchange 25
BGD
8, 12197–12245, 2011
Decadal variability of soil GHG fluxes
G. J. Luo et al.
Title Page
Abstract Introduction
Conclusions References
Tables Figures
◭ ◮
◭ ◮
Back Close
Full Screen / Esc
Printer-friendly Version Interactive Discussion
Discussion
P
a
per
|
Dis
cussion
P
a
per
|
Discussion
P
a
per
|
Discussio
n
P
a
per
|
and process studies (Schindlbacher et al., 2004). The effects of soil temperature on
soil-atmosphere exchange of N2O, NO, CH4and CO2are mostly direct, and increases
in temperature result in increasing emissions as long as other factors are not limiting. In contrast, the effect of soil moisture is more complex. In addition to its function as a transport medium for nutrients such as NO−3 and NH+4, soil water influences the rate 5
of O2supply and thereby determines whether aerobic processes such as nitrification or anaerobic processes such as denitrification prevail within the soil (Schindlbacher et al., 2004; Pilegaard et al., 2006). However, the relative importance of a specific parameter is variable, and interactive effects of environmental drivers on soil microbial processes are highly complex, specifically if competitions of microbes with plants for nutrients, 10
water, and nutrient leaching processes are considered. Furthermore, many of these relationships remain unexplored due to the lack of sufficiently detailed observational data.
Interannual variability of soil trace gas fluxes has hardly been explored. Specifically with regard to soil N2O fluxes recent reports about the importance of freeze-thaw N2O 15
pulse emissions for cumulative annual emissions from natural and semi-natural ecosys-tems such as grasslands (Wolf et al., 2010) or forests (e.g. Papen and Butterbach-Bahl, 1999; Teepe et al., 2001) imply that fluxes may vary significantly. Significant interannual variations in soil CO2 fluxes have been reported as well (Phillips et al., 2010). Therefore, soil flux datasets comprising only sporadic measurements or not 20
covering complete seasons and/or years may not be representative for a site. Long-term datasets are rare, but important to better understand environmental controls of ecosystem C and N turnover and associated exchange of C and N and compounds between the biosphere and atmosphere. For example, more than ten years (1992– 2004) of eddy covariance (EC) measurements at Harvard Forest demonstrated that 25
interannual variability of CO2ecosystem fluxes are controlled by climate variability and ecosystem factors (Urbanski et al., 2007; Phillips et al., 2010). Long-term, multi-year
measurements of soil CH4and N2O fluxes are even scarcer than measurement of soil
BGD
8, 12197–12245, 2011
Decadal variability of soil GHG fluxes
G. J. Luo et al.
Title Page
Abstract Introduction
Conclusions References
Tables Figures
◭ ◮
◭ ◮
Back Close
Full Screen / Esc
Printer-friendly Version Interactive Discussion
Discussion
P
a
per
|
Dis
cussion
P
a
per
|
Discussion
P
a
per
|
Discussio
n
P
a
per
|
at the Solling, Central Germany (Borken and Brumme, 1997; Brumme and Borken, 1999; Borken et al., 2002) started in form of measuring campaigns in 1990. For the spruce site at the H ¨oglwald Forest continuous soil trace gas flux measurements started in November 1993. Though part of the dataset has been published earlier (e.g., Papen and Butterbach-Bahl, 1999; Butterbach-Bahl et al., 2002; Wu et al., 2010), the entire 5
dataset – covering the period from 1994–2010 (incl. a two-year break in 1998/1999) or meanwhile 15 yr of observation – remains unpublished so far. Moreover, this dataset has never been evaluated with regard to multi-year relationships between soil environ-mental parameters such as soil moisture, temperature or precipitation and soil trace gas fluxes. Also inter-relationships between individual C- and N-trace gases have 10
hardly been evaluated so far, except for the study of Wu et al. (2010), with the latter study only using less than one-third of the full dataset. Therefore the main objectives of this study are,
a) to summarize 15 yr of continuous trace gas measurements at the H ¨oglwald site and to evaluate seasonal and interannual variability of fluxes,
15
b) to use the multi-year dataset to elucidate relationships between environmental parameters and soil trace gas fluxes,
c) to test if easy-to-measure environmental parameters such as soil moisture and soil temperature can be used to approximate trace gas fluxes at weekly, monthly or annual time scales.
20
2 Material and methods
2.1 Experimental site
BGD
8, 12197–12245, 2011
Decadal variability of soil GHG fluxes
G. J. Luo et al.
Title Page
Abstract Introduction
Conclusions References
Tables Figures
◭ ◮
◭ ◮
Back Close
Full Screen / Esc
Printer-friendly Version Interactive Discussion
Discussion
P
a
per
|
Dis
cussion
P
a
per
|
Discussion
P
a
per
|
Discussio
n
P
a
per
|
atmospheric nitrogen (N) deposition at a rate of 20–30 kg N ha−1yr−1, due to emissions from livestock farming, N fertilizer use, and NOxemissions from traffics and industries, resulted in N saturation of the forests in this region (Butterbach-Bahl et al., 1997, 2002).
Field measurements of soil CH4, CO2, N2O and NO fluxes and simultaneous
monitor-ing of climate and soil environmental parameters were performed in an old spruce 5
plantation (48.50◦N, 11.17◦E), established around 1904. The site is 540 m a.s.l. and the mean annual precipitation is approx. 932 mm, while the mean annual temperature is 8.6◦C (values for the period 2004–2010). The soil at the experimental site is a Typic Hapludalf (FAO: dystric cambisol), strongly acidified in the top soil and weakly aquic in the argillic horizon (Kreutzer, 1995). The soil pH value (measured in 0.1 M CaCl2) is 10
2.9–3.2 in the organic layer and 3.6–4.0 in the uppermost mineral soil layer (Kreutzer, 1995). Further information about the H ¨oglwald Forest site can be found in Kreutzer (1995), Kreutzer and Weiss (1998), Butterbach-Bahl et al. (2002) or Wu et al. (2010).
2.2 Measurements of soil CH4, CO2, N2O, and NO fluxes
Continuous measurements of complete annual cycles of soil-atmosphere trace gas 15
fluxes started in late 1993 at the spruce site. The automated measuring systems at the H ¨oglwald sites have been described previously by (Butterbach-Bahl et al., 1997, 1998; Papen and Butterbach-Bahl, 1999; Gasche and Papen, 1999).
In brief: five chambers of the closed type were used for N2O and CH4 flux
de-terminations, and five dynamic measurement chambers plus one reference cham-20
ber were used for NO and CO2 flux measurements. The chambers (dimensions:
0.5 m×0.5 m×0.15 m, length×width×height) consisted of aluminum frames in which
perspex panes were fixed. Only a small stainless steel frame of 2.0 cm, which was fixed at the frame of the chambers, was sunk into the organic layer of the soil with care in order to avoid cutting of the fine root mat. For measurements of N2O and CH4fluxes 25
the covers of the chambers were opened and closed automatically in an angle of 90◦
BGD
8, 12197–12245, 2011
Decadal variability of soil GHG fluxes
G. J. Luo et al.
Title Page
Abstract Introduction
Conclusions References
Tables Figures
◭ ◮
◭ ◮
Back Close
Full Screen / Esc
Printer-friendly Version Interactive Discussion
Discussion
P
a
per
|
Dis
cussion
P
a
per
|
Discussion
P
a
per
|
Discussio
n
P
a
per
|
15 min within the 60 min closure time. The temporal resolution of flux measurements was 2 h for N2O and CH4fluxes. N2O and CH4concentrations in the sample air were determined by gas chromatography using a gas chromatograph (Shimadzu GC 14,
Duisburg, Germany) equipped with a63Ni electron capture detector (ECD). Water
va-por and CO2in sample air were removed by a permapure dryer and a pre-column filled
5
with Ascarite (sodium hydroxide-coated silica), respectively. The GC was equipped with a stainless steel column packed with Hayesep N (3 m, 1/8 inch, 60/80 mesh). The
oven and detector temperature was 60 and 340◦C. The carrier gas flux (N2) amounted
to of 20 ml min−1. Automatic calibration of the N2O/CH4 measuring system was
per-formed every 2 h using standard gas (0.4 ppmv N2O and 4000 ppmv CH4 in 79 % N2
10
and 21 % O2, Messer Griesheim, Germany). Fluxes were calculated on basis of the
linear/non-linear increase/decrease of gas concentrations with time, thereby using the
r2 value to judge which type of curve fitting was finally used for flux calculation. For
CH4 we predominantly observed a decrease of CH4 concentrations with time, which
in most cases could be best described with an exponential decay curve. Changes of 15
N2O concentrations in the closed chambers could mostly be best described by a linear
regression.
For measurements of soil NO and CO2 fluxes, the dynamic chambers were closed
for 6 min and re-opened again for 6 min. After re-opening of the measuring chambers, gas samples were drawn from the reference chamber that was sealed towards the soil. 20
Since during a 6-min period gas samples could only be taken from one out of five
chambers, the respective 12 min cycle (measuring chamber+reference chamber) was
repeated five times to sample all chamber plots. Thus, the temporal resolution was 1 h. During sampling, ambient air was sucked at a constant rate (50 l min−1) through the chambers by means of a sampling pump and transferred via PTFE tubing (inner 25
diameter: 10 mm; length 20 m, internal volume: 1.6 l) to the analyzers, i.e. a
chemolu-minescence detector for NO/NO2(CLD 770 AL ppt and photolysis converter PLC 760,
Eco Physics AG, Switzerland) and an infrared gas analyzer (BINOS 100, Rosemount,
BGD
8, 12197–12245, 2011
Decadal variability of soil GHG fluxes
G. J. Luo et al.
Title Page
Abstract Introduction
Conclusions References
Tables Figures
◭ ◮
◭ ◮
Back Close
Full Screen / Esc
Printer-friendly Version Interactive Discussion
Discussion
P
a
per
|
Dis
cussion
P
a
per
|
Discussion
P
a
per
|
Discussio
n
P
a
per
|
a multigas calibrator (Eco Physics AG, Switzerland) using standard gas (1 ppm NO in synthetic air, Messer Griesheim, Germany), which was diluted with synthetic air to
a final NO concentration of 10 ppb. Determination of NO, NO2and O3concentrations
in ambient air and at the outlet of the chambers, calculation of NO fluxes and efficiency
of photolytic cleavage of NO2 into NO were described in detail by Butterbach-Bahl
5
et al. (1997). The calculation of CO2 fluxes are in principle similar to the calculation scheme of NO fluxes, with the difference that the CO2 analyzer detected the diff
er-ence between referer-ence and measuring chambers directly. The CO2 analyzer was
calibrated regularly with two reference gases (400 and 450 ppm CO2 in synthetic air,
Messer Griesheim, Germany) by applying one gas simultaneously to both cuvettes of 10
the instrument for setting the zero point, and the two gases for setting the span. All fluxes were corrected for temperature and air pressure. Detailed descriptions of the automated measuring systems including design of chambers, gas chromatographic conditions and modes of calculation of flux rates can be found in previous publications (Butterbach-Bahl et al., 1997; Gasche and Papen, 1999; Rosenkranz et al., 2006; Wu 15
et al., 2010). Gaps originating from instrumental failure were filled by linear interpola-tion between measured fluxes for calculainterpola-tion of cumulative annual emissions.
2.3 Soil environmental and climate measurements
Daily precipitation and air temperature at 2 m a.g.l. from 1994 to 2010 were obtained from the German Weather Service station Augsburg-M ¨uhlhausen, which is about 20 km 20
northwest from the H ¨oglwald Forest site. Soil temperatures at various depths (organic layer, 5, 10, 15 and 20 cm) were measured every minute by PT100 probes (IMKO GmbH, Germany) in close vicinity to the chambers. Hourly soil moisture measurements were carried out with horizontally installed TDR probes (IMKO GmbH, Germany, or UMS, Germany) at 10 cm soil depth from 1994 to 2010.
25
BGD
8, 12197–12245, 2011
Decadal variability of soil GHG fluxes
G. J. Luo et al.
Title Page
Abstract Introduction
Conclusions References
Tables Figures
◭ ◮
◭ ◮
Back Close
Full Screen / Esc
Printer-friendly Version Interactive Discussion
Discussion
P
a
per
|
Dis
cussion
P
a
per
|
Discussion
P
a
per
|
Discussio
n
P
a
per
|
– support vector machine (SVM) – was employed. The SVM method was based on a statistical learning algorithm and had been successfully applied to bioinformatics, data mining, surface temperature prediction, and hydrology. The fundamental principle of SVM and its formulation were described in detail by Kecman (2001). Daily meteoro-logical input data, required as model drivers, i.e. minimum and maximum temperature, 5
mean relative humidity, total precipitation, sunshine duration, mean degree of cloud cover, mean wind force from 1994 to 2010, were either obtained from continuous mea-surements at the H ¨oglwald Forest site or from the German Weather Service station Augsburg-M ¨uhlhausen. Since soil moisture was not only determined by observations of the very day, meteorological variables were aggregated to different additional cumu-10
lative sums (i.e., 1, 2, 5, 10, 15, and 30 days previously) for creating a training data set. The best 13 variables, which could explained more than 93 % of the variance in the data set, were used to predict soil water content for the years when soil moisture was missing. To train the support vector machines, the R-package e1071 was used (Dimitriadou et al., 2011; R Development Core Team, 2011).
15
2.4 Regression models for trace gas flux calculation
Long-term observations of soil trace gas fluxes are extremely costly, therefore, to es-timate annual fluxes, simple though site specific empirical model based on easy to measure soil environmental or meteorological parameters is an appealing approach. To develop and assess empirical models, weekly aggregated data, monthly aggregated 20
data and data aggregated within comparatively larger temporal resolutions were all split into two subsets. One of them with about 50 % data of the entire dataset was used to determine model parameters using multivariate linear regression (first order), while the
other half of the dataset was used to validate the obtained empirical model. Diff
er-ent models were compared according to their explanatory power and the explanatory 25
BGD
8, 12197–12245, 2011
Decadal variability of soil GHG fluxes
G. J. Luo et al.
Title Page
Abstract Introduction
Conclusions References
Tables Figures
◭ ◮
◭ ◮
Back Close
Full Screen / Esc
Printer-friendly Version Interactive Discussion
Discussion
P
a
per
|
Dis
cussion
P
a
per
|
Discussion
P
a
per
|
Discussio
n
P
a
per
|
non-linearity and non-normality of the residuals and to reinforce the prerequisites for multivariate linear regression, the logarithm-transformed fluxes were used in the re-gression models.
2.5 Statistical analysis
Linear and nonlinear regression analysis and Pearson Correlation were used to identify 5
significant positive or negative relations between trace gas fluxes and environmental drivers. Significances of differences were either tested by using F-statistics in ANOVA
(analysis of variance) or by using a parametricT-test (SPSS 10, SPSS Inc.). In
mul-tivariate linear regression analysis, the co-linearity diagnostics, homoscedasticity, nor-mality of residuals, and the Durbin-Watson test for autocorrelation were included. 10
3 Results
3.1 Soil moisture modeling
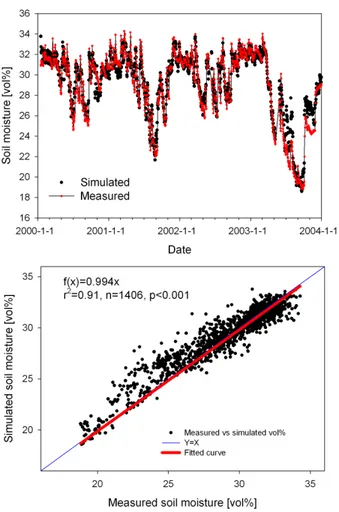
Measured and simulated soil volumetric water contents were compared from 2000 to 2003 in order to validate the performance of SVM regression modeling. Figure 1 showed that the SVM approach was able to capture the seasonal dynamics of changes 15
precisely (R2=0.91, n=1406). The magnitudes of simulated soil volumetric water
contents were in good agreement (RMSE=1.06) with measured values in 10 cm soil
depth at the spruce site, though simulated values generally tended to underestimate measured soil moisture values by<1 % (Fig. 1).
3.2 Variability of environmental drivers
20
Following gap filling and harmonization for soil moisture measured by different sensors
in different periods we calculated annual mean temperature, annual mean moisture,
BGD
8, 12197–12245, 2011
Decadal variability of soil GHG fluxes
G. J. Luo et al.
Title Page
Abstract Introduction
Conclusions References
Tables Figures
◭ ◮
◭ ◮
Back Close
Full Screen / Esc
Printer-friendly Version Interactive Discussion
Discussion
P
a
per
|
Dis
cussion
P
a
per
|
Discussion
P
a
per
|
Discussio
n
P
a
per
|
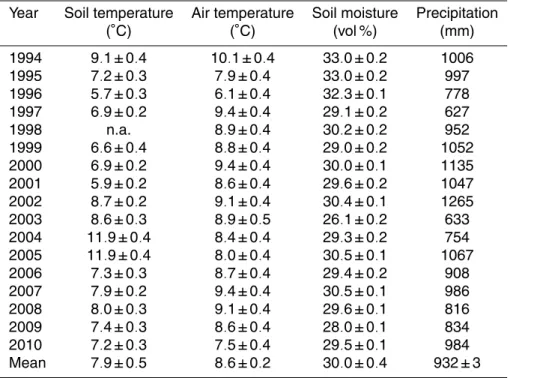
soil moisture, and precipitation had a pronounced interannual variability. For instance, annual precipitation in the relatively dry years 1997 and 2003 was much lower than in the relatively wet years 2000 and 2002, leading to a large range of annual precip-itation (627–1265 mm). The mean value of 932 mm for the whole observation period 1994–2010 was approx. 40 mm higher than the measured (892 mm) value by Rothe 5
et al. (2002) for the period 1994 to 1997. Maximum soil moisture values were observed in early spring, due to snow melt, soil thawing, and spring rains. 2003 was an excep-tionally dry year with only 633 mm of rainfall. In this year mean annual soil moisture in 10 cm soil depth was 26.1 %, i.e. 4 % lower than the mean for the entire observation
period. The mean air temperature was 8.6◦C in our study period (1994–2010), which
10
was 1◦C higher as compared to observations by Rothe et al. (2002).
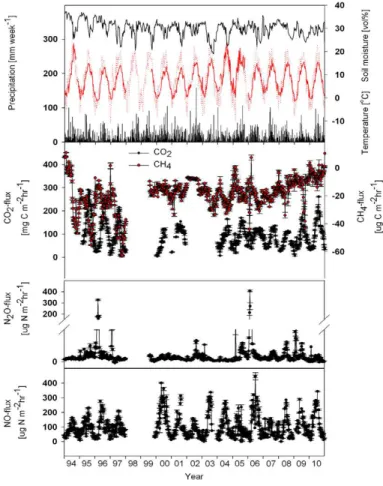
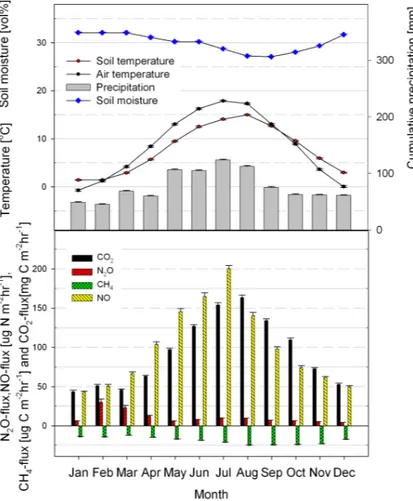
3.3 Seasonal and interannual dynamics of trace gas fluxes
Subdaily measured fluxes were stepwise aggregated to daily, weekly, monthly, and an-nual average values. The anan-nual mean soil-atmosphere trace gas exchange was cal-culated based on the subdaily measurements. Our analysis revealed substantial sea-15
sonal and interannual variation (Figs. 2 and 3). Over the entire observation period the soil of H ¨oglwald spruce forest functioned as a sink for atmospheric CH4. Highest mean
monthly uptake rates of 20–30 µg CH4-C m
−2
h−1were usually observed at the end of
summer or in autumn (Fig. 3). Seasonal patterns of soil N2O fluxes were characterized by pulse emission events, which were mostly associated with spring soil thawing (2– 20
10 weeks) following long soil freezing periods. Therefore, highest mean monthly N2O
fluxes were observed in February and March with average monthly mean values
be-ing in the range of 25–35 µg N2O-N m
−2
h−1 (Fig. 3). A seasonal, temperature-driven
variation in the magnitude of N2O fluxes was also evident, but less pronounced. In
contrast to N2O emissions with late winter maximum values, the seasonal patterns
25
of NO and CO2 soil-atmosphere exchange followed the seasonal course of soil
tem-perature, with the maximum of mean NO and CO2 emission rates in July and
BGD
8, 12197–12245, 2011
Decadal variability of soil GHG fluxes
G. J. Luo et al.
Title Page
Abstract Introduction
Conclusions References
Tables Figures
◭ ◮
◭ ◮
Back Close
Full Screen / Esc
Printer-friendly Version Interactive Discussion
Discussion
P
a
per
|
Dis
cussion
P
a
per
|
Discussion
P
a
per
|
Discussio
n
P
a
per
|
significantly increased in February as compared to mean fluxes in January and March, possibly due to an increased soil microbial activity during the period of soil thawing (Fig. 3). NO fluxes were on average approximately one order of magnitude higher than N2O fluxes (Figs. 2 and 3; Table 2) during most of the observation period.
The pronounced interannual variability in meteorological parameters was also mir-5
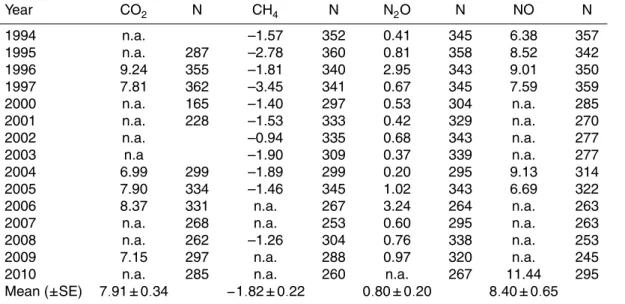
rored by an evident interannual variability in soil trace gas fluxes (Table 2). Annual
soil emission of N2O, NO, and CO2 fluxes varied between 1994 and 2010 in a range
of 0.2–3.24 kg N2O-N ha−1yr−1, 6.38–11.44 kg NO-N ha−1yr−1, and 6.99–9.24 t CO2
-C ha−1yr−1, respectively. The mean annual emissions of N2O, NO, and CO2 from
the H ¨ogwald soil for the years 1994–2010 were 0.80±0.20 kg N2O-N ha−1yr−1 (±SE), 10
8.4±0.65 kg NO-N ha−1yr−1, and 7.91±0.34 t CO2-C ha−1yr−1, respectively.
Com-pared to NO and CO2 fluxes, large interannual fluctuations of N2O were observed
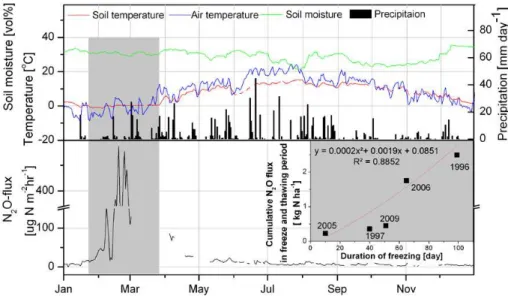
due to peak emissions during spring thawing after long frost periods in 1996, 1997, 2005, 2006, and 2009. This meant that out of 15 observational years significant
freeze-thaw pulses of N2O emissions were observed only in five years. We also found
15
a strong tendency that the length of the frost period is positively correlated to the
mag-nitude of soil N2O emissions (Fig. 4). A quadratic fit between the duration of frost
and the cumulative emission was found. Annual atmospheric uptake of CH4 ranged
from 0.94 to 3.45 kg CH4-C ha−1yr−1. The mean annual uptake rate of atmospheric
CH4 was 1.82±0.22 kg CH4-C ha−1yr−1. Highest CH4 uptake was observed in 1997 20
(3.45 kg CH4-C ha −1
yr−1), whereas in 2002 the rate of atmospheric CH4 uptake was
only 0.94 kg CH4-C ha −1
yr−1.
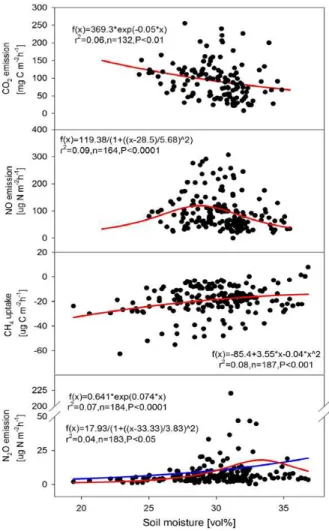
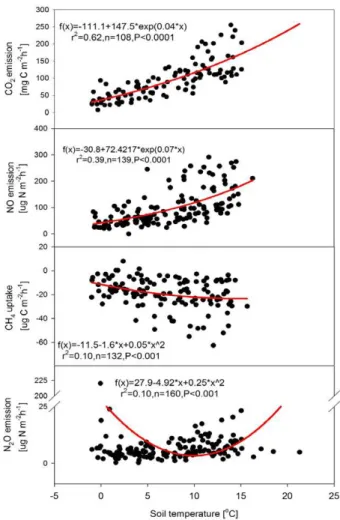
3.4 Environmental controls over trace gas fluxes
Soil CO2emissions were significantly positively correlated (Figs. 5 and 6) with soil tem-perature (5 cm), whereas they were only weakly negatively correlated with soil moisture 25
BGD
8, 12197–12245, 2011
Decadal variability of soil GHG fluxes
G. J. Luo et al.
Title Page
Abstract Introduction
Conclusions References
Tables Figures
◭ ◮
◭ ◮
Back Close
Full Screen / Esc
Printer-friendly Version Interactive Discussion
Discussion
P
a
per
|
Dis
cussion
P
a
per
|
Discussion
P
a
per
|
Discussio
n
P
a
per
|
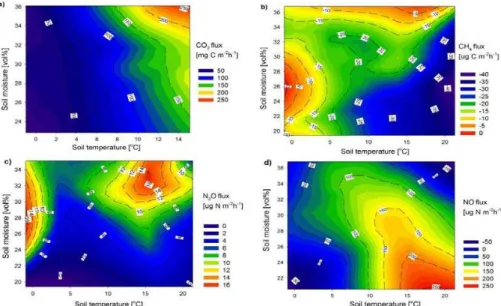
The individual effects of soil temperature and soil moisture on CH4 uptake were
generally weak (r2<0.1) though significant. The relationship between soil temperature
and CH4 uptake could be best described by a quadratic regression (Figs. 5 and 6).
Figure 7b showed that highest rates of CH4 uptake were observed under warm and
dry conditions. 5
NO emission was positively correlated with soil temperature, with soil temperature being the better predictor as compared to soil moisture. Lorentzian function and poly-nomial fitting were used here to describe the relationship between soil moistures and NO fluxes, while between temperature and NO fluxes the relationship was best
de-scribed by an exponential function. Interactive effects of soil temperature and soil
10
moisture on the fluxes showed that NO fluxes were highest when the temperature was high (>15◦C) but the soil moisture was still less than 24 vol % (Fig. 7d).
Similar to CH4, the correlations between N2O emissions and both drivers were weak but significant (r2was not more than 0.1). Generally, increased soil moisture led to an
increase in N2O emission, while increased soil temperature led to an increase in N2O 15
emission as well, though both effects were clearly biased due to high N2O emissions during freeze-thaw events. However, after excluding the freeze-thaw periods for data
analysis, the r2 value of the soil moisture-N2O relationship increased to more than
0.1, and ther2value of the soil temperature-N2O relationship increased to more than
0.2. The dominant environmental factor affecting the magnitude of N2O fluxes was soil 20
moisture for soil temperatures<3◦C. The highest fluxes were observed for cold/moist
or warm/moist environmental conditions (Fig. 7c).
Figure 8 demonstrated how monthly NO : N2O ratios depended on soil moisture and
soil temperature. The dominant environmental factor affecting the ratio was soil mois-ture rather than soil temperamois-ture, especially for periods with soil temperamois-tures>10◦C
25
and soil moisture<26 vol %. Higher ratios of NO fluxes to N2O fluxes were found for
BGD
8, 12197–12245, 2011
Decadal variability of soil GHG fluxes
G. J. Luo et al.
Title Page
Abstract Introduction
Conclusions References
Tables Figures
◭ ◮
◭ ◮
Back Close
Full Screen / Esc
Printer-friendly Version Interactive Discussion
Discussion
P
a
per
|
Dis
cussion
P
a
per
|
Discussion
P
a
per
|
Discussio
n
P
a
per
|
The CO2: N2O ratio was highest for warm/dry conditions. For cool/wet conditions
low soil CO2 fluxes but high N2O emissions resulted in the lowest CO2: N2O ratio. CO2: NO ratios were highest when soil temperature was>12
◦
C and soil moisture was
>34 vol %. The graph showed that at soil temperatures <10◦C or if soil temperature
was>10◦C and soil moisture was<32 vol %, the CO2: NO ratio was close to 1, which
5
means that under these conditions CO2-C emissions were approx. 1000 times higher
than NO-N emissions or that per 1000 mol CO2-C per 1 mol of NO-N was emitted.
3.5 Regression models for approximating trace gas fluxes
Variables tested included soil temperature (organic layer, 5, 10, 15, and 20 cm soil depth), soil moisture (volumetric water content in 10 cm soil depth), air temperature at 10
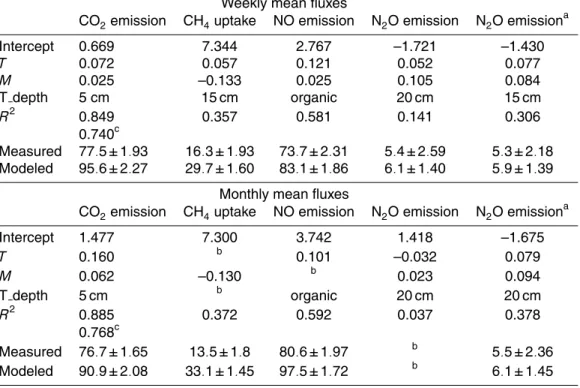
2 m a.g.l. (average, maximum, and minimum air temperature), and precipitation. The results of the multiple linear regression analyses for predicting soil-atmosphere fluxes
of N2O, NO, CO2, and CH4 due to changes in environmental drivers were given in
Table 3.
All soil trace gas fluxes correlated strongly (NO and CO2) or weakly (CH4and N2O) 15
with soil temperature, though best fits for individual trace gases differed with regard to
the measuring depth of soil temperature. For example, soil CO2 and NO emissions
were positively correlated with surface layer temperatures (either measured in 2 cm (organic layer) or 5 cm soil depth). In contrast, for soil N2O emission and atmospheric
CH4uptake, soil temperatures measured in deeper soil depths (20 and 15 cm, Table 3)
20
were best to explain temporal variations in fluxes. For the monthly aggregated dataset only the soil temperature in the organic layer was significantly correlated with soil NO emission, while soil moisture was the only predictor of monthly mean fluxes of
atmo-spheric CH4 uptake. For monthly mean N2O fluxes a correlation to soil temperature
became significant if spring freeze-thaw periods were excluded (Table 3). 25
For both datasets the models had high explanatory power for NO and CO2 fluxes
(accounting for up to 80 % of the variance; Table 3). The best regression results
BGD
8, 12197–12245, 2011
Decadal variability of soil GHG fluxes
G. J. Luo et al.
Title Page
Abstract Introduction
Conclusions References
Tables Figures
◭ ◮
◭ ◮
Back Close
Full Screen / Esc
Printer-friendly Version Interactive Discussion
Discussion
P
a
per
|
Dis
cussion
P
a
per
|
Discussion
P
a
per
|
Discussio
n
P
a
per
|
an explanatory power for the temporal variability in soil CO2 fluxes as high as 88.5 % by considering soil moisture as well as soil temperature in the regression analysis. This value decreased to 76.8 % when using soil temperature as predictor only. However, for
N2O and CH4 we failed to find meaningful correlations and, thus, to provide simple
regression models to estimate fluxes from weekly to annual scales. 5
The performance of the obtained simple empirical models was validated by using these models to predict GHG fluxes based on the remaining observational data. The last two columns summarized the predicted and observed mean value of all fluxes. Monthly (weekly) soil fluxes were on average overestimated by 19 % (23 %) with regard
to CO2, and 21 % (13 %) with regard to NO if empirical relationships were used to
10
approximate fluxes (Fig. 9). For longer time periods, such as monthly, 3- or 6-months periods or entire years, correlations weakened or even disappeared.
4 Discussion
4.1 Comparison with other studies
4.1.1 CO2
15
Soil CO2flux measurements started in May 1995 and were performed continuously
ex-cept for the period January 1998 to June 1999 and the years 2002 and 2003 in subdaily resolution. The obtained multi-year dataset on CO2fluxes and fluxes of N2O, CH4and NO – for which even more observation years are available – is to our knowledge unique. Only a few studies covered so many trace gas species, and none of the published 20
datasets lasted such a long period of time. For instance, continuous automatic cham-ber measurements of soil CO2fluxes (Griffis et al., 2004), covering a 7-yr period (1994 and 1996–2001), were made at an old aspen forest site in Saskatchewan, Canada, resulting in an overall mean value of 13.15 t C ha−1yr−1. For the Harvard Forest, USA, Phillips et al. (2010) published a 4-yr dataset for the period 2003–2007, using eight 25
BGD
8, 12197–12245, 2011
Decadal variability of soil GHG fluxes
G. J. Luo et al.
Title Page
Abstract Introduction
Conclusions References
Tables Figures
◭ ◮
◭ ◮
Back Close
Full Screen / Esc
Printer-friendly Version Interactive Discussion
Discussion
P
a
per
|
Dis
cussion
P
a
per
|
Discussion
P
a
per
|
Discussio
n
P
a
per
|
6.27 t C ha−1yr−1 at wetland margin. Wang et al. (2010) reported on soil respiration and its relationship to soil carbon content, forest floor mass, root biomass, soil tem-perature, and soil moisture at three different temperate forest sites in the Changbai
Mountains, Northeastern China. Average annual soil CO2 efflux over a measuring
period of four years (2003–2005) at a site with middle-aged, broad-leaved secondary 5
forest was 14.8±0.6 t CO2-C ha−1yr−1 and, thus, significantly higher as compared to a young coniferous plantation site (8.3±0.5 t CO2-C ha−1yr−1) or an old-growth, mixed
coniferous and broad-leaved primary forest (9.4±0.5 t CO2-C ha−1yr−1). These
long-term measurements of soil respiration as well as observational data from other temper-ate forest sites worldwide (Raich and Schlesinger, 1992; Raich and Tufekcioglu, 2000; 10
Savage and Davidson, 2001; Rosenkranz et al., 2006) show that the observed soil res-piration fluxes at the H ¨oglwald site (6.99–9.24 t C ha−1yr−1; mean: 7.91 t C ha−1yr−1) are well within the reported ranges for soil respiration.
Our long-term measurements of soil respiration also showed that soil respiration rates varied largely from year to year by >30 %. Highest annual soil respiration (>
15
9 t CO2-C ha−1yr−1) was found for the year 1996, which was the year with the coldest mean annual soil temperature (5.7◦C), longest continuous soil freezing period (approx. 2 months), and annual rainfall (778 mm) which was approx. 20 % below the average of the entire observation period. Lowest annual soil respiration rates (approx. 7 t CO2 -C ha−1yr−1) was observed for the year 2004, the year with the highest mean annual 20
soil temperature (11.9◦C), but also approx. 20 % lower annual rainfall (754 mm) as
compared to the entire observation period (932 mm). These patterns suggest, that in cold years freeze-thaw events seem to stimulate soil carbon mineralization, whereas in warm and dry years soil respiration is hampered due to soil moisture deficits, which might impede not only heterotrophic, but also root respiration. However, even though 25
soil thawing led to small peak emissions of soil CO2in the early spring not only in those
years when pronounced freeze-thaw effects were observed for N2O as well (1996,
BGD
8, 12197–12245, 2011
Decadal variability of soil GHG fluxes
G. J. Luo et al.
Title Page
Abstract Introduction
Conclusions References
Tables Figures
◭ ◮
◭ ◮
Back Close
Full Screen / Esc
Printer-friendly Version Interactive Discussion
Discussion
P
a
per
|
Dis
cussion
P
a
per
|
Discussion
P
a
per
|
Discussio
n
P
a
per
|
Higher CO2 fluxes were observed in years with below average mean soil
tempera-ture (e.g. in 1996, 2006), i.e. years with rather cold winters and springs. This indicates that extended freezing periods are increasing the pool of easy degradable organic mat-ter, e.g. due to the dieback of part of the microbial biomass during frost (Papen and Butterbach-Bahl, 1999). This increased availability of substrate at the end of the freez-5
ing period may finally prime also the decomposition of organic matter in the following growing season (Kuzyakov et al., 2000). Based on four years (2003–2006) of sub-daily measurements of soil respiration at adjacent upland and wetland forest sites at Harvard Forest, Phillips et al. (2010) found that annual soil respiration decreased, although air temperature increased during this period. Instead, mean spring soil temperatures de-10
creased over the same period. Thus, they concluded that annual soil respiration rates might be positively correlated with mean spring soil temperature. This, as well as our
finding that years with strong freezing periods showed highest annual CO2respiration
rates, indicated that climate conditions during the dormant or early growing season might determine annual soil respiration rates in temperate forest ecosystems.
15
Years with summer droughts, as e.g. the years 1997 or 2004 showed reduced an-nual soil respiration rates. This observation is in line with experiments at a spruce site at Solling, Germany, where artificially prolonged drought of 172 days during the summer period resulted in a reduction of soil respiration while during the following
rewetting period soil CO2 emissions in the first 30 d significantly increased by 48 %
20
in 1993 and 144 % in 1994 (Borken et al., 1999). Strong interannual variations up
to 2.3 t C ha−1yr−1 due to extended summer droughts were observed for the Harvard
Forest, Northeastern USA (Savage and Davidson, 2001). Re-wetting of soil following
a drought period was often associated with a period of pulse soil CO2emissions. The
intensity of these pulses may depend strongly on soil temperature (Borken et al., 1999, 25
BGD
8, 12197–12245, 2011
Decadal variability of soil GHG fluxes
G. J. Luo et al.
Title Page
Abstract Introduction
Conclusions References
Tables Figures
◭ ◮
◭ ◮
Back Close
Full Screen / Esc
Printer-friendly Version Interactive Discussion
Discussion
P
a
per
|
Dis
cussion
P
a
per
|
Discussion
P
a
per
|
Discussio
n
P
a
per
|
Besides, the observed reduction of soil respiration in years with summer droughts at our site are supported by observations from several forest sites across Europe during the extremely dry and hot year 2003 (Yuste et al., 2005; Nikolova et al., 2009). In this respective year, for which soil respiration measurements at H ¨oglwald were missing, Europe experienced a particularly extreme climate anomaly with July temperatures up 5
to 6◦C above long-term means, and annual precipitation deficits up to 300 mm yr−1, or 50 % below the average (Ciais et al., 2005).
4.1.2 NO and N2O
Cumulative annual soil emissions for N2O and NO varied in a range of 0.2–3.24 kg N2 O-N ha−1yr−1 and 6.38–11.44 kg NO-N ha−1yr−1 for the observation period 1994–2010, 10
respectively. Datasets spanning entire years and providing estimates of annual fluxes
of NO and N2O on the basis of continuous measurements are scarce. The most
rel-evant dataset is the one of Pilegaard et al. (2006), as obtained within the EU-funded
NOFRETETE project. These authors reported on annual NO and N2O fluxes at various
forest sites across Europe, also including data for the H ¨oglwald site for the years 2002– 15
2004. Comparably high annual fluxes (6.59 kg NO-N ha−1yr−1) of NO as observed for the H ¨oglwald in this study were only documented for the Speulderbos Douglas fir for-est site in the Netherlands, a site also receiving high loads of atmospheric N inputs of approx. 40 kg N ha−1yr−1.
Together with other studies carried out in N-affected forests in Central (Brumme
20
and Beese, 1992; van Dijk and Duyzer, 1999; Butterbach-Bahl et al., 2002; Jacinthe and Lal, 2004; Jungkunst et al., 2004) and Northern Europe (Pilegaard et al., 1999; Skiba et al., 1998) our dataset shows that atmospheric N deposition has obviously
changed the emission strength of forest soils as compared to non-N-affected
temper-ate forest elsewhere (Williams et al., 1992; Castro et al., 1993). For example, Bow-25
den et al. (1991) as well as Castro et al. (1993) reported mean N2O fluxes of less
than 2.5 µg N2O-N m −2
BGD
8, 12197–12245, 2011
Decadal variability of soil GHG fluxes
G. J. Luo et al.
Title Page
Abstract Introduction
Conclusions References
Tables Figures
◭ ◮
◭ ◮
Back Close
Full Screen / Esc
Printer-friendly Version Interactive Discussion
Discussion
P
a
per
|
Dis
cussion
P
a
per
|
Discussion
P
a
per
|
Discussio
n
P
a
per
|
fir forest in the US, with both sites receiving low atmospheric N-input of less than 10 kg N ha−1yr−1.
The high fluxes of both N2O and NO at our site are a consequence of high nitrogen
deposition at the H ¨oglwald Forest in a range of 20–30 kg N ha−1yr−1since more than three decades. This high N deposition has led to elevated N trace gas emissions, 5
a narrowing of needle C : N ratios (Kreutzer, 1995), accelerated forest growth (Rothe et al., 2002) and N-cycling (Kreutzer et al., 2009; Rosenkranz et al., 2010), and finally
high nitrate leaching rates of more than 20 kg N ha−1yr−1 (Rothe et al., 2002; Weis
et al., 2006; Huber et al., 2004), which all together are signs of ecosystem N-saturation (Aber, 1992).
10
Our multi-year dataset shows that occasionally occurring freeze-thaw pulse emis-sions are dominating annual N2O fluxes in certain years. Out of 15 observation years,
the annual N2O budget was significantly affected by freeze-thaw N2O emissions in
five years. Linked to the meteorological conditions among the five years, we found that in these years average annual soil temperatures were significantly lower, and the 15
period of soil frost lasted at least 3–4 weeks. This is in accordance with earlier publica-tions stating that severity and duration of frost determined the strength of freeze-thaw
pulse N2O emissions (Papen and Butterbach-Bahl, 1999; Wu et al., 2010). Teepe
et al. (2004) found that the duration of the frost period determined the overall effect on freeze-thaw pulse N2O emissions, which may be related to the release of nutrients due 20
to the dieback of soil microorganisms as well as due to the physical cracking of soil aggregates and associated nutrient release with increasing time of freezing. Our long-term measurements confirm that evidently the duration of freezing has a remarkable influence on the amount of N2O emitted during the following thawing period.
In our study the years with highest annual N2O fluxes, i.e. 1996 and 2006, with an-25
nual emissions of approx. 3 kg N ha−1yr−1, pulse emissions during freeze-thaw periods were contributing 88 % (1996) or 87 % (2006) to total annual emissions. This reflects
the necessity of performing continuous, all-season measurements of N2O fluxes over
BGD
8, 12197–12245, 2011
Decadal variability of soil GHG fluxes
G. J. Luo et al.
Title Page
Abstract Introduction
Conclusions References
Tables Figures
◭ ◮
◭ ◮
Back Close
Full Screen / Esc
Printer-friendly Version Interactive Discussion
Discussion
P
a
per
|
Dis
cussion
P
a
per
|
Discussion
P
a
per
|
Discussio
n
P
a
per
|
fluxes. The data base obtained by short-term continuous measurements – even if per-formed at different season – may lead to a significant under- or overestimation of the trace gas source strength of soils. Therefore, there is a need for a new type of monitor-ing network which aims at the measurement of biosphere-atmosphere exchange over multiple years in order to get more reliable estimates of trace gas exchange for a larger 5
number of sites across Europe and elsewhere.
The importance of pulse emission during freeze-thaw periods as major determinant
of the annual exchange of N2O has also been demonstrated for other ecosystems
types such as temperate grasslands (e.g., Wolf et al., 2010) or arable systems (Teepe et al., 2001; Koponen et al., 2004; Kurganova et al., 2004; Matzner and Borken, 2008). 10
The most likely explanation of freeze-thaw pulse emissions, which were largely driving inter-annual variability of N2O fluxes at H ¨oglwald, is increased microbial activities in water-saturated soils with microbes being supplied with sufficient easily degradable C and N substrates due to the dieback of the microbial community during the preceding freeze period (Wolf et al., 2010; De Bruijn et al., 2009). Our observation that N2O but 15
not NO emissions (which are mainly originating from nitrification (Conrad, 1996)) are elevated certifies that denitrification is the main driver of elevated N2O emissions during freeze-thaw periods rather than nitrification. This conclusion is further supported in the
modeling study of De Bruijn et al. (2009). Soil CO2 emissions during such periods
also slightly increased (Fig. 3) confirms measurements of Wolf et al. (2010) in steppe 20
ecosystems that indeed not only denitrification but also microbial activity increased in general.
4.1.3 CH4
In the year 2000, Smith et al. (2000) summarized results of an EU project on mea-surements of soil methane oxidation rates in Denmark, Germany, Norway, Poland, 25
Sweden, and the UK, including not only agricultural land, peat bogs, and moorland but also forest and woodland soils. Compared to other land uses, temperate forest soils
showed the highest CH4 uptake rates (up to 150 µg CH4-C m
−2
BGD
8, 12197–12245, 2011
Decadal variability of soil GHG fluxes
G. J. Luo et al.
Title Page
Abstract Introduction
Conclusions References
Tables Figures
◭ ◮
◭ ◮
Back Close
Full Screen / Esc
Printer-friendly Version Interactive Discussion
Discussion
P
a
per
|
Dis
cussion
P
a
per
|
Discussion
P
a
per
|
Discussio
n
P
a
per
|
rates of atmospheric CH4 oxidation for European forest soils were varying widely
in a range of 1–165 µg CH4-C m−2h−1 (Ambus and Christensen, 1995; Borken and
Brumme, 1997; Butterbach-Bahl et al., 1998; Brumme and Borken, 1999; Borken and Beese, 2006). Some rather acidic forest soils in Germany with pH values of the organic layer below 4.0, as found at the Solling site in Central Germany (Borken and Brumme, 5
1997; Brumme and Borken, 1999), showed rather low oxidation rates of approx. 10– 20 µg CH4-C m
−2
h−1, which is in line with the low CH4 oxidation rates found for the acidic and N deposition-affected soils at our site (18.7 µg CH4-C m−2h−1). Brumme
and Borken (1999) hypothesized that the reduction of CH4 oxidation rates in highly
acidic soils was partly due to a reduction in bio-turbation by soil fauna. Consequently 10
organic material, inactive with regard to CH4 oxidation (Butterbach-Bahl and Papen,
2002) may accumulate at the soil surface and a more compact mineral soil may de-velop, hampering CH4diffusion to the sites of microbial CH4oxidation.
Another reason for reduced rates of CH4 uptake by forest soils is that many forest
ecosystems in Europe have experienced increased atmospheric nitrogen input for sev-15
eral decades. Nitrogen deposition has resulted in the acidification and eutrophication of many forest soils and triggered changes in plant and soil microbial community com-position as well as in soil chemistry (Butterbach-Bahl et al., 2011). Chan et al. (2005)
performed 8-yr-long measurement of soil CH4 exchange in a temperate deciduous
forest in Northwestern Pennsylvania and found that in situ atmospheric CH4 uptake
20
rates had been reduced by 35 % after 8 yr of N amendments (100 kg N ha−1yr−1). The
result confirmed the suggestion made by Castro et al. (1993) that soils in ecosys-tems receiving high N-deposition were likely to exhibit higher N2O emission and lower
CH4 uptake compared to soils in ecosystems receiving lower N-deposition.
Compa-rable results were also obtained by the metadata analysis by Liu and Greaver (2009), 25
who estimated the detrimental effects of Nr addition to forest soils on CH4 uptake as 0.016±0.004 kg CH4-C ha−1yr−1for non-agricultural ecosystems, per 1 kg Nrha−1yr−1 being added to the ecosystem. The H ¨oglwald Forest soil received annually approx.
BGD
8, 12197–12245, 2011
Decadal variability of soil GHG fluxes
G. J. Luo et al.
Title Page
Abstract Introduction
Conclusions References
Tables Figures
◭ ◮
◭ ◮
Back Close
Full Screen / Esc
Printer-friendly Version Interactive Discussion
Discussion
P
a
per
|
Dis
cussion
P
a
per
|
Discussion
P
a
per
|
Discussio
n
P
a
per
|
CH4-C ha −1
yr−1. This suggested reduction of the annual uptake rate of 0.3–0.5 kg
CH4-C per year or a reduction of more than 20 % as compared to a situation assuming
zero atmospheric N input. This value is close to the N assessment study on forest
soil CH4 uptake by Bowden et al. (1991) and Steudler et al. (1989), who found that
fertilization of a pine forest soil with 37 kg N ha−1yr−1 as NH4NO3 resulted in a 24 % 5
reduction of CH4uptake rates as compared to untreated plots. The effects of N inputs on the CH4oxidation capacity of a soil are complex. The inhibiting effect of ammonium has been ascribed to a stimulation of ammonia-oxidizing bacteria, allegedly at the ex-pense of CH4-oxidizing bacteria, although the mechanisms involved in this competition are unclear. An alternative explanation for persistent effects of ammonia could be that 10
the competitive inhibition of methane monooxygenase by ammonia is sufficient to kill
a substantial proportion of the CH4-oxidizing bacteria (Smith et al., 2000).
4.2 Environmental control on flux rates
4.2.1 CO2
Our observations spanning several years showed significant positive correlations be-15
tween monthly mean fluxes of CO2 and soil temperature, whereas changes in soil
moisture were of minor importance. The strong positive relationships between
tem-perature and soil CO2 fluxes were in agreement with numerous field studies that had
documented strong relationship between them for different temperate forest sites (Saiz et al., 2007; Graf et al., 2008; Wu et al., 2010; Wang et al., 2010) and could be ex-20
plained by stimulation of the biological activity of autotrophic (roots; Bouma et al., 1997) and heterotrophic organisms (microbial communities and soil fauna) by temperature.
In the frame of a 15-months study at a Norway spruce forest in the north of Zealand,
Denmark (Elberling et al., 2005), CO2 efflux correlated well with near-surface soil
temperature. This was in line with our finding that soil respiration was more closely 25
correlated to temperature measurements in the organic layer than to temperatures
BGD
8, 12197–12245, 2011
Decadal variability of soil GHG fluxes
G. J. Luo et al.
Title Page
Abstract Introduction
Conclusions References
Tables Figures
◭ ◮
◭ ◮
Back Close
Full Screen / Esc
Printer-friendly Version Interactive Discussion
Discussion
P
a
per
|
Dis
cussion
P
a
per
|
Discussion
P
a
per
|
Discussio
n
P
a
per
|
et al. (2002) for mature beech, spruce and pine stands at both Solling and Unterl ¨uss, Germany. Exponential functions, as also used in our study, were employed to describe the relationship between soil respiration and soil temperature in many studies before (Wang et al., 2006; Jacinthe and Lal, 2004; Borken et al., 2002; Bagherzadeh et al., 2008; Pilegaard et al., 2006).
5
The influence of soil moisture on soil respiration was more variable. In general, gas transport within the soil cannot be an important constraint for soil CO2 flux, since soil fluxes are mostly the result of production processes in the highly porous litter humus and uppermost mineral soil (Borken et al., 2002; Subke et al., 2003; Elberling et al., 2005). Soil water limitation of the CO2 production could be best explained by a reduc-10
tion in the temperature-insensitive basal respiration rate, with no discernible effect on the temperature sensitivity. However, a notable finding for our site is that maximum soil respiration occurred under wet and warm environmental conditions. This was specifi-cally remarkable if monthly soil temperatures increased to values>8◦C, which explains
why more than a half of the annual soil CO2emission occurred from June to
Septem-15
ber, in line with observations at other temperate forest sites in Europe (Pilegaard et al., 2006; Saiz et al., 2007; Graf et al., 2008).
4.2.2 CH4
Monthly mean CH4 fluxes at our site correlated only weakly with soil moisture
(nega-tive) and soil temperature (posi(nega-tive). Also in other studies, such as the work of Borken 20
et al. (2006), only weak correlations were found between temperatures and forest soil
CH4 uptakes, as long as temperature were from 5 to 10
◦
C (Steinkamp et al., 2001;
Castro et al., 1995). However, the missing correlation of CH4 uptake rates at the
H ¨oglwald forest sites to changes in soil moisture is somewhat surprising, especially since it is widely accepted that the diffusivity of soils is a primary controller of CH4 25
BGD
8, 12197–12245, 2011
Decadal variability of soil GHG fluxes
G. J. Luo et al.
Title Page
Abstract Introduction
Conclusions References
Tables Figures
◭ ◮
◭ ◮
Back Close
Full Screen / Esc
Printer-friendly Version Interactive Discussion
Discussion
P
a
per
|
Dis
cussion
P
a
per
|
Discussion
P
a
per
|
Discussio
n
P
a
per
|
alone as a predictor of methane uptake in temperate forest soil at Harvard Forest. Our
failure to demonstrate such a relationship between soil moisture and CH4uptake rates
is likely a result of the weekly and monthly aggregation of measurement data.
4.2.3 NO and N2O
For the spruce forest site at the H ¨oglwald Forest, NO emission increased exponen-5
tially with soil temperature. This is in line with results of others who found exponential relationships between soil NO fluxes and soil temperatures for agricultural (Williams et al., 1998; Roelle et al., 2001) as well as for forest soils (Van Dijk and Meixner, 2001; Schindlbacher et al., 2004). The strong temperature response of soil NO fluxes at our site may not only be due to the stimulation of nitrification as the assumed main process 10
of NO production at our site (Gasche and Papen, 1999), but may also be explained by increasing contributions of NO production by chemo-denitrification in the acidic or-ganic layer (pH of forest floor≤3.2) at increasing temperatures (Kesik et al., 2006). In
contrast to several field and laboratory studies (Smith et al., 1998; Dobbie and Smith, 2001; Schindlbacher et al., 2004), which reported that not only nitric oxide but also 15
nitrous oxide emissions increased exponentially with soil temperature, obviously in our
long-term dataset N2O emissions did not exponentially increase with temperature in
most cases with soil moisture limiting microbial activity and N2O production in soils during summer time.
Due to the hypothesized main production process for soil NO emissions at our site, 20
i.e. nitrification, soil moisture may hamper as well as stimulate emissions. Soil mois-ture limitations for NO production can be expected if soils are too dry, thereby restrict-ing substrate (NH+4) diffusion to micro-sites with microbial activity and exposing soil microbes to water stress. At the other hand, if soils are too wet, which results in in-creased anaerobiosis, NO produced by microbes may already further reduces in the 25
BGD
8, 12197–12245, 2011
Decadal variability of soil GHG fluxes
G. J. Luo et al.
Title Page
Abstract Introduction
Conclusions References
Tables Figures
◭ ◮
◭ ◮
Back Close
Full Screen / Esc
Printer-friendly Version Interactive Discussion
Discussion
P
a
per
|
Dis
cussion
P
a
per
|
Discussion
P
a
per
|
Discussio
n
P
a
per
|
2006; Wu et al., 2010). Ludwig et al. (2001) suggested an optimum at approximately 20 % WFPS. In contrast, maximum NO emissions were reported at WFPS between 43–85 % by other studies (Gasche and Papen, 1999; van Dijk and Duyzer, 1999). In our study the soil moisture optima for NO emissions ranged from 20–24 vol % or 33– 39 % WFPS. Schindlbacher et al. (2004) compared the optimum soil moisture for NO 5
production at different forest sites across Europe and found a wide range from 15 %
WFPS for sandy textured soils of the Po floodplain, Italy, to 65 % WFPS for a clay dom-inated soil texture at a beech forest site in Austria. In this respect the value for our site, with loamy clay textured soil is well in the range of reported values.
4.2.4 C : N trace gas ratios 10
Figure 8a showed that the dominant environmental factor affecting the ratio of NO to
N2O emissions was soil moisture rather than soil temperature, especially for conditions with soil temperatures>10◦C and soil moisture values<26 vol %. For such conditions
NO emissions were typically high, since soil aeration and, thus, oxidative microbial
processes such as nitrification were favored. On the other hand, the NO : N2O ratio
15
shifted toward N2O at high soil water as well as high or low temperature conditions,
without revealing a distinct pattern. However, annual NO emissions at our sites were
always approx. one order of magnitude higher than N2O emissions (Fig. 2), indicating
that N trace gas emissions at our site were primarily driven by nitrification rather than by denitrification as already pointed out earlier by Gasche and Papen (1999) and Papen 20
and Butterbach-Bahl (1999).
The limited contour plot showing the joint effect of soil temperature and moisture on
the emission ratios of CO2: NO indicated that both gases were controlled in the same
way by changes in temperature and moisture. Even though magnitudes of both fluxes
were different by a factor of 1000, which showed that NO production and emission
25
BGD
8, 12197–12245, 2011
Decadal variability of soil GHG fluxes
G. J. Luo et al.
Title Page
Abstract Introduction
Conclusions References
Tables Figures
◭ ◮
◭ ◮
Back Close
Full Screen / Esc
Printer-friendly Version Interactive Discussion
Discussion
P
a
per
|
Dis
cussion
P
a
per
|
Discussion
P
a
per
|
Discussio
n
P
a
per
|
4.3 Empirical models to describe soil GHG fluxes
4.3.1 CO2
For the H ¨oglwald Forest site soil respiration rates at weekly or monthly scale could be successfully approximated from prevailing soil moisture and temperature values. Us-ing volumetric soil water content and soil temperature as parameters, we were able to 5
explain 84.9 % (weekly) or 88.5 % (monthly) of variations in soil respiration rates. This result is consistent with findings for other forests. For example, based on two years of measurements of soil respiration at six temperate forest stands (mature beech, spruce and pine stands) in Germany, Borken et al. (2002) found that soil temperatures at 5 and 10 cm depth were able to explain 83 % of the temporal variation in soil respira-10
tions. Similar results were also reported by Subke et al. (2003). In their open dynamic
chamber system measuring the soil CO2 flux intensively and continuously throughout
a growing season in a mature spruce forest in Southern Germany, soil temperature alone explained 72 % of the variation in the flux rate, and including soil water content as an additional variable increased the explained variance to about 83 %.
15
Mariko et al. (2000) and Davidson et al. (2000) pointed out the limitation of using a simple temperature function from one soil depth (5 cm in the present work) to de-scribe CO2production by microbial mineralization activity and root respiration through-out the profile due to the heterogeneity of substrate availability as well as temperature and moisture gradients. Splitting the temperature response into several components to 20
represent the flux contribution from different soil layers was one step towards a better
understanding of the origin of CO2 within the soil. However, this would increase the
number of parameters in a regression model, thus requiring more data points to yield a significant regression result (Draper and Smith, 1981). Despite sufficient data ob-tained in our study, it was not possible to further improve simulation results by including 25
soil temperature measurements from different soil depths, since the temperature
mea-sured at a depth of 5 cm alone was adequate to describe observed variations of CO2