Genetic Diversity in the Lesser Antilles and Its
Implications for the Settlement of the
Caribbean Basin
Jada Benn Torres1*, Miguel G. Vilar2,3, Gabriel A. Torres1, Jill B. Gaieski2, Ricardo Bharath Hernandez4, Zoila E. Browne5, Marlon Stevenson5, Wendell Walters5,6, Theodore
G. Schurr2, The Genographic Consortium
1Department of Anthropology, University of Notre Dame, Notre Dame, Indiana, United States of America, 2Department of Anthropology, University of Pennsylvania, Philadelphia, Pennsylvania, United States of America,3Missions Programs, National Geographic Society, Washington, D.C., United States of America, 4Santa Rosa First Peoples Community, Arima, Trinidad and Tobago,5The Garifuna Heritage Foundation Inc., Kingston, St. Vincent and the Grenadines,6Sandy Bay Village, St. Vincent and the Grenadines
¶ Membership of the Genographic Consortium is provided in the Acknowledgments. *[email protected]
Abstract
Historical discourses about the Caribbean often chronicle West African and European influ-ence to the general neglect of indigenous people’s contributions to the contemporary region. Consequently, demographic histories of Caribbean people prior to and after Euro-pean contact are not well understood. Although archeological evidence suggests that the Lesser Antilles were populated in a series of northward and eastern migratory waves, many questions remain regarding the relationship of the Caribbean migrants to other indigenous people of South and Central America and changes to the demography of indigenous com-munities post-European contact. To explore these issues, we analyzed mitochondrial DNA and Y-chromosome diversity in 12 unrelated individuals from the First Peoples Community in Arima, Trinidad, and 43 unrelated Garifuna individuals residing in St. Vincent. In this com-munity-sanctioned research, we detected maternal indigenous ancestry in 42% of the par-ticipants, with the remainder having haplotypes indicative of African and South Asian maternal ancestry. Analysis of Y-chromosome variation revealed paternal indigenous American ancestry indicated by the presence of haplogroup Q-M3 in 28% of the male partic-ipants from both communities, with the remainder possessing either African or European haplogroups. This finding is the first report of indigenous American paternal ancestry among indigenous populations in this region of the Caribbean. Overall, this study illustrates the role of the region’s first peoples in shaping the genetic diversity seen in contemporary Caribbean populations.
Introduction
The Caribbean is a vast region encompassing nearly 3 million km2in total area. Bordered by the Atlantic Ocean to in the east, it spans from the southern coast of the Bahamas to the
OPEN ACCESS
Citation:Benn Torres J, Vilar MG, Torres GA, Gaieski JB, Bharath Hernandez R, Browne ZE, et al. (2015) Genetic Diversity in the Lesser Antilles and Its Implications for the Settlement of the Caribbean Basin. PLoS ONE 10(10): e0139192. doi:10.1371/ journal.pone.0139192
Editor:Francesc Calafell, Universitat Pompeu Fabra, SPAIN
Received:July 13, 2014
Accepted:September 10, 2015
Published:October 8, 2015
Copyright:© 2015 Benn Torres et al. This is an open access article distributed under the terms of the Creative Commons Attribution License, which permits unrestricted use, distribution, and reproduction in any medium, provided the original author and source are credited.
Data Availability Statement:Data are available from the NCBI GenBank with accession numbers KT77741-98. A complete list of accession numbers can be found in the Supporting Information files.
northern coast of South America and the eastern coast of Mexico and Central America (Fig 1). Comprised of well over 700 islands, this region is currently home to an estimated 17 million people [1].
The initial presence of human populations within the region has been dated to 7,200 years before present (ybp) based on evidence from the Banwari Trace site in Trinidad [2]. Aside from this site, the first human settlement in the Caribbean dates to a migration event around 8,000–5,000 ybp marked by sites on Cuba, Hispañola and Puerto Rico [3–5]. Within the north-ern Lesser Antilles and Barbados, human occupation dates back as far as 5,000–3,000 ybp [3]. Both archeological and linguistic research suggest that, for the remaining islands of the Antil-les, a series of migrations ending just prior to 1500 AD resulted in human presence throughout the region [6]. Possible sources of these population expansions to the southern Lesser Antilles include northern South America or, alternatively, the Greater Antilles through southward migrations [6–15].
As a result of these different expansions, at least eight different ethnic groups were present in the Caribbean at the time of European contact. These include the Guanahatebay in Cuba, the Macorix of Hispañola, the Ciguayo of Hispañola, the Lucayo (also referred to as Lucayan Taíno) in the Bahamas, the Ciboney of Haiti, Jamaica, and Cuba, the Classic Taíno in the Dominican Republic, Puerto Rico, the Virgin Islands, and the Leeward Islands, and the Kali-puna and the Karina Caribs in Windward islands of the Lesser Antilles [7,16]. The exact cul-tural, biological and linguistic affinities of these historical populations have yet to be fully determined.
Indigenous Caribbean peoples were greatly affected by the assimilation, disease, and geno-cide brought about by European colonization and the Trans-Atlantic slave trade [17]. These
Fig 1. A map of the Lesser Antilles showing the locations of St. Vincent and the Grenadines and Trinidad and Tobago.
doi:10.1371/journal.pone.0139192.g001 Competing Interests:The authors have the
communities were also systematically dispersed to other islands or parts of the Americas dur-ing the colonial period, as well as legislated or otherwise written out of the historiography of the region [18–22]. Despite the colonial era population decline [15,23], several contemporary indigenous communities still persist on different islands of the Caribbean.
While archeological, ethnohistorical, and linguistic data provide crucial perspectives on the peopling and history of the Caribbean Basin, many questions regarding the timing and origins of the initial migrations and the impact of European colonization on indigenous Caribbean communities remain unanswered. In response to these issues, and with local and community consent, we characterized mitochondrial DNA and Y-chromosome variation in two indige-nous communities, the Santa Rosa First Peoples’Community (FPC) in Trinidad and the Gari-funa of St. Vincent. The resulting data allowed us to examine the plausibility of different models regarding the purported origins of the initial migrations into the Caribbean Basin and evaluate hypotheses about the genetic relationships between indigenous Caribbean and cir-cum-Caribbean populations. These data were also used to assess how the entry of African, Asian and European peoples into the Caribbean has affected the demography of indigenous populations of the Lesser Antilles.
Methods
Ethics statement
Prior to study commencement, this project was reviewed and approved by the University of Pennsylvania IRB #8 and the University of Notre Dame IRB. In addition, prior to sample col-lection, we obtained approval from the National Ethics Research Committee, Ministry of Health, Wellness and the Environment, St. Vincent and the Grenadines, and the Ethics Com-mittee, Government of the Republic of Trinidad and Tobago, and the Santa Rosa FPC and St. Vincent Garifuna Community. Each participant also provided written informed consent prior to sample collection and documentation of family history information.
Indigenous Caribbean communities
The Santa Rosa FPC is based in Arima, a settlement located in the north-central region of Trin-idad, roughly 26 km east of Port of Spain. According to the Trinidadian Central Statistics Office 2011 census, approximately 1,328 people in Trinidad identified as indigenous, 7% of whom live in Arima [24]. The history of the FPC extends back to when Trinidad was a Spanish colony [25]. In 1749, the Indian Mission of Arima was established in the north-central region of Trinidad as a Capuchin Mission town [25,26]. This mission town was named“Arima”in honor of Hyarima, an indigenous leader and activist who during the 16thcentury led several rebellions to defend his community from colonial encroachment [27]. As part of a colonial ini-tiative to annex native lands, all indigenous people in the remaining Trinidadian missions towns were consolidated into the Santa Rosa Mission [22]. Although this mission was formally dissolved in 1849, many indigenous peoples remained in the vicinity and the Spanish influence on the indigenous community remains evident as many contemporary indigenous peoples have Spanish surnames [21]. In 1976, the Santa Rosa FPC was incorporated as a limited liabil-ity company, thereby becoming the only collective of indigenous people that have national rec-ognition within Trinidad [22,25,28].
and Britain worked to ensure that the other would gain no advantage on the neutral islands, Britain formally seized control of St. Vincent in 1763. British encroachment on indigenous lands resulted in the First Carib War (1772–73), after which the British succeeded in dispos-sessing indigenous peoples and forcing them into a treaty. Although the Vincentian indigenous groups halted the British military advance at that time, within twenty years, the Second Carib War (1795–96) erupted between these antagonists. As a result of this conflict, Vincentian indigenous peoples were deported, first to the nearby island of Balliceaux, and then to Roatán, an island located off of the coast of Honduras [20,29].
Prior to its becoming a colony, both the British and the French employed ethnic distinctions to divide indigenous Vincentian peoples and help them annex native lands [30]. Accordingly, those thought to be descendants of indigenous Caribbean and African ancestors were called
‘Black Caribs’, while those thought to be descendants of only the original inhabitants of the region were called‘Yellow Caribs’. The‘Black Caribs’were forcibly removed from St. Vincent and relocated to different parts of Central America, while the‘Yellow Caribs’, although initially exiled, were returned to the island [20]. As a consequence of this forced migration, more than half of the exiled Vincentian population was lost, although some survivors eventually returned to St. Vincent. Today, contemporary Garifuna peoples are found in countries throughout Cen-tral America, on St. Vincent, and in the United States [31,32]. The native communities of St. Vincent are generally located in the north of the island at Sandy Bay, Fancy, and Owia, but also in the southwest regions at Grieggs Point, Rose Bank, and Rose Hall [33].
Sampling
Genetic samples, collected via buccal swabs, were obtained from a total of 88 indigenous indi-viduals in both Trinidad and St. Vincent. Of this total, 65 participants were Garifuna from the Kingstown area and two regions on the northeastern coast of St. Vincent. The remaining 23 samples were obtained from members of the Santa Rosa FPC in Arima, Trinidad. All 88 DNA samples were subjected to genetic analysis. After review of the genealogical data, we removed maternal or paternal relatives from the sample set, leaving 7 Santa Rosa FPC and 25 Garifuna females and 5 Santa Rosa and 18 Garifuna male samples for statistical and phylogenetic analy-ses. Although these sample sizes are small for standard statistical analyses, both communities are small, demographically speaking, numbering under 2,000 people, including relatives. Con-sequently, the small study sample sizes reflect the communities from which they were derived. While these sample sizes may affect how robust the statistical and phylogenetic analyses described below, they nonetheless allow for some generalizations about human prehistory in this region of the Caribbean.
Mitochondrial DNA and Y-chromosome analysis
We determined the paternal genetic ancestry of the St. Vincent and Trinidadian male partic-ipants by screening the non-recombining region of the Y-chromosome (NRY) for 17 phyloge-netically informative biallelic markers (SNPs) that define paternal haplogroups and their major sub-branches (L54, M3, M9, M19, M45, M89, M96, M168, M173, M194, M199, M207, M242, M253, M343, P215, SA01) [42–44]. All markers were screened using custom TaqMan assays, and scored on an ABI 7900HT Fast Real-Time PCR System [34–36].
Paternal haplotypes were further defined through the analysis of 17 Y-chromosome short tandem repeats (Y-STRs) that are part of the AmpFℓSTR Y-filer Amplification Kit (ABI). A
separate custom multiplex reaction was also used to characterize six additional SNPs (M17, M60, M91, M139, M175, and M186) and two additional Y-STRs (DYS388, and DYS426). PCR products were run with GeneScan 500 LIZ Size Standards and read on an ABI 3130xl Gene Analyzer [34–36,43].
We used Haplogroup Predictor [45]to assign all Y-STR haplotypes to paternal haplogroups. Due to the possible convergence of Y-STR allele sizes in different NRY haplotypes [46,47], we confirmed the haplogroup predictions by genotyping the relevant diagnostic SNPs using cus-tom TaqMan assays (see above). The Y-chromosome haplogroup frequencies were calculated by hand, while summary statistics were estimated using Arlequin v.3.11 software [48].
When comparing the St. Vincent and Trinidad communities to other Caribbean popula-tions, we used data from the Y-STR loci recommended by the Scientific Working Group on DNA Analysis Methods (SWGDAM) [49]. This set included the DYS19, DYS385a, DYS385b, DYS389I, DYS389II, DYS390, DYS391, DYS392, DYS393, DYS438, and DYS439 loci. In these analyses, DYS385 data from published studies were used in the diversity estimates. Here, the shorter repeat allele was consistently associated with DYS385a, although the assignment of the two-repeat alleles cannot be accurately made without further genotyping.
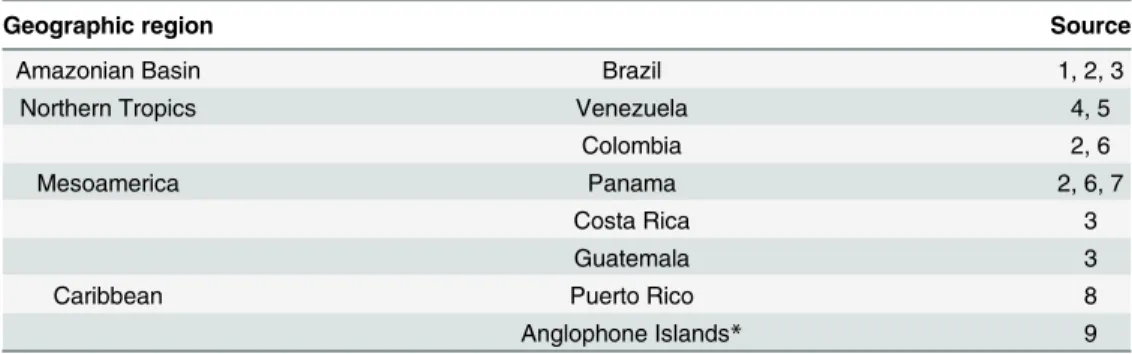
Comparative analyses. To assess the population affinities of the St. Vincent and Trinida-dian populations, we compared their mtDNA HVS1 sequences (np 16024–16400) to those of several North American [50], Caribbean [51,52], and circum-Caribbean populations in Central and South America [50,53–58]that were available in Genbank (Table 1). Comparative analyses included estimates of diversity and exact tests for population differentiation. FST, a measure of
population differentiation due to genetic structure, was estimated based on HVS1 sequences for Vincentian, Trinidadian and comparative populations with Arlequin v.3.11 [48] using the Tamura-Nei distance method with a gamma correction of 0.47 [59]. The inter-population FST
estimates were subsequently visualized through multi-dimensional scaling (MDS) [60]using
Table 1. Comparative mitochondrial DNA sequences used in the current study.
Geographic region Source
Amazonian Basin Brazil 1, 2, 3
Northern Tropics Venezuela 4, 5
Colombia 2, 6
Mesoamerica Panama 2, 6, 7
Costa Rica 3
Guatemala 3
Caribbean Puerto Rico 8
Anglophone Islands* 9
Sources: 1 = Fagundes et al., 2008; 2 = Perego et al. 2010; 3 = Yang et al., 2010; 4 = Castro de Guerra et al., 2012; 5 = Vona et al., 2005; 6 = Tamm et al., 2007; 7 = Perego et al., 2012; 8 = Vilar et al., 2014; 9 = Benn Torres et al., 2007
SPSS 20.0. The geographic location of each comparative population obtained from the litera-ture, and the corresponding language family ascertained from Ethnologue [61], were then incorporated into the MDS plot.
In addition, we constructed median-joining (MJ) networks with MP post-processing func-tion [62]in Network 4.6.1.0 [63,64]to analyze the phylogenetic relationships among HVS1 sequences from the current study and comparative populations. Two MJ networks were con-structed, the first for sequences belonging to haplogroup A2 and the second for those belonging to haplogroup C1. Because of their shorter lengths and general lack of Native American mito-chondrial haplogroups, the 314 comparative Anglophone Caribbean sequences [51], listed in
Table 1, were not used in the network analyses. The coalescence time for each network was cal-culated using the HVSI mutation rate of 1.64273 x 10⁻⁷per nucleotide per year [65].
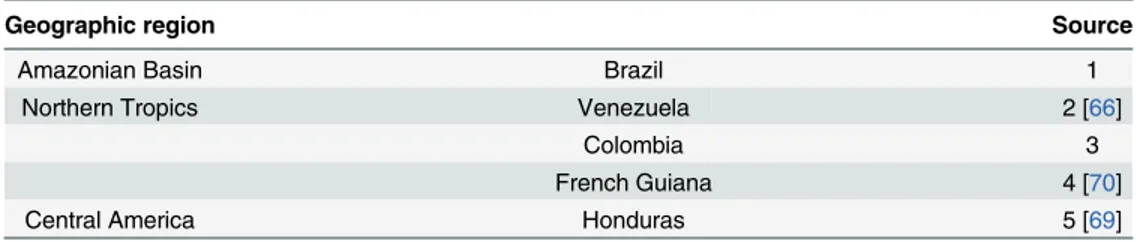
The Y-STR data from St. Vincent and Trinidad were compared to those from published studies of Native American populations [66–70](Table 2). In this comparative analysis, only data from indigenous American Y-chromosomes were used. After adjusting the data sets to include only SWGDAM loci, we calculated summary statistics including gene diversity, average gene diversity and shared haplotypes, and estimated genetic distances between populations, RST,using Arlequin v.3.11 software [48]. The RSTestimates were then visualized in a
multidi-mensional scaling (MDS) plot in SPSS [71]. In addition, genetic differentiation between the indigenous Caribbean populations (Trinidadian and Vincentian samples were combined into one group) and the comparative populations was tested using exact tests in Arlequin v.3.11 [48].
MJ network and coalescence analyses [63,64]were also used to explore the phylogenetic rela-tionships among Y-chromosomes from indigenous Caribbean and South American popula-tions. In the MJ network analysis, each Y-STR locus was weighed according to its mutation rate as listed in STRBase [72], with slower rates given more weight than those with faster rates. In the coalescence analysis, we used an evolutionary mutation rate (EMR) of 2.8 x10⁻⁵ muta-tions per locus per year [73], one shown by Wei and colleagues [74]to produce time to most recent common ancestor (TMRCA) values that most closely corresponded with estimates gen-erated from resequencing data.
Results
mtDNA diversity in St. Vincent and Trinidad
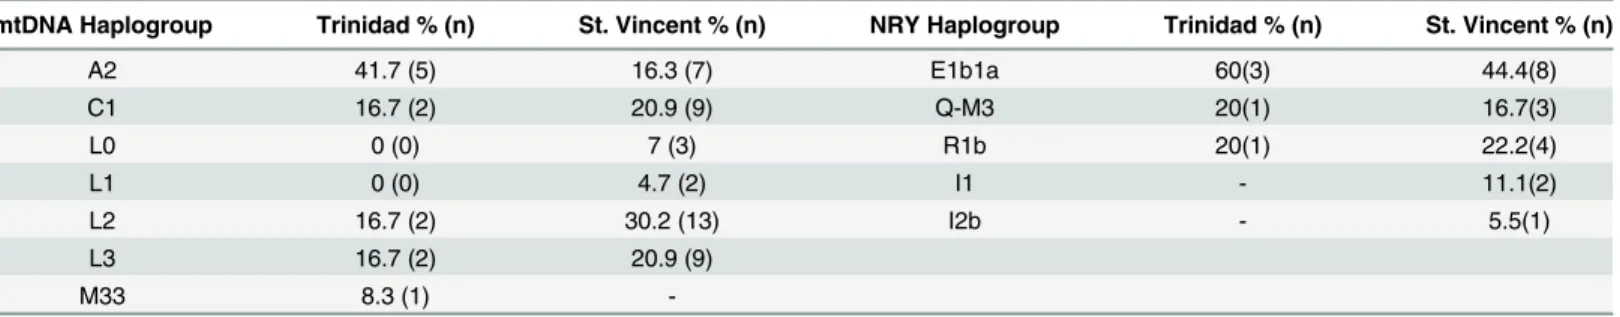
For the two populations, we detected maternal indigenous ancestry in 42% of the individuals (Table 3; Table A inS1 File). However, only two of the five major founding Native American mitochondrial haplogroups, A2 and C1, were detected in these samples, with haplogroups B2, D1, and X2a being absent. The distribution of these two haplogroups varied between the
Table 2. Comparative Y-STR data used in the current study.
Geographic region Source
Amazonian Basin Brazil 1
Northern Tropics Venezuela 2 [66]
Colombia 3
French Guiana 4 [70]
Central America Honduras 5 [69]
Sources: 1 = Leite et al., 2008; 2 = Borjas et al., 2008; 3 = Romero et al., 2008; 4 = Mazieres et al., 2010; 5 = Matamoros et al., 2009
islands, with haplogroup A2 representing 42% and haplogroup C1 17% of the total mtDNAs in the Trinidadian population, and A2 comprising only 16% and C1 21% of mtDNAs in
St. Vincent, respectively.
In addition to indigenous Caribbean ancestry, both communities exhibited maternal line-ages from Africa and, in the case of the Trinidadians, South Asia. Most of the non-indigenous lineages in both communities belonged to African haplogroups L0, L1, L2, and L3. Haplogroup L2 was the most common African lineage among the Vincentians, while L2 and L3 were the most common lineages in FPC Trinidadians. In addition, FPC Trinidadians had mtDNAs belonging to haplogroup M33a, a lineage commonly seen in northeastern India [75].
Analysis of mtDNA CR sequences revealed a total of 58 distinct haplotypes in the
St. Vincent Garifuna and the FPC Trinidadians. Of these, 23 belonged to indigenous American lineages, 31 to African lineages, and 2 to South Asian lineages (Table B inS1 File). When the CR sequences were reduced to the HVS1 sequence (np 16024–16390), we observed 8 Native American, 24 African, 1 South Asian haplotypes (Table C inS1 File). These HVSI sequences have been deposited to Genbank, accession numbers KT777741-KT777798 (Table D inS1 File).Furthermore, these HVS1 sequences were used for all subsequent statistical and phyloge-netic analyses.
As indicated by the summary statistics based on HVS1 sequences, the FPC Trinidadians exhibited higher gene diversity than the Vincentian Garifuna. The indigenous Caribbean com-munities also had generally similar levels of genetic diversity relative to Puerto Ricans and most other comparative populations (Tables4and5). However, the indigenous Caribbean communities also exhibited slightly lower diversity estimates compared to other Caribbean populations within the Lesser Antilles, excepting the Dominicans (Dominica). Unlike the other Anglophone island samples, those of the Dominicans were obtained from a rural population, with some of its members having genealogical ancestry linking them to the indigenous people of Dominica [51]. The observed differences could be a function of the small sample size for both the FPC Trinidadian and Vincentian Garifuna, which are small communities numbering fewer than 2000 people each [24,76].
Table 3. Mitochondrial DNA and Y-chromosome haplogroup frequencies in indigenous Caribbean communities.
mtDNA Haplogroup Trinidad % (n) St. Vincent % (n) NRY Haplogroup Trinidad % (n) St. Vincent % (n)
A2 41.7 (5) 16.3 (7) E1b1a 60(3) 44.4(8)
C1 16.7 (2) 20.9 (9) Q-M3 20(1) 16.7(3)
L0 0 (0) 7 (3) R1b 20(1) 22.2(4)
L1 0 (0) 4.7 (2) I1 - 11.1(2)
L2 16.7 (2) 30.2 (13) I2b - 5.5(1)
L3 16.7 (2) 20.9 (9)
M33 8.3 (1)
-doi:10.1371/journal.pone.0139192.t003
Table 4. MtDNA summary statistics for the Indigenous Caribbean communities based on HVS1 sequences (np 16024–16400).
HVS1 (np 16024–16400) n Haplotypes H (±SD) π(±SD)
All mtDNA lineages
St. Vincent 43 25 0.942 (0.021) 0.020 (0.002)
Trinidad 12 10 0.955 (0.057) 0.018 (0.002)
Native American mtDNA lineages only
St. Vincent 16 4 0.650 (0.075) 0.012 (0.001)
Trinidad 7 5 0.857 (0.004) 0.013 (0.004)
In the exact test of population differentiation, the two indigenous Caribbean populations were significantly different from one another as well as from several comparative populations from Brazil, Colombia, Costa Rica, and Panama (Table E inS1 File). The Garifuna tended to be more diverged from South American groups than the Trinidad FPC. Comparisons of estimates of genetic diversity also indicated that the indigenous Caribbean communities had a pattern of genetic variation distinct from those of the surrounding communities from the same island. These patterns could change with the addition of more Santa Rosa FPC and Vincentian Gari-funa samples.
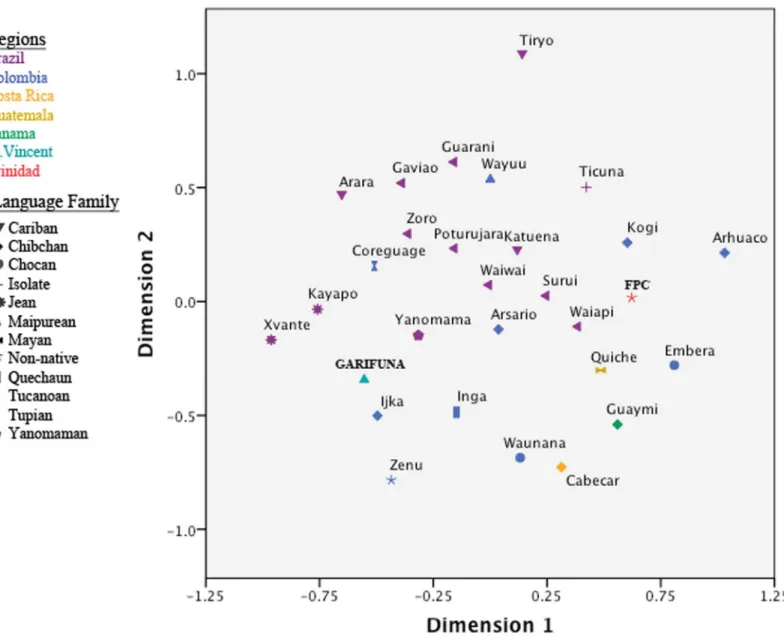
MDS was used to visualizeFSTestimates between the indigenous Caribbean and
compara-tive populations from North America, the Caribbean, Central America, and South America (Fig 2; Table F inS1 File). For this analysis, only indigenous American haplotypes were used. To investigate the relationship between geography and language, comparative urban popula-tions without an identified ethnicity or language affiliation were removed from the analysis. In addition, in the initial analyses, we included data from comparative North American popula-tions. However, their inclusion did not clarify the population affinities for the Caribbean groups (data not shown) and, as a result, the North American groups were excluded from the final comparative analysis.
Although these results may have been influenced by the small sample sizes for the indige-nous Caribbean communities, the Vincentian Garifuna and FPC Trinidadian populations were not separated from South and Central American populations, falling near the central region of the MDS plot. Interestingly, the indigenous Caribbean populations were somewhat distant from each other, with several South American populations interspersed between them. In this regard, the FPC Trinidadians appeared closer to some Brazilian, Colombian, and Central American populations, whereas the Vincentian Garifuna showed greater affinities with Colom-bian and a different set of Brazilian populations (Fig 2). However, the indigenous Caribbean populations did not fall into any specific language clusters within the MDS plot. While Jean (Gê) speakers formed a cluster along Dimension 1, and Tupian speakers were concentrated in the center of the plot along Dimension 2, both the Vincentian Garifuna and the FPC Trinida-dians were positioned outside of them.
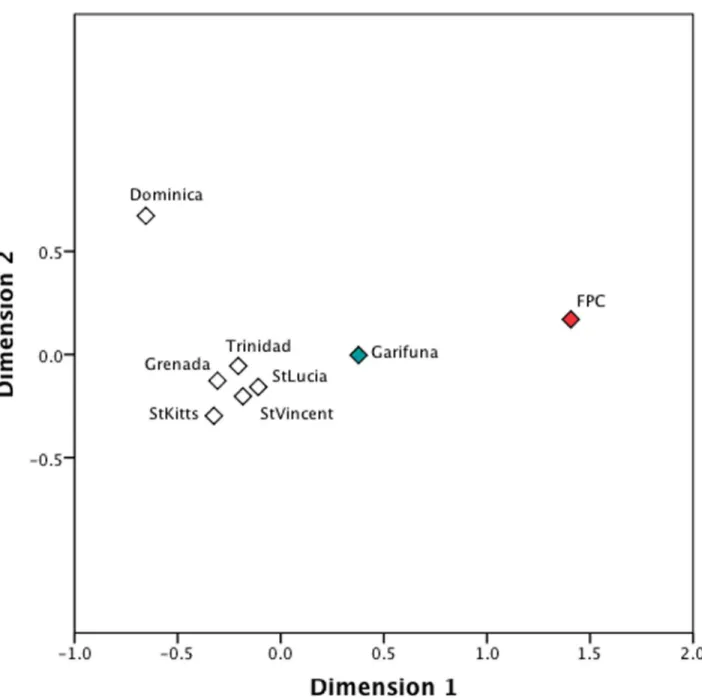
We also examined the genetic relationships between the indigenous Caribbean groups and the greater populace in Anglophone Caribbean islands. In this analysis, all haplotypes regard-less of their haplogroup identity were used for theFSTestimates (Table F inS1 File.). The
resulting MDS plot showed most of the islands to be genetically similar to each other (Fig 3). Interestingly, the FPC Trinidadians, the Vincentian Garifuna, and the Dominican populations were genetically distant from the other island populations, as well as separated from each
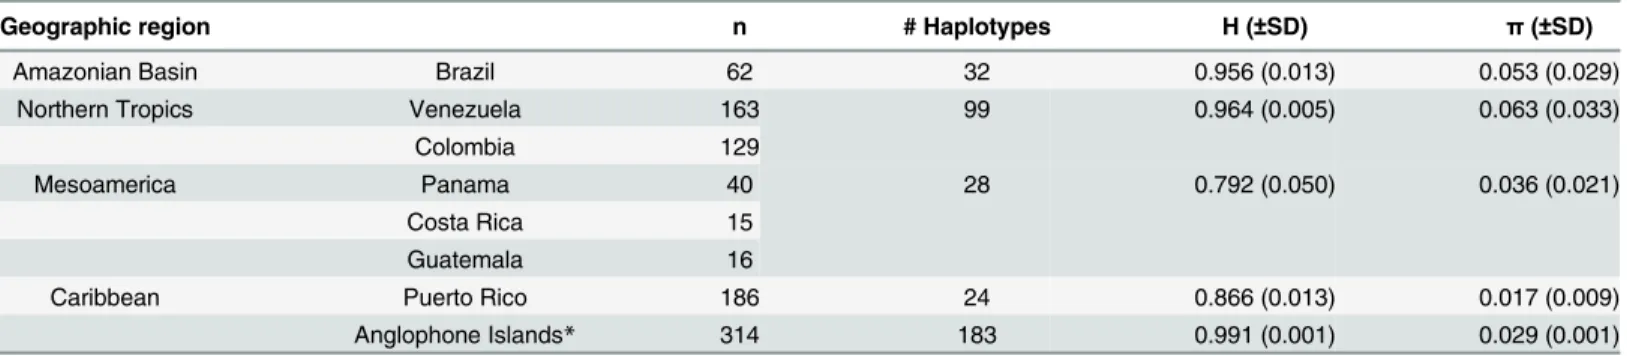
Table 5. Summary statistics for mtDNA HVS1 sequences (np 16024–16400) from comparative populations.
Geographic region n # Haplotypes H (±SD) π(±SD)
Amazonian Basin Brazil 62 32 0.956 (0.013) 0.053 (0.029)
Northern Tropics Venezuela 163 99 0.964 (0.005) 0.063 (0.033)
Colombia 129
Mesoamerica Panama 40 28 0.792 (0.050) 0.036 (0.021)
Costa Rica 15
Guatemala 16
Caribbean Puerto Rico 186 24 0.866 (0.013) 0.017 (0.009)
Anglophone Islands* 314 183 0.991 (0.001) 0.029 (0.001)
*Only sequences from np 16109–16393 were used in the comparison
other. While the FPC Trinidadians were genetically distant from most other populations, the Vincentian Garifuna aligned more closely with other Anglophone island populations. The position of the FPC Trinidadians in the plot may reflect its small sample size or perhaps its high frequency of A2 mtDNAs, which are largely absent in the comparative Anglophone island populations. Conversely, the position of the Vincentian Garifuna in the MDS plot may reflect their dual African and indigenous Caribbean ancestry and subsequent cultural and genetic exchange with indigenous Caribbean peoples, as documented by historical sources [20,77].
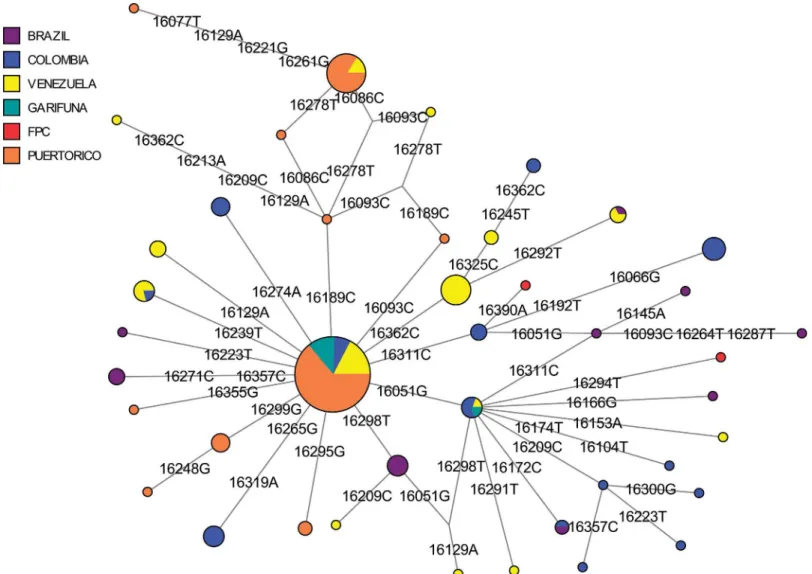
MJ networks were created from indigenous HVS1 sequences belonging to haplogroups A2 and C1 to determine the phylogenetic relationships between indigenous Caribbean and com-parative populations. In the initial analyses involving all of the comcom-parative populations, Meso-american groups fell into a separate section of the networks, suggesting a strong geographic
Fig 2. A MDS plot of FST estimates based on mtDNA HVS1 sequences (np 16024–16400) for Indigenous Caribbean and comparative Central and South American populations.The stress value of the plot is 9.8%. Data points are labeled with the population name and color-coded by geographic origin, with each shape corresponds to the language family of the sample.
structuring of the variation in the Americas (data not shown). Thus, to clarify the genetic affin-ities of the indigenous Caribbean samples, the Mesoamerica populations were removed from subsequent network analyses.
In the refined A2 MJ network, haplotypes from Trinidad, Puerto Rico, Venezuela, and Bra-zil comprised the central node of the network (Fig 4). An adjoining haplotype defined by the T16288C mutation was observed only in St. Vincent (#1;Table C inS1 File). This specific hap-lotype rarely occurs in the Americas, having been seen in only a single Bella Coola individual from the Pacific Northwest [78]. Haplotypes with the T16288C in addition to other polymor-phisms have been observed in the Mixe in Mexico [79]and in the Pilaga and Wichi from
Fig 3. A MDS plot of FST estimates based on mtDNA HVS1 sequences (np 16109–16393) for Indigenous Caribbean and comparative Anglophone Caribbean populations.The stress value of the plot is 0.2%.
Argentina [80]. However, unlike the Mixe sequences, those of the Indigenous Caribbean sam-ples had a T195C polymorphism in the HVS2 (Table B inS1 File). Because the mtDNA data from the Bella Coola and Argentinian populations lacked HVS2 data, it was not possible to determine whether the T195C was present in them. These lines of evidence tentatively suggest that the Vincentian haplotype arose through an independent T16288C mutation rather than being genealogically linked to those seen in the Bella Coola or other indigenous populations, although mitogenome sequence data will be required to fully resolve this question.
In the refined haplogroup C1 MJ network (Fig 5), Vincentian samples comprised a large proportion of the C1 founder and C1d haplotypes. This was a slightly different pattern than seen in Trinidad and Puerto Rico [56]. While many of the Puerto Rican samples belong to the C1 rather than C1d founder haplotype, one FPC Trinidadian haplotype (#8,TableCinS1 File) differed from other C1d haplotypes at C16294T and another FPC Trinidadian haplotype (#6, Table. C inS1 File) was two polymorphisms (T16311C and G16390A) different from the
Fig 4. A median-joining network of mtDNA haplogroup A2 haplotypes (np16024-16400) from Indigenous Caribbean and comparative Central and South American populations.Populations represented in each node of the network are shown in different colors.
founder C1 haplotype. Both haplotypes #6 and #8 appeared to be unique, as identical haplo-types were not identified among published Genbank sequences, and also lacked the A493G mutation in HVS2 that defines C1b (see #23 and #25; TableBinS1 File). In addition, an unusual C1 haplotype occurring in only the SVG Garifuna (#24, TableBinS1 File; #7,TableC
inS1 File) had both the A16051G mutation seen in C1d and the A493G mutation seen in C1b. Although the haplogroup to which it belonged was not entirely clear from the CR sequence, it is likely to be a C1d haplotype with an independent occurrence of the A493G mutation. Over-all, in both the A2 and C1 networks, the indigenous Caribbean groups shared only founder haplotypes with other comparative populations, including Puerto Ricans [52].
Coalescence analysis indicated that the indigenous Caribbean A2 haplotypes were older than those from haplogroup C1, with A2 dating to 8489 (± 7095) and C1 to 2452 (± 1501) ybp, respectively. While the age of C1 is generally consistent with estimate based on our mtDNA data from the Greater Antilles, that of A2 was not [55]. The difference in age estimates between the Lesser and Greater Antilles, as well as the large standard errors associated with these dates, may be attributable to the small number of haplotypes included in the estimates, the possible
Fig 5. A median-joining network of mtDNA haplogroup C1 haplotypes (np16024-16400) from indigenous Caribbean and comparative Central and South American populations.Populations represented in each node of the network are shown in different colors.
influence of founder effects in reducing haplotype diversity, or the inclusion of multiple distinct sublineages of A2 haplotypes that inflate the coalescence estimate.
Y-chromosome DNA diversity in St Vincent and Trinidad
African, European, and Native American Y-chromosome haplogroups were present in both the Trinidadian and Vincentian populations (Table 3; TableGinS1 File). Within the indige-nous Caribbean groups, four individuals had the ubiquitous haplogroup Q1a3a1a1 (Q-M3) haplotypes, while none had any from the less common Q1a3a1 (Q-L54). Haplotypes from hap-logroup C3c, another Native American paternal lineage that is common among Na-Dene speakers and is restricted to North America [81], were not observed in the Caribbean samples. Upon screening the indigenous Caribbean Q-M3 Y-chromosomes for additional variants seen in South American Indian populations (M19, M194, M199, SA01 [82,83]), none of these derived SNPs were observed.
The remaining Y-chromosomes from Trinidad and St. Vincent were of African (E1b1a) or likely European (I1, I2, R1a, R1b) origin. Overall, more than 80% of the Y-chromosome haplo-types in the indigenous Caribbean communities were non-indigenous to the Americas. The Vincentian samples were comprised of about half African and half European lineages, whereas the Trinidadian samples showed a larger frequency of paternal African (80%) than European (20%) lineages.
Analysis of Y-STR variation in the St. Vincent Garifuna and the FPC Trinidadians revealed a total of 30 distinct haplotypes in these populations, based on data from 17 loci (Table H inS1 File). Of these, 4 belonged to indigenous American haplogroup Q1a3a1a (Q-M3), 15 to African haplogroup E1b1a, and 11 to West Eurasian lineages (I1, I2, R1a and R1b). After being reduced to the SWGDAM locus set, these Y-STR sequences were used for all subsequent statistical and phylogenetic analyses.
Summary statistics for Q-M3 Y-STR haplotype data from both the comparative populations and the indigenous Caribbean groups were estimated to assess the paternal genetic affinities of the St. Vincent Garifuna and FPC Trinidadians. Due to their having a small number of indige-nous Y-chromosomes, the data from Trinidadian and Vincentian communities were combined into a single“indigenous Caribbean”population. The gene diversity for the resulting indige-nous Caribbean population was similar to that of the comparative populations (Tables6and
7). Similarly, the exact test for population differentiation showed the indigenous Caribbean population to be significantly different from only the comparative Brazilian samples
(p = 0.018; Table I inS1 File). In addition, populations from regions geographically closest to the Lesser Antilles were not significantly different from the indigenous Caribbean population.
Despite their general similarity, nearly all of the indigenous Caribbean Q-M3 haplotypes were unique to their respective populations, with only one haplotype being shared between a Vincentian Garifuna and a Kali’na individual from French Guiana [70]. The Kali’na speak a Cariban language and are believed to have arrived in the region extending French Guiana to Venezuela, the Guiana plateau, or a region near the Xingu River, a tributary of the Amazon
Table 6. Summary statistics for Y-STR haplotypes from Indigenous Caribbean populations belonging to haplogroups Q-M3.
n # Haplotypes H (±SD) Ave H (±SD)
St. Vincent &
St. Vincent and Trinidad 4 4 1 (0.177) 0.517 (0.377)
Note: All haplotypes were defined using SWGDAM loci
River around 900 AD [70,84]. However, the genealogical history provided by the Vincentian participant did not indicate recent parentage from South America but instead a family history based in the Sandy Bay region of St. Vincent.
RSTvalues for the indigenous Caribbean and comparative populations were visualized
through MDS (Table J inS1 File). In the resulting MDS plot, the Vincentian Garifuna and the FPC Trinidadians appeared closest to Venezuelans in Dimension 1 and French Guianans in Dimension 2 (Fig 6). The indigenous Caribbean groups were most distant from those in Colombia and Brazil, while also being somewhat distant from the Honduran group. Based on the p-values associated with the RSTestimates (Table J inS1 File), the only significant
differ-ence occurred between Brazil and all other populations except Trinidad, which was represented by only a single haplotype in the MDS plot.
In the phylogenetic analysis of Q-M3 Y-STR haplotypes, those from indigenous Caribbean populations were distinct from each other, being located in different branches of the MJ net-work (Fig 7). With the exception of the abovementioned Vincentian Garifuna haplotype, no other indigenous Caribbean haplotypes were shared with comparative circum-Caribbean pop-ulations. The estimated coalescence date for the branches containing Vincentian and Trinida-dian Caribbean haplotypes was 19,483 (± 2,420) ybp, a date more closely associated with the earliest peopling of the Americas. However, the cluster including only the haplotype shared between French Guiana and Vincentian Garifuna individuals dated to 2,841 (± 1,463) ybp, an estimate more closely matching the date for the peopling of the Lesser Antilles, based on arche-ological research.
Discussion
Maternal ancestries of indigenous Lesser Antillean communities
Analysis of mtDNA haplogroup diversity in the FPC Trinidadians and Vincentian Garifuna revealed relatively high frequencies of indigenous maternal lineages. Of the Native American haplogroups, only A2 and C1 were present in these communities. Broad surveys of genetic data from populations across the Caribbean indicate that haplogroup B2 and to a lesser extent, hap-logroup D1, are rarely found in contemporary Caribbean populations, whereas A2 and C1 and their derivatives are more commonly observed [19,36,51,77,85–88]. This observation holds for ancient samples from the Lesser Antilles, as well. In a recent publication by Mendisco et al. (2015), haplogroup B2 was not observed in any of the thirteen samples from the Guadeloupe archipelago, and haplogroups A2 and C1 were equally represented, while D1 was present but not as common as the other haplogroups [89]. Thus, our results confirm a general regional pat-tern of indigenous mtDNA diversity in the Caribbean.
Interestingly, the FPC Trinidadians have a high frequency of A2 and low frequency of C1, whereas the Vincentian Garifuna show the opposite pattern. The majority of the Vincentian A2 and C1 mtDNAs appear to be founder haplotypes based on CR sequence data, suggesting limited diversity within this population. By contrast, within the Trinidadian FPC, only two
Table 7. Summary statistics for Y-STR haplotypes (SWGDAM Loci) from comparative populations.
Geographic region n Number of Haplotypes H (±SD) Ave H(±SD)
Amazonian Basin Brazil 23 11 0.893 (0.040) 0.442 (0.252)
Northern Tropics Venezuela 8 8 1 (0.062) 0.646 (0.390)
Colombia 19 1 (0.017) 0.585 (0.327)
French Guiana 20 19 0.995 (0.018) 0.524 (0.295)
Central America Honduras 25 23 0.993 (0.013) 0.547 (0.304)
individuals carried the A2 founder haplotype and none of the C1 founder haplotype. The fact that Vincentian Garifuna and FPC Trinidadians share no mtDNA haplotypes is noteworthy because of their relative geographic proximity. Similarly, estimates of heterozygosityalso indi-cate differences between the two indigenous Caribbean populations.
The frequencies of each mtDNA haplogroup may reflect the effects of genetic drift on pat-terns of genetic diversity on the islands, or perhaps reveal differences in the founding popula-tions of the island groups as a result of multiple migrapopula-tions into and throughout the region [3]. Despite the fact that archeological data suggest contacts between Greater Antillean and Meso-american populations, our data do not provide clear support for genetic relationships between
Fig 6. A MDS plot of RST estimates based on Y-STR haplotypes for Indigenous Caribbean and comparative Central and South American populations.The stress value of the plot is 8.7%.
indigenous groups from these regions. These results are consistent with previous genetic stud-ies in the Caribbean, which reveal mtDNA differences between Greater and Lesser Antillean populations [52,86,87,90]. Overall, our data suggest a settlement process involving multiple migratory waves originating in the southern regions of the Caribbean in which the migrants replaced prior inhabitants and subsequently experienced relative isolation until the next expan-sion of human groups arrived from northern South America.
In addition to indigenous Caribbean ancestry, both of the study communities exhibited maternal lineages from Africa and, in the case of the Trinidadian FPC, South Asia. Most of the haplogroups observed in both communities were of African origin (L0, L1, L2, and L3). Hap-logroup L2 was the most commonly observed African hapHap-logroup within the Vincentians, while L2 and L3 were most common in the Trinidadians. Both of these lineages are frequently observed on other Caribbean islands, representing between 20–30% of the mtDNAs
[51,77,87,91]. Previous genetic studies suggest that many African lineages found in the Ameri-cas derive from Niger-Kordofanian speaking populations in West and West-Central Africa,
Fig 7. A median-joining network of Y-chromosome Q-M3 STR haplotypes from Indigenous Caribbean and comparative Central and South American populations.Populations represented in each node of the network are shown in different colors.
whose members arrived in the Americas primarily via the Trans-Atlantic slave trade [92–96]. In fact, Stefflova et al. (2011), found that, within Afro-Caribbean populations, 46% of their African ancestry could be traced back to the Guinea Bissau, Mali, Senegal and Sierra Leone regions, 29% to the region encompassing Niger, Nigeria, and Cameroon, and 25% to Angola [95].
These findings are generally concordant with the 19thcentury census records of British colo-nial plantations in Trinidad. As illustrated by the 1813 census, the birthplaces of the majority of enslaved Africans in Trinidad were primarily from regions within the Bight of Biafa, Gold Coast, and the Bight of Benin [97]. Based on our initial archival work, the same kind of infor-mation was not recorded for enslaved populations in St. Vincent. However, since both St. Vincent and Trinidad were British colonies for much of their histories, the transplanted African peoples there might be expected to have similar origins.
St. Vincent mtDNA diversity. With regard to the Vincentian Garifuna, there are several noteworthy differences between this community and the Garifuna that were exiled to Hondu-ras in the 18thcentury. A previous analysis of Honduran Garifuna revealed only indigenous haplogroups A2 and C1 and several African haplogroups, but no European maternal lineages [77]. Although these findings are generally consistent with our results, the Vincentian Garifuna have a higher proportion (46%) of indigenous American mtDNAs than the Honduran Gari-funa (16%). This difference may reflect the socio-political distinctions made by the British regarding the phenotypic appearance of Vincentians at the time of exile. In these distinctions, which ultimately separated families, those who were deemed light-skinned and presumed to descend from the island’s original inhabitants were called“Yellow (or Red) Caribs”and returned to St. Vincent, while those who were darker-skinned, presumably having both African and indigenous Caribbean parentage, were termed“Black Caribs”and exiled to Central Amer-ica [20]. Furthermore, in their analysis of ancient samples from the Guadeloupe Archipelago, Mendisco and colleagues (2015) found two mitochondrial haplotypes that matched those in Honduran Garifuna individuals. They suggested that the shared haplotypes were the result of the historical connection between the Vincentian Garifuna and those that were exiled to Cen-tral America [89]. In our current study, all of the haplogroup C1 haplotypes (haplotypes 17–22 in TableBinS1 File) observed in St. Vincent matched ancient samples from two individuals in Marie Galante and La Désirade, respectively. The matching ancient samples come from the post-Saladoid period and date to AD 1289–1445, suggesting continuity of these particular genetic lineages within Lesser Antillean populations.
Trinidadian mtDNA diversity. In addition to indigenous American and African mtDNA haplogroups, two members of the Trinidadian indigenous community also had maternal line-ages of South Asian origin that belonged to haplogroup M33a [75]. This finding was not entirely surprising, given the colonial history of Trinidad. Shortly after Emancipation in 1838, formerly enslaved African Trinidadians moved en mass away from plantations, creating a labor void that was filled by South Asian indentured laborers [98,99]. Nearly 142,000 laborers arrived in Trinidad between 1845–1917 during the height of South Asian indenture, with many coming from provinces in the northwest, northeast (Bengal and Bihar), Awadh (also called Oudh), and Punjab regions [98,100]. Although haplogroup M lineages are ubiquitous in India [101], M33a is most commonly found among tribes in western India [102,103], while also occurring at high frequency (~55%) among the Garo in the Bengal region of northeast India [75]. Considering both historic and genetic data, our results therefore suggest that some members of the Trinidad FPC have maternal genetic ancestry tracing back to the northern regions of India.
indigenous Caribbean groups have similar levels of genetic diversity relative to the comparative populations. However, when African and South Asian haplotypes are removed, mtDNA diver-sity in the indigenous Caribbean groups decreases considerably. This reduction in mtDNA diversity in indigenous Caribbean populations may be attributed to several factors including the effects of genetic drift, the loss of indigenous lineages in historical times, and possibly endogamy which may have led to the enrichment of certain mtDNA haplotypes in the popula-tions. Furthermore, patterns of genetic diversity differed between the Vincentian Garifuna and the FPC Trinidadians. This difference suggests that both groups possess specific sets of mtDNA haplotypes that are reflective of their unique histories, including the possibility of hav-ing different ancestral origins in South America.
In the MDS plot containing indigenous Caribbean and comparative circum-Caribbean mtDNA data (Fig 2), both study populations are positioned close to South and Central Ameri-can populations, suggesting some genetic similarities to them. However, given the effects of genetic drift within Caribbean groups, as indicated by their low mtDNA diversity and high between-population variances, it may be difficult to clearly differentiate population affinities for them. Nonetheless, linguistically related groups that are geographically proximate cluster together, e.g., Tupian and Jêan speakers, whereas the indigenous Caribbean groups do not align exclusively with populations from a specific language family. This result is not entirely surprising, as previous studies examining the relationship between linguistic affiliations and genetic markers generally indicate a weak relationship between language and genetic diversity for Native American populations, although this relationship becomes stronger at more local levels [104–106]. However, the linguistic data indicate that indigenous Caribbean populations spoke languages belonging to both Maipurian (Arawakan) and Cariban languages families [2]. Thus, additional genetic data from indigenous populations belonging to both of these language families will be needed to resolve the relationship between the genetic background and linguis-tic affiliation of indigenous Caribbean populations.
Analysis of mtDNA diversity in the indigenous Caribbean and Anglophone Caribbean pop-ulations shows that indigenous Caribbean groups are genetically distinct along the maternal line from the greater populace. However, the Vincentian Garifuna show greater affinities with the other island populations than the Dominicans and Trinidadians. This pattern may reflect the dual African and indigenous Caribbean ancestry of the Vincentian Garifuna and their sub-sequent cultural and genetic exchanges with indigenous Caribbean peoples as documented by historic sources [20,77,107]. The distinctiveness of the Dominican population may also reflect differences in the indigenous and colonial population history of Dominica [108].
Both indigenous Caribbean communities had founder A2 and C1 haplotypes and these were also observed in Puerto Rican populations [52,90]. Yet, the derived Vincentian haplotypes were largely distinct from those of both Trinidadians and Puerto Ricans. This observation sug-gests that, while there may be some deeper shared ancestry between indigenous Caribbean communities, each has become genetically differentiated from the others through genetic drift, separate migration events or stochastic lineage loss.
Puerto Ricans, and these may possibly reflect multiple migrations into the Caribbean Basin [52]. It is, therefore, plausible that a similar scenario explains our data from the Lesser Antilles.
Paternal ancestries of indigenous Lesser Antillean communities
Indigenous paternal ancestry. Based on the summary statistics, indigenous Caribbean populations show similar levels of paternal genetic diversity to comparative Caribbean popula-tions, although having distinct sets of Y-STR haplotypes. However, as seen inFig 7, indigenous Caribbean and most of the comparative Central and South American populations are not clearly distinctive from one another. This result may be attributable to our using a limited set of Y-STRs in the analysis of population affinities that provide a relatively low resolution of hap-lotypic diversity.In addition, the Vincentian and Trinidadian populations lack Q-M3 Y-chromosomes bear-ing derived SNPs (M19, M194, M199, SA01) seen in related haplotypes in indigenous popula-tions from western South America [83,111]. The absence of these derived SNPs suggests stronger genetic affinities of indigenous Caribbean groups with indigenous Central and South American populations in geographic areas thought to represent potential source areas for demographic expansions into the Caribbean (i.e., Brazil and Venezuela) as opposed to western or central South America. The NRY data may further reflect the effects of genetic drift on the indigenous Caribbean communities, or possibly indicate that these communities are reservoirs of genetic diversity reflective of ancient settlement and migrations in the Caribbean.
Moreover, our data provide the first evidence of indigenous Y-chromosomes in Caribbean populations from the Lesser Antilles. Recently, Marcheco-Teruel et al. (2015) [112] identified indigenous Y-chromosomes in Cuba, an island in the Greater Antilles. Prior to these studies, it appeared that indigenous American paternal haplogroups had been entirely replaced by those from colonizing populations as a result of European conquest and colonization [113–116]. Our data firmly demonstrate that indigenous American haplotypes are present in the Lesser Antilles today despite these disruptive historical events.
Phylogenetic analysis shows that Q-M3 STR haplotypes in the FPC Trinidadian and Vin-centian Garifuna differ from each other and have distinct genetic affinities with those from dif-ferent areas of Central and South America (Honduras, Brazil, Venezuela, and Colombia). This result was intriguing because of the small geographic distance between the two indigenous Caribbean groups and the circum-Caribbean populations, and the history of pre-Colombian migration within the region [86,117]. Thus, despite their small number, the fact that most Caribbean indigenous Y-chromosomes represent unique derived Q-M3 haplotypes suggests they either evolved through genetic drift and isolation on each island or arrived through sepa-rate population expansions from South America.
Indigenous Caribbean peoples are thought to be culturally related to Arawakan speakers of mainland South America, partly due to their having incorporated loan words from Cariban speaking groups [9,17]. Our genetic data point to connections between the Cariban speaking Kali’na and indigenous Caribbean populations. In addition to French Guiana, Kali’na people are found in present day Venezuela, British Guyana, Suriname, and Brazil [84]. The demo-graphic distribution of Kali’na on the South American mainland may also help to explain the placement of Lesser Antillean Q-M3 haplotypes within the MJ network. Even so, the relation-ship between the Kali’na and Vincentians is intriguing, and calls into question the conventional assertions regarding the relationship between indigenous Caribbean and mainland South American populations.
African haplotypes, represented by haplogroup E1b1a, likely entered the indigenous Caribbean communities as a result of the Trans-Atlantic trade in enslaved Africans [118,119]. E1b1a occurs at the highest frequencies in sub-Saharan African (80%) and West-Central African pop-ulations (60%) [120]. According to 19thcentury British plantation censuses [97], most of the enslaved Africans in the southern British Caribbean colonies came from people in the Bight of Biafra. Accordingly, paternal ancestry from Africans in the west and west-central regions of the continent is expected and is consistent with historical records [121].
Several predominately European haplogroups were also observed in the indigenous Carib-bean communities. Like their African counterparts, European genetic contributions to indige-nous Caribbean communities initially began during the colonial period [122–124].
Haplogroup R1 is frequently found among Europeans, being observed in greater than 50% of European men [125], although different sub-lineages are found throughout South, Central, and West Asia, as well as the Sahel region of Africa [125,126]. The most common R1 subli-neages, R1a and R1b, are both observed in the indigenous Caribbean populations. R1a is dis-tributed from southern Siberia to central regions of Eastern Europe and South Asia [127], whereas R1b is found primarily among Western European peoples, and to a lesser extent, throughout Asia [125,128]. R1b haplotypes have also been found, although at much lower fre-quencies, in certain African populations from central-western Africa [126,129]. Given the fre-quency of haplogroups R1a and R1b within the populations that colonized the Caribbean, most notably Western European groups, the presence of these paternal lineages in the Carib-bean are clearly suggestive of their introduction during European colonization, and thus gene flow from the colonial power into native populations. However, further SNP genotyping will be needed to clearly distinguish African R1b from European R1b haplotypes.
Two other non-native paternal lineages observed in the indigenous Caribbean communities were haplogroups I1 and I2. These haplogroups are ubiquitous in Europe, accounting for nearly 18% of European Y chromosomes [130]. Haplogroup I1 is most commonly found among Scandinavian populations and also appearing at appreciable frequencies in Ireland, England and Scotland [130,131], while haplogroup I2 is most frequently found among Slavic groups in Eastern Europe as well as in Europeans near the Mediterranean and Atlantic coasts [130]. Thus, the presence of these haplogroups in Vincentians and Trinidadians is also indica-tive of gene flow from European peoples.
Conclusions
Conventionally, archeological and linguistic data have been the primary sources of information used to infer details concerning the peopling of the Caribbean Basin and these lines of evidence remain important for contextualizing the genetic record. As indicated by archeological and lin-guistic data, the diversity in the Caribbean reflects both migration and contact, and also isola-tion and differentiaisola-tion, over thousands of years. Based on these data, scholars have
hypothesized that Vincentian and Trinidadian indigenous groups would more strongly resem-ble indigenous groups from northern South American because the Carib/Arawakan expansion took place recently, whereas the Taíno groups in the Greater Antilles would resemble other South American groups, and perhaps also Mesoamerican populations, due to their represent-ing an earlier genetic stratum of human populations involved in the initial peoplrepresent-ing process. Genetic data from the Vincentian Garifuna and Trinidad FPC, though limited by sample size, support the South American origin and possible Mesoamerican connections of indigenous Caribbean peoples. Furthermore, our genetic data provide more information about the impact of colonization on indigenous Caribbean peoples. While African and European paternal line-ages replaced many of those from indigenous Caribbean groups, there remains evidence of indigenous paternal ancestry in contemporary indigenous Caribbean communities.
The current study provides a glimpse of the genetic history of the region’s first peoples. Future work will include more comprehensive analyses of mitogenome sequences and Y-chro-mosome diversity in indigenous Caribbean groups. In addition to the uni-parental genetic loci, analyses of autosomal variation in these populations will further illuminate genetic history of the region.
Genetic Tools
Arlequin:http://cmpg.unibe.ch/software/arlequin35/
DnaSP:http://www.ub.edu/dnasp/
Haplogrep:http://haplogrep.uibk.ac.at/
Haplogroup Predictor:http://www.hprg.com/hapest5/
Network:http://www.fluxus-engineering.com/sharenet.htm
Supporting Information
S1 File. Table A. mtDNA SNP haplotypes in St. Vincent and Trinidad Table B. mtDNA control region sequences in St. Vincent & Trinidad Table C. mtDNA HVS1 Sequences in St. Vincent & Trinidad Table D. GenBank Accession numbers for mtDNA HVSI sequences Table E. Exact tests of based on mtDNA HVS1 sequence dat Table F.FSTestimates based
on mtDNA HVS1 sequence data Table G. Y-chromosome SNP haplotypes in St. Vincent & Trinidad Table H. Y-chromosome STR haplotypes in St. Vincent & Trinidad Table I. Exact tests of based on Y-chromosome STR haplotype data Table J. RSTestimates based on
Y-chromosome STR haplotype data
(XLSX)
Acknowledgments
Jody Hey for their comments on data analysis undertaken for this study. The authors declare no conflicting interests.
The participants of the Genographic Consortium are arranged by surname alphabetically in the following list: Syama Adhikarla, Christina J. Adler, Elena Balanovska, Oleg Balanovsky, Jaume Bertranpetit, Andrew C. Clarke, David Comas, Alan Cooper, Clio S. I. Der Sarkissian, ArunKumar GaneshPrasad, Wolfgang Haak, Marc Haber, Angela Hobbs, Asif Javed, Li Jin, Matthew E. Kaplan, Shilin Li, Begoña Martınez-Cruz, Elizabeth A. Matisoo-Smith, Marta
Mele, Nirav C. Merchant, R. John Mitchell, Laxmi Parida, Ramasamy Pitchappan, Daniel E. Platt, Lluis Quintana-Murci, Colin Renfrew, Daniela R. Lacerda, Ajay K. Royyuru, Fabrıcio R.
Santos, Himla Soodyall, David F. Soria Hernanz, Pandikumar Swamikrishnan, Chris Tyler-Smith, Arun Varatharajan Santhakumari, Pedro Paulo Vieira, R. Spencer Wells, Pierre A. Zal-loua, and Janet S. Ziegle.
Author Contributions
Conceived and designed the experiments: JBT MGV JBG TGS TGC. Performed the experi-ments: JBT MGV JBG TGS. Analyzed the data: JBT MGV TGS. Contributed reagents/materi-als/analysis tools: TGS TGC. Wrote the paper: JBT GATC MGV JBG TGS. Coordinated recruitment efforts and provided information resources for sampling sites: GATC RBH ZB MS WW.
References
1. CARICOM SS. CARICOM Statistics, Mid-year population. Georgetown, Guyana: Caribbean Com-munity Secretariat; 2011.
2. Sued-Badillo J, editor. Autochthonous Societies. Paris: UNESCO Publishing/ Macmillan Publishers Ltd; 2003.
3. Fitzpatrick SM. Verification of an Archaic Age Occupation on Barbados, Southern Lesser Antilles. Radiocarbon. 2011; 53: 595–604.
4. Willey GR. Prehistoric settlement patterns in the New World: Wenner-Gren Foundation for Anthropo-logical research; 1956.
5. Hagg WG. A Comparison of Arawak Sites in the Lesser Antilles. In: First International Congress for the Study of Pre-Columbian Cultures of the Lesser Antilles, Part II Fort-De-France, Martinique: Société d’histoire de la Martinique; 1964. pp. 9–28.
6. Allaire L. Agricultural societies in the Caribbean: The Lesser Antilles. In: Sued-Badillo J, editor. Gen-eral History of the Caribbean, vol 1. Autochthonous Societies. London and Oxford: Palgrave Macmil-lan and UNESCO Publishing; 2003. pp. 195–227.
7. Granberry J. Indigenous Languages of the Caribbean. In: Keegan WF, Hofman CL, Ramos RR, edi-tors. The Oxford Handbook of Caribbean Archaeology. New York, NY: Oxford University Press; 2013. pp. 61–69.
8. Rouse I. Migrations in prehistory: inferring population movement from cultural remains: New Haven: Yale University Press, c1986
9. Davis DD, Goodwin RC. Island Carib Origins: Evidence and Non-evidence. Am. Antiqu. 1990; 55: 37– 48. doi:10.2307/281491
10. Fitzpatrick SM. The Southward Route Hypothesis. In: Keegan WF, Hofman CL, Rodriguez Ramos R, editors. The Oxford Handbook of Handbook of Caribbean Archeology. New York, NY: Oxford Univer-sity Press; 2013. pp. 198–204.
11. Fitzpatrick SM. A Critical Approach to Dating in the Caribbean: Using Chronometric Hygiene to Evalu-ate Chronological Control and Prehistoric Settlement. Lat Am Antiq. 2006: 389–418.
12. Callaghan RT. Ceramic Age Seafaring and Interaction Potential in the Antilles: A Computer Simula-tion. Curr Anthropol. 2001; 42: 308–313. doi:10.1086/320012
13. Callaghan RT. Comments on the Mainland Origins of the Pre-ceramic Cultures of the Greater Antilles. Lat Am Antiq.2003; 14: 323. doi:10.2307/3557563
16. Mol AA. Costly Giving, Giving Guaizas: towards an organic model of the exchange of social valuables in the Late Ceramic Age Caribbean. Leiden, Netherlands: Sidestone Press; 2007.
17. Patterson TC. Early colonial encounters and identities in the Caribbean: A review of some recent works and their implications. Dialectical Anthropology.1991; 16: 1–13.
18. Hulme P. Colonial encounters: Europe and the native Caribbean, 1492–1797. London; New York: Routledge; 1992.
19. Toro-Labrador G, Wever OR, Martinez-Cruzado JC. Mitochondrial DNA Analysis in Aruba: Strong Maternal Ancestry of Closely Related Amerindians and Implications for the Peopling of Northwestern Venezuela. Caribbean J Sci. 2003; 39: 11–22.
20. González NLS. Sojourners of the Caribbean: ethnogenesis and ethnohistory of the Garifuna: Urbana: University of Illinois Press, c1988.
21. Forte MC. The Political Economy of Tradition: Sponsoring and Incorporating the Caribs of Trinidad and Tobago. Res Econ An. 2006; 24: 329–358. doi:10.1016/S0190-1281(05)24012-X
22. Forte MC. Ruins of absence, presence of Caribs: (post)colonial representations of aboriginality in Trinidad and Tobago. Gainesville: University Press of Florida; 2005.
23. Boucher PP. The Island Caribs: Present State of the Debate. Terrae Incognitae.1992; 24: 55–63. 24. The Central Statistical Office. Trinidad and Tobago 2011 Population and Housing Census
Demo-graphic Report. 2012.
25. Ingram AK. Reading History, Performing Carib: The Santa Rosa Festival and Amerindian Identity in Trinidad. Caribb Stud. 36.2. 2008; 65–94.
26. National Library and Information System Authority. First Peoples Presence in Trinidad and Tobago. http://www.nalis.gov.tt/. 2013.
27. Brereton B. An introduction to the history of Trinidad and Tobago. Oxford, UK: Heinemann; 1996. 28. Forte MC. " We are not extinct": The revival of Carib and Taino identities, the internet, and the
transfor-mation of offline indigenes into online'N-digenes'. Sincronia 1. 2002: 2.
29. Palacio J. A Reconsideration of the Native American and African Roots of Garifuna Identity.http:// www.kacike.org. 2000: 9.
30. Kim JC. The Caribs of St. Vincent and Indigenous Resistance during the Age of Revolutions. Early American Studies: An Interdisciplinary Journal. 2013; 11(1): 117–132.
31. Minority Rights Group. No longer invisible: Afro-Latin Americans today. London: Minority Rights Pub-lications; 1995.
32. Anderson MD. Black and Indigenous: Garifuna activism and consumer culture in Honduras. Minneap-olis: University of Minnesota Press; 2009.
33. Gullick CJMR. The Changing Vincentian Carib Population. In: Mielke J, Crawford M, editors. Current Developments in Anthropological Genetics, Volume 3 Black Caribs A Case Study in Biocultural Adap-tation. New York: Plenum Press; 1984. pp. 37–50. doi:10.1007/978-1-4613-2649-6_3
34. Zhadanov SI, Dulik MC, Markley M, Jennings GW, Gaieski JB, Elias G, et al. Genetic heritage and native identity of the Seaconke Wampanoag tribe of Massachusetts. Am J Phys Anthropol. 2010; 142: 579–589. doi:10.1002/ajpa.21281PMID:20229500
35. Gaieski JB, Owings AC, Vilar MG, Dulik MC, Gaieski DF, Gittelman RM, et al. Genetic ancestry and indigenous heritage in a Native American Descendant Community in Bermuda. Am J Phys Anthropol. 2011; 146: 392–405. doi:10.1002/ajpa.21588PMID:21994016
36. Schurr TG, Dulik MC, Vilar MG, Owings AC, Gaieski JB. The timing and process of the colonization of South America: a North American perspective. Am J Phys Anthropol. 2012; 147: 263–264.
37. Andrews RM, Kubacka I, Chinnery PF, Lightowlers RN, Turnbull DM, Howell N. Reanalysis and revi-sion of the Cambridge reference sequence for human mitochondrial DNA. Nat Genet. 1999; 23: 147– 147. doi:10.1038/13779PMID:10508508
38. Gene Codes Corporation. Sequencher1
version 4.9, Sequence analysis software. 2009;2013. 39. Kloss-Brandstaetter A, Pacher D, Schoenherr S., Weissensteiner H., Binna R, Specht G, Kronenberg
F. HaploGrep: a fast and reliable algorithm for automatic classification of mitochondrial DNA hap-logroups. Human Mutat. 2011; 32: 25–32.
40. Van Oven M, Kayser M. Updated comprehensive phylogenetic tree of global human mitochondrial DNA variation. Hum Mutat. 2009; 30: e386–e394. doi:10.1002/humu.20921PMID:18853457 41. Rozas J, Sanchez-DelBarrio JC, Messeguer X, Rozas R. DnaSP, DNA polymorphism analyses by
42. Karafet TM, Mendez FL, Meilerman MB, Underhill PA, Zegura SL, Hammer MF. New binary polymor-phisms reshape and increase resolution of the human Y chromosomal haplogroup tree. Genome Res. 2008; 18: 830–838. doi:10.1101/gr.7172008PMID:18385274
43. Dulik MC, Owings AC, Gaieski JB, Vilar MG, Andre A, Lennie C, et al. Y-chromosome analysis reveals genetic divergence and new founding native lineages in Athapaskan-and Eskimoan-speaking popula-tions. Proc. Natl.Acad. Sci. 2012; 109: 8471–8476. doi:10.1073/pnas.1118760109PMID:22586127 44. Y Chromosome Consortium. A nomenclature system for the tree of human Y-chromosomal binary
haplogroups. Genome Res. 2002; 12: 339–348. doi:10.1101/gr.217602PMID:11827954 45. Athey T. Haplogroup prediction from Y-STR values using a Bayesian-allele-frequency approach. J
Genet Geneal. 2006; 2: 34–39.
46. Muzzio M, Ramallo V, Motti JM, Santos MR, Lopez Camelo JS, Bailliet G. Software for Y-haplogroup predictions: a word of caution. Int J Legal Med. 2011; 125: 143–147. doi:10.1007/s00414-009-0404-1 PMID:20082090
47. Wang CC, Wang LX, Shrestha R, Wen S, Zhang M, Tong X, et al. Convergence of Y Chromosome STR Haplotypes from Different SNP Haplogroups Compromises Accuracy of Haplogroup Prediction. J Genet Genomics 2015; 42: 403–407. doi:10.1016/j.jgg.2015.03.008PMID:26233895
48. Excoffier L, Laval G, Schneider S. An integrated software package for population genetics data analy-sis, version 3.01. Computational and Molecular Population Genetics Lab. Institute of Zoology, Univer-sity of Berne, Switzerland. 2006.
49. Scientific Working Group on DNA Analysis Methods (SWGDAM), United States of America. Y-Chro-mosome Short Tandem Repeat (Y-STR) Interpretation Guidelines. 2009.
50. Fagundes NJ, Kanitz R, Eckert R, Valls AC, Bogo MR, Salzano FM, et al. Mitochondrial population genomics supports a single pre-Clovis origin with a coastal route for the peopling of the Americas. Am J Hum Genet. 2008; 82: 583–592. doi:10.1016/j.ajhg.2007.11.013PMID:18313026
51. Benn Torres J, Kittles RA, Stone AC. Mitochondrial and Y chromosome diversity in the English-speak-ing Caribbean. Am J Phys Anthropol. 2007; 71: 782–790.
52. Vilar M, Melendez C, Sanders A, Walia A, Gaieski JB, Owings AC, et al. Genetic diversity in south-eastern Puerto Rico: Implications for the prehistoric and historic peopling of the Greater Antilles. Am J Phys Anthropol. 2014 Nov; 155(3):352–68. doi:10.1002/ajpa.22569PMID:25043798
53. Castro de Guerra D, Figuera Pérez C, Bravi CM, Saunier J, Scheible M, Irwin J, et al. Sequence varia-tion of mitochondrial DNA control region in North Central Venezuela. Forensic Sci Int: Genet. 2012; 6: e131–e133. doi:10.1016/j.fsigen.2011.11.004
54. Perego UA, Lancioni H, Tribaldos M, Angerhofer N, Ekins JE, Olivieri A, et al. Decrypting the mito-chondrial gene pool of modern Panamanians. PLoS One. 2012; 7: e38337. doi:10.1371/journal. pone.0038337PMID:22675545
55. Perego UA, Angerhofer N, Pala M, Olivieri A, Lancioni H, Kashani BH, et al. The initial peopling of the Americas: A growing number of founding mitochondrial genomes from Beringia. Genome Res. 2010; 20: 1174–1179. doi:10.1101/gr.109231.110PMID:20587512
56. Yang NN, Mazieres S, Bravi C, Ray N, Wang S, Burley MW, et al. Contrasting patterns of nuclear and mtDNA diversity in Native American populations. Ann Hum Genet. 2010; 74: 525–538. doi:10.1111/j. 1469-1809.2010.00608.xPMID:20887376
57. Tamm E, Kivisild T, Reidla M, Metspalu M, Smith DG, Mulligan CJ, et al. Beringian standstill and spread of Native American founders. PLoS One.2007; 2: e829. PMID:17786201
58. Vona G, Falchi A, Moral P, CalòCM, Varesi L. Mitochondrial sequence variation in the Guahibo Amer-indian population from Venezuela. Am J Phys Anthropol. 2005; 127: 361–369. PMID:15558610 59. Nei M, Kumar S. Molecular evolution and phylogenetics. Oxford: Oxford University Press; 2000. 60. Kruskal JB, Wish M. Multidimensional scaling. Beverly Hills, CA: Sage Publications, Inc; 1978. 61. Lewis PM, Simons GF, Fenning CD, editors. Ethnologue: Languages of the World. 17th Edition ed.
Dallas, Texas: SIL International; 2013.
62. Polzin T, Daneschmand SV. On Steiner trees and minimum spanning trees in hypergraphs. Opera-tions Research Letters. 2003; 31: 12–20.
63. Bandelt H, Forster P, Rohl A. Median-joining networks for inferring intraspecific phylogenies. Mol Biol Evol. 1999; 16: 37–48. PMID:10331250
64. Bandelt H, Forster P, Sykes BC, Richards MB. Mitochondrial portraits of human populations. Genet-ics. 1995; 141: 743–753. PMID:8647407
66. Borjas L, Bernal LP, Chiurillo MA, Tovar F, Zabala W, Lander N, et al. Usefulness of 12 Y-STRs for forensic genetics evaluation in two populations from Venezuela. Leg Med. 2008; 10: 107–112.http:// dx.doi.org.proxy.library.nd.edu/10.1016/j.legalmed.2007.08.005.
67. Leite FP, Callegari‐Jacques SM, Carvalho BA, Kommers T, Matte CH, Raimann PE, et al. Y‐STR analysis in Brazilian and South Amerindian populations. Am J Hum Biol. 2008; 20: 359–363. PMID: 18161040
68. Romero RE, Briceño I, Lizarazo RdP, Willuweit S, Roewer L, Gómez A. A Colombian Caribbean pop-ulation study of 16 Y-chromosome STR loci. Forensic Sci Int. 2008; 2: e5–e8.http://dx.doi.org.proxy. library.nd.edu/10.1016/j.fsigen.2007.09.005.
69. Matamoros M, Yurrebaso I, Gusmão L, García O. Population data for 12 Y-chromosome STR loci in a sample from Honduras. Legal medicine (Tokyo, Japan). 2009; 11: 251–255.
70. Mazieres S, Callegari-Jacques SM, Crossetti SG, Dugoujon JM, Larrouy G, Bois E, et al. French Gui-ana Amerindian demographic history as revealed by autosomal and Y-chromosome STRs. Ann Hum Biol 2010; 38: 76–83. doi:10.3109/03014460.2010.492793PMID:20969509
71. IBM Corporation. IBM SPSS Statistics for Windows, Version 20.0. 16.0 2nd ed. Armonk, NY: IBM Corp.; 2011.
72. Ruitberg CM, Reeder DJ, Butler JM. STRBase: a short tandem repeat DNA database for the human identity testing community. Nucleic Acids Res. 2001; 29: 320–322. PMID:11125125
73. Zhivotovsky LA, Underhill PA, Cinnioglu C, Kayser M, Morar B, Kivisild T, et al. The effective mutation rate at Y chromosome short tandem repeats, with application to human population-divergence time. Am J Hum Genet. 2004; 74: 50–61. PMID:14691732
74. Wei W, Ayub Q, Xue Y, Tyler-Smith C. A comparison of Y-chromosomal lineage dating using either resequencing or Y-SNP plus Y-STR genotyping. Forensic Sci Int Genet 2013. doi:10.1016/j.fsigen. 2013.03.014
75. Reddy BM, Langstieh BT, Kumar V, Nagaraja T, Reddy AN, Meka A, et al. Austro-Asiatic tribes of Northeast India provide hitherto missing genetic link between South and Southeast Asia. PLoS One. 2007; 2: e1141. doi:10.1371/journal.pone.0001141PMID:17989774
76. Leland A, director. Yurumein: Homeland Resistance, Rupture and Repair: The story of the Caribs of St. Vincent in the Caribbean [Video]; 2014.
77. Salas A. Shipwrecks and founder effects. Am J Phys Anthropol. 2005; 128: 855–860. PMID:16047324 78. Ward RH, Redd A, Valencia D, Frazier B, Paabo S. Genetic and linguistic differentiation in the
Ameri-cas. Proc Natl Acad Sci U S A. 1993; 90: 10663–10667 PMID:8248157
79. Kemp BM, Gonzalez-Oliver A, Malhi RS, Monroe C, Schroeder KB, McDonough J, et al. Evaluating the Farming/Language Dispersal Hypothesis with genetic variation exhibited by populations in the Southwest and Mesoamerica. Proc Natl Acad Sci U S A. 2010; 107: 6759–6764. doi:10.1073/pnas. 0905753107PMID:20351276
80. Cabana GS, Merriwether DA, Hunley K, Demarchi DA. Is the genetic structure of Gran Chaco popula-tions unique? Interregional perspectives on Native South American mitochondrial DNA variation. Am J Phys Anthropol. 2006; 131: 108–119. doi:10.1002/ajpa.20410PMID:16485304
81. Zhong H, Shi H, Qi X, Xiao C, Jin L, Ma RZ, et al. Global distribution of Y-chromosome haplogroup C reveals the prehistoric migration routes of African exodus and early settlement in East Asia. J Hum Genet. 2010; 55: 428–435. doi:10.1038/jhg.2010.40PMID:20448651
82. Underhill PA, Passarino G, Lin AA, Shen P, Mirazon Lahr M, Foley RA, et al. The phylogeography of Y chromosome binary haplotypes and the origins of modern human populations. Ann Hum Genet. 2001; 65: 43–62. PMID:11415522
83. Jota MS, Lacerda DR, Sandoval JR, Vieira PPR, Santos‐Lopes SS, Bisso‐Machado R, et al. A new subhaplogroup of Native American Y Chromosomes from the Andes. Am J Phys Anthropol. 2011; 146: 553–559. doi:10.1002/ajpa.21519PMID:21913173
84. Renault-Lescure O. Loanwords in Kali'na, a Cariban language of French Guiana. In: Haspelmath M, Tadmor U, editors. Loanwords in the World's Languages: A comparative Handbook. Berlin, Germany: Walter de Gruyter; 2009. pp. 968–991.
85. Lalueza-Fox C, Calderon L., Calafell F., Morera B., Bertranpetit J. MtDNA from extinct Tainos and the peopling of the Caribbean. Ann Hum Genet. 2001; 65: 137–151. PMID:11427174
86. Lalueza-Fox C, Gilbert M, Martinez-Fuentes A, Calafell F, Bertranpetit J. Mitochondrial DNA from pre-Columbian Ciboneys from Cuba and the prehistoric colonization of the Caribbean. Am J Phys Anthro-pol. 2003; 121: 97–108. PMID:12740952