CONSIDERATIONS REGARDING THE STRUCTURAL RESPONSE OF A
10000X500X100MM PILE DURING PILE DRIVING WITH A 450KG RAM, FALLING
FROM 1M HEIGHT
Ionut – Dragos NEAGU1 Adrian POPA2
Beazit ALI3 Levent ALI4
1
PhDcEngManaging Director – Engineering & Fabrication, Marine and Offshore Consultants 2
Assist prof. PhD Eng. “Mircea cel Batran” Naval Academy 3
Professor PhD Eng. “Mircea cel Batran” Naval Academy 4
PhDcEng, Bureau Veritas, Romania
Abstract: Piles are used when the building soil don’t have enough strength cu support the structure.
One of the pilling methods is to drive the pile. In fact, a vertical pile is hit with a ram. This method is a very good one, because the soil around the pile is compressed and the structure bed is strengthened that way. The negative aspect of this method is the pile is solicited in other ways than it was design.
In this paper are presented the results of a dynamic FEM analysis for a 10000x500x100mm pile when it is hit by a 450kg ram, falling from 1m height.
.
Keywords: FEM, Structural analysis, pile driving
Piles are used when the building soil don’t have enough strength cu support the structure.
One of the pilling methods is to drive the pile. In fact, a vertical pile is hit with a ram. This method is a very good one, because the soil around the pile is compressed and the structure bed is strengthened that way. The negative aspect of this method is the pile is solicited in other ways than it was design.
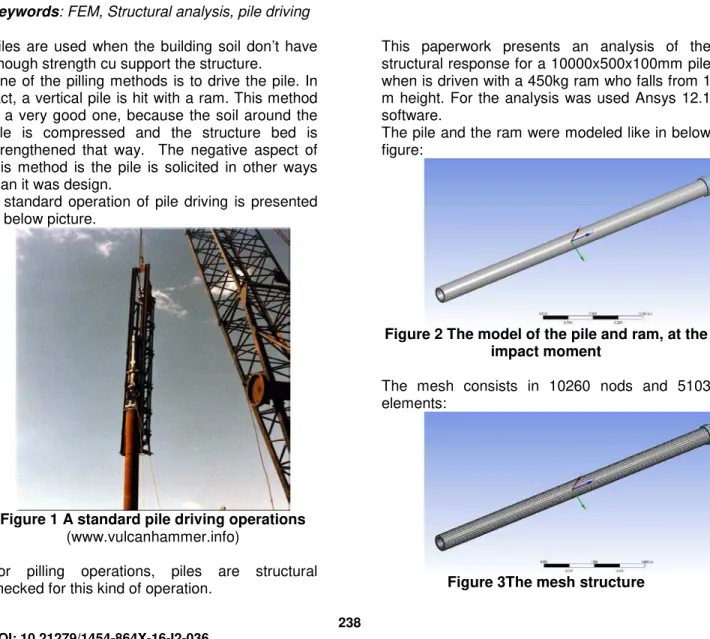
A standard operation of pile driving is presented in below picture.
Figure 1 A standard pile driving operations (www.vulcanhammer.info)
For pilling operations, piles are structural checked for this kind of operation.
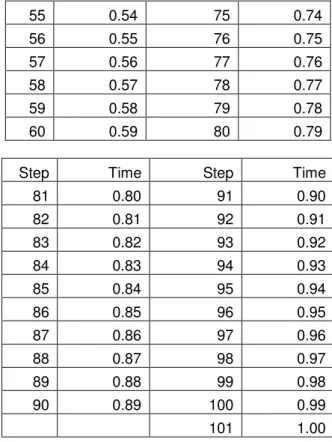
This paperwork presents an analysis of the structural response for a 10000x500x100mm pile when is driven with a 450kg ram who falls from 1 m height. For the analysis was used Ansys 12.1 software.
The pile and the ram were modeled like in below figure:
Figure 2 The model of the pile and ram, at the impact moment
The mesh consists in 10260 nods and 5103 elements:
Figure 3The mesh structure
238 DOI: 10.21279/1454-864X-16-I2-036
The pile was considered to be fixed at the base, and the ram hits the top with 4.429 m/s impact speed. This speed corresponds with the impact speed after 1 m fall.
For studying the structural response we considered the von Mises tensions.
The study was carried out as a dynamic one for one second, in 101 steps:
Table 1: Analysis steps
Step Time Step Time
1 0.00 21 0.20
2 0.01 22 0.21
3 0.02 23 0.22
4 0.03 24 0.23
5 0.04 25 0.24
6 0.05 26 0.25
7 0.06 27 0.26
8 0.07 28 0.27
9 0.08 29 0.28
10 0.09 30 0.29
11 0.10 31 0.30
12 0.11 32 0.31
13 0.12 33 0.32
14 0.13 34 0.33
15 0.14 35 0.34
16 0.15 36 0.35
17 0.16 37 0.36
18 0.17 38 0.37
19 0.18 39 0.38
20 0.19 40 0.39
41 0.40 61 0.60
42 0.41 62 0.61
43 0.42 63 0.62
44 0.43 64 0.63
45 0.44 65 0.64
46 0.45 66 0.65
47 0.46 67 0.66
48 0.47 68 0.67
49 0.48 69 0.68
50 0.49 70 0.69
51 0.50 71 0.70
52 0.51 72 0.71
53 0.52 73 0.72
54 0.53 74 0.73
55 0.54 75 0.74
56 0.55 76 0.75
57 0.56 77 0.76
58 0.57 78 0.77
59 0.58 79 0.78
60 0.59 80 0.79
Step Time Step Time
81 0.80 91 0.90
82 0.81 92 0.91
83 0.82 93 0.92
84 0.83 94 0.93
85 0.84 95 0.94
86 0.85 96 0.95
87 0.86 97 0.96
88 0.87 98 0.97
89 0.88 99 0.98
90 0.89 100 0.99
101 1.00
The minimum value of the von Mises stress for each step is presented below:
V on M is es s tr es s [N /m 2 ] Time [s] Figure 4 Minimum von Mises stress value
variation
The maximum value of the von Mises stress for each step is presented below:
239 DOI: 10.21279/1454-864X-16-I2-036
V
on
Mi
s
es
s
tr
es
s
[
N
/m
2
Time [s] Figure 5 Maximum von Mises stress
valuevariation
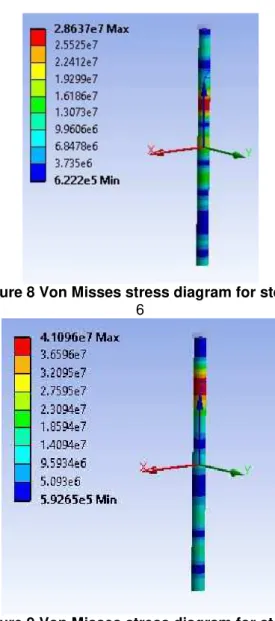
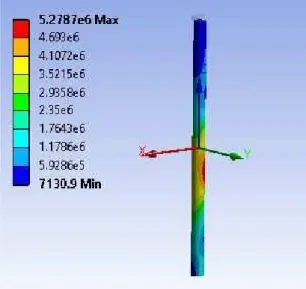
Repartition diagram of the equivalent stress after the impact are presented as follows:
Figure 6 Von Misses stress diagram for step 1
Figure 7 Von Misses stress diagram for step 3
Figure 8 Von Misses stress diagram for step 5 6
Figure 9 Von Misses stress diagram for step 7
Figure 10 Von Misses stress diagram for step 9
240 DOI: 10.21279/1454-864X-16-I2-036
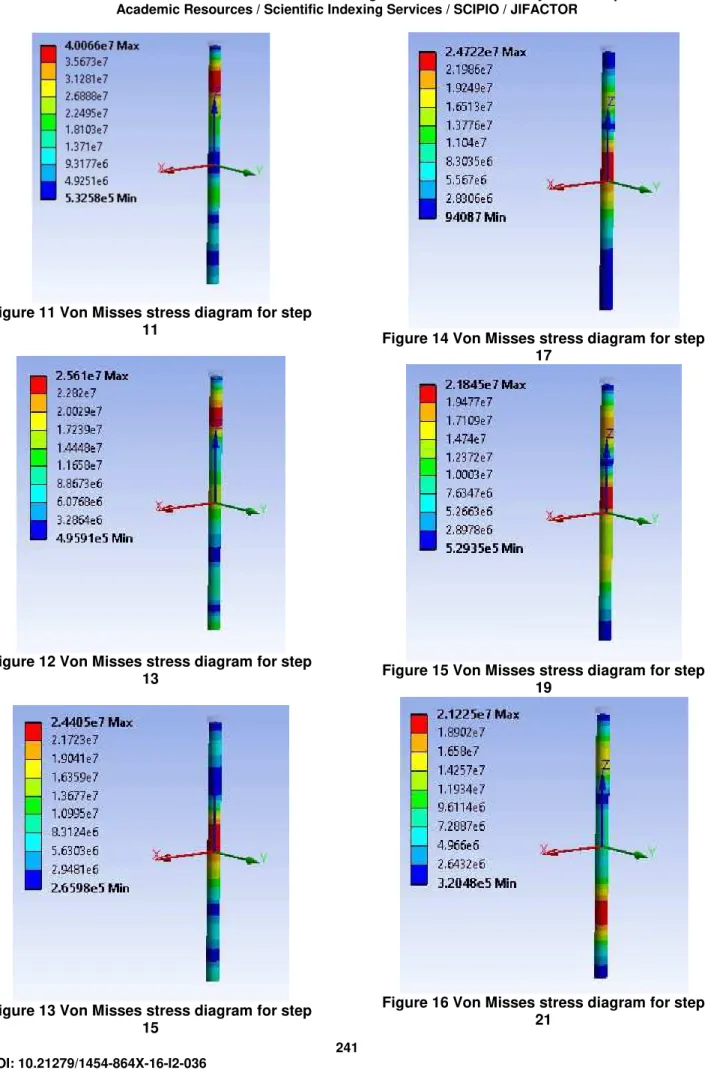
Figure 11 Von Misses stress diagram for step 11
Figure 12 Von Misses stress diagram for step 13
Figure 13 Von Misses stress diagram for step 15
Figure 14 Von Misses stress diagram for step 17
Figure 15 Von Misses stress diagram for step 19
Figure 16 Von Misses stress diagram for step 21
241 DOI: 10.21279/1454-864X-16-I2-036
Figure 17 Von Misses stress diagram for step 23
Figure 18 Von Misses stress diagram for step 25
Figure 19 Von Misses stress diagram for step 27
Figure 20 Von Misses stress diagram for step 29
Figure 21 Von Misses stress diagram for step 31
Figure 22 Von Misses stress diagram for step 33
242 DOI: 10.21279/1454-864X-16-I2-036
Figure 23 Von Misses stress diagram for step 35
Figure 24 Von Misses stress diagram for step 37
Figure 25 Von Misses stress diagram for step 39
Figure 26 Von Misses stress diagram for step 41
Figure 27 Von Misses stress diagram for step 43
Figure 28 Von Misses stress diagram for step 45
243 DOI: 10.21279/1454-864X-16-I2-036
Figure 29 Von Misses stress diagram for step 47
Figure 30 Von Misses stress diagram for step 49
Figure 31 Von Misses stress diagram for step 51
Figure 32 Von Misses stress diagram for step 53
Figure 33 Von Misses stress diagram for step 55
Figure 34 Von Misses stress diagram for step 57
244 DOI: 10.21279/1454-864X-16-I2-036
Figure 35 Von Misses stress diagram for step 59
Figure 36 Von Misses stress diagram for step 61
Figure 37 Von Misses stress diagram for step 63
Figure 38 Von Misses stress diagram for step 65
Figure 39 Von Misses stress diagram for step 67
Figure 40 Von Misses stress diagram for step 69
245 DOI: 10.21279/1454-864X-16-I2-036
Figure 41 Von Misses stress diagram for step 71
Figure 42 Von Misses stress diagram for step 73
Figure 43 Von Misses stress diagram for step 75
Figure 44 Von Misses stress diagram for step 77
Figure 45 Von Misses stress diagram for step 79
Figure 46 Von Misses stress diagram for step 81
246 DOI: 10.21279/1454-864X-16-I2-036
Figure 47 Von Misses stress diagram for step 83
Figure 48 Von Misses stress diagram for step 85
Figure 49 Von Misses stress diagram for step 87
Figure 50 Von Misses stress diagram for step 89
Figure 51 Von Misses stress diagram for step 91
Figure 52 Von Misses stress diagram for step 93
247 DOI: 10.21279/1454-864X-16-I2-036
Figure 53 Von Misses stress diagram for step 95
Figure 54 Von Misses stress diagram for step 97
Figure 55 Von Misses stress diagram for step 99
Figure 56 Von Misses stress diagram for step 101
CONCLUSIONS
The maximum value for the von Misses stress is reached at step 2 (0.01 seconds) and the value is 77.863 [N/mm2].
BIBLIOGRAPHY
[1]
www.ansys.com[2]
www.vulcanhammer.info248 DOI: 10.21279/1454-864X-16-I2-036