www.atmos-chem-phys.net/17/1699/2017/ doi:10.5194/acp-17-1699-2017
© Author(s) 2017. CC Attribution 3.0 License.
Dust deposition and ambient PM
10
concentration in northwest
China: spatial and temporal variability
Xiao-Xiao Zhang1,2, Brenton Sharratt3, Xi Chen1, Zi-Fa Wang2, Lian-You Liu4, Yu-Hong Guo2, Jie Li2, Huan-Sheng Chen2, and Wen-Yi Yang2
1State Key Laboratory of Desert and Oasis Ecology, Xinjiang Institute of Ecology and Geography,
Chinese Academy of Sciences, Urumqi, 830011, China
2State Key Laboratory of Atmospheric Boundary Layer Physics and Atmospheric Chemistry, Institute of
Atmospheric Physics, Chinese Academy of Sciences, Beijing, 100029, China
3USDA-ARS, 215 Johnson Hall, Washington State University, Pullman, WA 99164, USA
4Key Laboratory of Environmental Change and Natural Disaster, Ministry of Education, Beijing Normal
University, Beijing, 100875, China
Correspondence to:Xiao-Xiao Zhang ([email protected])
Received: 15 June 2016 – Published in Atmos. Chem. Phys. Discuss.: 23 June 2016 Revised: 10 January 2017 – Accepted: 15 January 2017 – Published: 3 February 2017
Abstract. Eolian dust transport and deposition are im-portant geophysical processes which influence global bio-geochemical cycles. Currently, reliable deposition data are scarce in central and east Asia. Located at the boundary of central and east Asia, Xinjiang Province of northwest-ern China has long played a strategic role in cultural and economic trade between Asia and Europe. In this paper, we investigated the spatial distribution and temporal variation in dust deposition and ambient PM10 (particulate matter in
aerodynamic diameter≤10 µm) concentration from 2000 to 2013 in Xinjiang Province. This variation was assessed us-ing environmental monitorus-ing records from 14 stations in the province. Over the 14 years, annual average dust depo-sition across stations in the province ranged from 255.7 to 421.4 t km−2. Annual dust deposition was greater in southern Xinjiang (663.6 t km−2) than northern (147.8 t km−2) and eastern Xinjiang (194.9 t km−2). Annual average PM10
con-centration across stations in the province varied from 100 to 196 µg m−3and was 70, 115 and 239 µg m−3in northern,
eastern and southern Xinjiang, respectively. The highest an-nual dust deposition (1394.1 t km−2)and ambient PM
10
con-centration (352 µg m−3) were observed in Hotan, which is
located in southern Xinjiang and at the southern boundary of the Taklamakan Desert. Dust deposition was more intense during the spring and summer than other seasons. PM10was
the main air pollutant that significantly influenced regional
air quality. Annual average dust deposition increased log-arithmically with ambient PM10 concentration (R2≥0.81).
While the annual average dust storm frequency remained un-changed from 2000 to 2013, there was a positive relation-ship between dust storm days and dust deposition and PM10
concentration across stations. This study suggests that sand storms are a major factor affecting the temporal variabil-ity and spatial distribution of dust deposition in northwest China.
1 Introduction
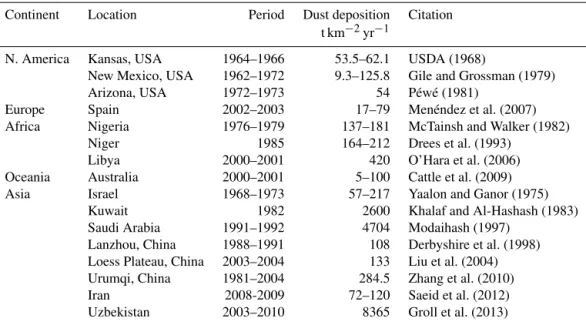
Loess Plateau, China 2003–2004 133 Liu et al. (2004) Urumqi, China 1981–2004 284.5 Zhang et al. (2010) Iran 2008-2009 72–120 Saeid et al. (2012) Uzbekistan 2003–2010 8365 Groll et al. (2013)
Table 2.Dust deposition and PM10concentrations at 14 stations in Xinjiang.
No. Station Region1 Latitude Longitude Population2 Annual dust Annual PM10
(million) deposition concentration (t km−2) (µg m−3)
1 Urumqi NJ 43.832◦N 87.616◦E 2.26 229.4 141 2 Changji NJ 44.017◦N 87.308◦E 0.36 295.7 76 3 Shihezi NJ 44.306◦N 86.080◦E 0.62 107.7 61 4 Bole NJ 44.900◦N 82.071◦E 0.27 133 48 5 Karamay NJ 45.580◦N 84.889◦E 0.29 81.1 54 6 Tacheng NJ 46.691◦N 82.952◦E 0.17 84.9 39 7 Yining NJ 43.912◦N 81.329◦E 0.53 142.7 78 8 Kuytun NJ 44.426◦N 84.903◦E 0.30 108.1 66 9 Hami EJ 42.818◦N 93.514◦E 0.48 209.8 84 10 Turpan EJ 42.957◦N 89.179◦E 0.28 180.1 145 11 Korla SJ 41.727◦N 86.174◦E 0.57 231.8 131 12 Hotan SJ 37.113◦N 79.922◦E 0.33 1394.1 352 13 Kashgar SJ 39.471◦N 75.989◦E 0.57 516.9 236 14 Aksu SJ 41.170◦N 80.230◦E 0.51 511.5 238
1Xinjiang Province was classified into three regions: northern Xinjiang (NJ), eastern Xinjiang (EJ) and southern Xinjiang (SJ). 2Population in 2013 as reported by the Xinjiang Statistical Bureau.
2015; Varga et al., 2016). An understanding of atmospheric dust sources, emissions and deposition is therefore essen-tial to improve our knowledge of dust impact on regional air quality.
Dust in the atmosphere and its subsequent deposition are vital indicators of eolian activity and environmental quality. Deposition has been measured directly at only a few sites; therefore, reliable dust deposition data are lacking around the world (Pye, 1987; Mahowald et al., 1999, 2009; Prospero, 1999; Zhang et al., 2010; Huneeus et al., 2011; Shao et al., 2011). Annual dust deposition ranges from 10 to 200 t km−2
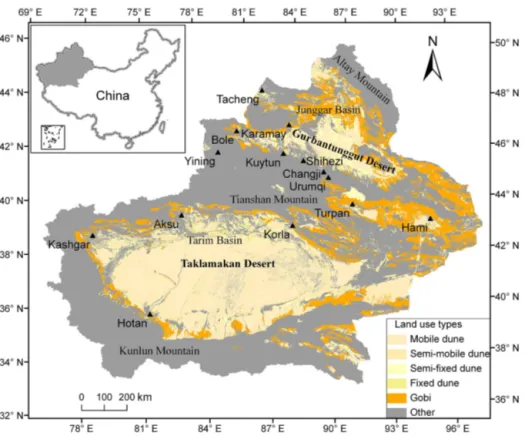
Figure 1.Location of Xinjiang Province in China (gray area outlined on inset map). Dust deposition and concentrations were measured at stations signified by small triangles. Land use types are identified across the province according to Wang et al. (2005).
al., 2013). Recent investigations suggest that the intensity of dust deposition is closely related to weather. For example, dust deposition during extreme highly winds can be 10 to 25 times higher than the annual average (Liu et al., 2004; Zhang et al., 2010; Goudie, 2014). The observations on dust depo-sition are ordinarily scattered and discontinuous. The lim-ited observational data restricted our understanding of dust fluxes between the atmosphere and land surface; thus numer-ical simulations are needed to evaluate dust fluxes and the rate of global dust deposition. Ginoux et al. (2001) simu-lated dust deposition at 16 sites around the world and pre-dicted the annual global dust deposition was approximately 1842 megatons. Shao et al. (2011) estimated that over 2000 megatons of dust is emitted from the Earth’s surface into the atmosphere annually. Zheng et al. (2016) estimated that an-nual average global dust deposition was approximately 1161 megatons. However, uncertainties remain in estimating the dust deposition budget of the Earth system because of the lack of observational data and inaccuracies of parameters in numerical simulations (Ginoux et al., 2001, 2012; Huneeus et al., 2011; Shao et al., 2011; J. Zhang et al., 2014). Ob-servation of worldwide dust deposition is urgently needed to assess biogeochemical cycle of dust on Earth.
Located in east Asia and at the boundary of central Asia, Xinjiang Province of northwestern China has long played a strategic role in cultural and economic trade between Asia and Europe. Xinjiang Province experiences severe sand and
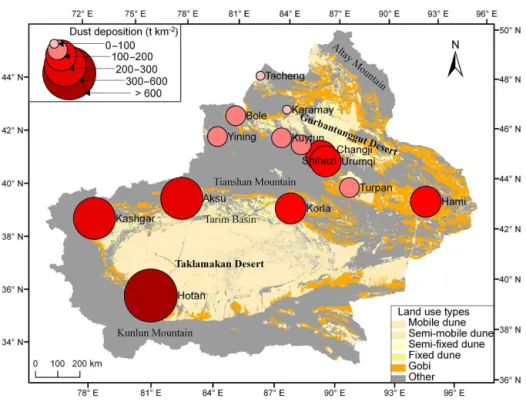
Figure 2.Annual average dust deposition reported at 14 stations in Xinjiang Province from 2000 to 2013. Land use types across the province are identified according to Wang et al. (2005).
2 Methods
2.1 Study area
Xinjiang Province is located in northwest China and is the largest inland province which covers an area of more than 1.6 million km2(Fig. 1). The Taklamakan and Gurban-tunggut deserts are located in the province. The Taklamakan Desert, located in the southern region, is the world’s largest shifting-sand-dune desert. The Gurbantunggut Desert, lo-cated in the northern region, is the largest fixed-dune desert in China. The province is in part characterized by extreme aridity and eolian desertification. The average annual pre-cipitation varies from more than 700 mm in high-altitude forests and mountains to less than 50 mm in the deserts. An-nual potential evaporation can exceed 2000 mm in desert re-gions (Chen, 2010). Sand and dust storms occur throughout the year but are most common in spring. In this study, the province was divided by latitude and longitude into three re-gions, those being northern Xinjiang, eastern Xinjiang and southern Xinjiang (Table 2).
2.2 Experimental data
Dust deposition and PM10 concentration were measured at
environmental monitoring stations maintained by the Xin-jiang Environmental Protection Administration, a division of the Ministry of Environmental Protection (MEP) in China. Data collected at 14 stations (Fig. 1 and Table 2) were used
in this study and represent a spatial distribution within this region.
Dust deposition was determined by the gravimetric method and documented at monthly intervals. Glass cylin-ders were used to monitor dust deposition. Three cylincylin-ders (replicates) were installed to monitor dust deposition at each station. The cylinders (0.15 m in diameter, 0.3 m tall and open at the top) were partly filled with an ethylene glycol (C2H6O2)–water solution prior to deployment. The solution
enabled trapping of dust in a liquid medium at temperatures below 0◦C and also minimized evaporation from the cylin-der. Cylinders were mounted vertically on a tower at approx-imate 10 m above ground. The mass of dust collected by the cylinders was determined after washing the contents out of the cylinders and oven-drying the contents at 105◦. Dust
deposition rate was calculated as the mass of dust per unit area per unit time and expressed in units of t km−2month−1
(MEP, 1994). Monthly and yearly dust deposition data were available through the MEP for the 14 stations from 2000 to 2013.
Ambient PM10 concentration was measured with
high-volume samplers designed to collect particulate matter by filtration. The samplers were installed at 1.5 m above the ground and equipped with fiberglass filters for trapping PM10. PM10 concentration was determined based upon
gravimetric filter analysis and flow rate of each sampler. Daily PM10 concentration data were obtained by the
Figure 3. Annual average dust deposition in Xinjiang Province from 2000 to 2013. Dust deposition in northern, eastern and south-ern Xinjiang is the average deposition at 8, 2 and 4 stations, respec-tively.
of µg m−3 (MEP, 2011). Annual PM10 data were available
through the MEP for the 14 stations (Xinjiang Statistical Bu-reau, 2014).
Daily meteorological data – including dust days, surface wind speed and precipitation – were collected from the China Meteorological Administration. A dust day was defined by visibility according to World Meteorological Organization (WMO) protocol; days on which visibility was < 10 km at any observation time throughout the day constituted a dust day. The WMO further classifies dust days as dust in sus-pension, blowing dust and dust storms (http://www.wmo.int/ pages/prog/www/WMOCodes.html; Shao and Dong, 2006). Dust in suspension constitutes days on which dust is emit-ted at the station at the time of observation and visibility is < 10 km, blowing dust constitutes days on which dust or sand is emitted at the station and visibility is 1–10 km, and dust storms constitutes days on which dust or sand is emitted at the station and visibility is < 1 km. Observations of visibil-ity and wind characteristics at each station were taken at 3 h intervals throughout the day.
Daily air pollution index (API) data were obtained from air quality monitoring statistics published by the MEP (http: //datacenter.mep.gov.cn). These data were used to illustrate the impact of airborne dust versus other air pollutants on air quality. The API is calculated according to the daily concen-tration of three main air pollutants (USEPA, 2006; Wang et al., 2013), namely PM10, SO2 and NO2. The API is
calcu-lated as
API=max(APIi), (1)
APIi=
APIu−APIL
Cu−CL
×(Ci−CL)+APIL, (2)
Figure 4.Monthly average dust deposition in Xinjiang Province from 2000 to 2013. Dust deposition in northern, eastern and south-ern Xinjiang is the average deposition at 8, 2 and 4 stations, respec-tively.
where APIi is the index for pollutant i (i.e., PM10, SO2and
NO2), APIuand APILare the upper and lower limits of the
index for a specific category of air quality (i.e., excellent, slight, moderate, moderately severe and severe),Ciis the ob-served concentration of pollutant, andCuandCLare the
up-per and lower limits of the pollutant for a specific category of air quality.
Information regarding the determination of the API index can be obtained from the MEP (MEP, 2012a, b). Based on the API, air quality was classified as excellent with an API of 0 to 50, slight pollution with an API of 50 to 100, moder-ate pollution with an API of 100 to 200, modermoder-ately severe pollution with an API of 200 to 300 and severe pollution with an API of 300 to 500. For the purpose of this study, we used only API data collected in 2010 since annual deposition and PM10 concentration appeared to typify that which occurred
between 2000 and 2013 in eastern, northern and southern Xinjiang Province.
Temporal trends in dust deposition, PM10 concentration
and dust days were evaluated by testing the significance of the slope estimate using a t test at a probability level (P value) of 0.05.
3 Results and discussion
3.1 Dust deposition
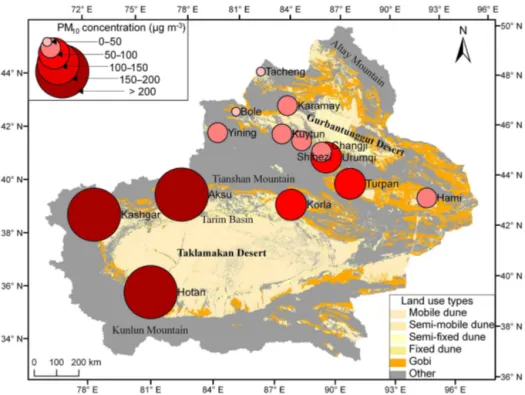
Kara-Figure 5.Annual average PM10concentration reported for 14 stations in Xinjiang Province from 2000 to 2013. Land use types are identified
across the province according to Wang et al. (2005).
may in northern Xinjiang. Based upon spatial characteristics in annual dust deposition, deposition increased from north to south across the province (Fig. 2). The annual average dust deposition was 147.8, 194.9 and 663.6 t km−2in north-ern, eastern and southern Xinjiang, respectively. Generally, the origin of mineral dust could be attributed to both natural and anthropogenic sources (Miller-Schulze et al., 2015). Al-though dust deposition was relatively low (< 150 t km−2)for
the majority of stations in northern Xinjiang Province, dust deposition was at least 50 % higher for stations within the in-dustrial belt on the northern slope of the Tianshan Mountains. This industrial belt includes Changji and Urumqi. High dust deposition in the industrial belt was due to local industry, coal burning and vehicle exhaust (Matinmin and Meixner, 2011; X. X. Zhang et al., 2014). Therefore, the mixing of the an-thropogenic aerosol with transported desert dust contributed to deposition in Changji and Urumqi (Li, et al., 2008).
Figures 3 and 4 depict the temporal variation in dust depo-sition from 2000 to 2013. The highest annual depodepo-sition oc-curred in 2012 in southern Xinjiang, 2002 and 2012 in east-ern Xinjiang, and 2001 in northeast-ern Xinjiang. Over the 14-year period, dust deposition varied with time across Xinjiang Province. The slope estimate of the relation between average dust deposition and year (−6.4±0.1 t km−2yr−1)was sig-nificant atP =0.05. This trend was most apparent in north-ern Xinjiang (slope estimate was −5.6±0.1 t km−2yr−1) and least apparent in southern Xinjiang (slope estimate was−1.9±0.1 t km−2yr−1). High dust deposition occurred in spring in eastern and northern Xinjiang and in spring
and summer in southern Xinjiang (Fig. 4). Dust deposition peaked in April in eastern and northern Xinjiang and in May in southern Xinjiang. This corresponds to the onset of wind erosion caused by intensifying zonal flow and rising air tem-peratures before the arrival of the summer monsoon (Song et al., 2016). The maximum monthly average dust deposition was 97.5 t km−2in southern Xinjiang, which was 6.9 and 8
times more than the deposition in northern and eastern Xin-jiang, respectively. These results suggest that dust deposition in south Xinjiang is of similar magnitude to deposition that occurs in the Middle East and Sahel regions (Khalaf and Al-Hashash, 1983; McTainsh and Walker, 1982; O’Hara et al., 2006).
3.2 PM10concentration
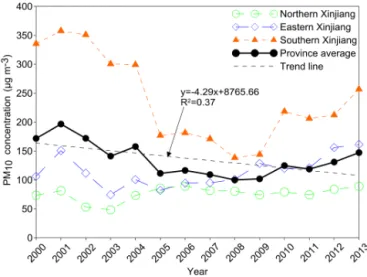
The annual average PM10 concentration in Xinjiang was
125 µg m−3 based upon data collected at 14 stations from 2000 to 2013. Ten stations (71 %) in our study had an an-nual average PM10concentration above the People’s
Repub-lic of China Class II residential standard of 70 µg m−3. The
highest annual average PM10concentration (352 µg m−3)
oc-curred in Hotan in southern Xinjiang, while the lowest av-erage PM10 concentration (46 µg m−3)occurred in Tacheng
in northern Xinjiang. The annual average PM10
concen-tration appeared to increase from northern to southern re-gions (Fig. 5). Annual average PM10 concentration in
Figure 6.Annual average PM10concentration in Xinjiang Province
from 2000 to 2013.
Figure 7.Relationship between annual dust deposition and PM10
concentration in Xinjiang Province. Each point represents data av-eraged across 2000 to 2013 at one station.
239 µg m−3 in northern, eastern and southern Xinjiang, re-spectively. The high annual concentration in southern Xin-jiang is of the same magnitude as found in other desertifi-cation regions of the world such as south Asia, the Middle East and the western Sahel (WHO, 2016a). These high con-centrations of suspended particulates, especially finer partic-ulate, may influence the health of sensitive populations who are susceptible to respiratory illness (Goudie, 2014).
Over the period of record (2000–2013), there was a trend of decreasing PM10concentration in Xinjiang Province. The
slope estimate of the relation between annual PM10
con-centration and year (−4.2±0.1 µg m−3yr−1) was signifi-cant at P =0.05. This trend was most apparent in south-ern Xinjiang (slope estimate was−11.8±0.1 µg m−3yr−1). However, PM10 concentration appeared to increase with
time in eastern and northern Xinjiang (slope estimates were
1.3±0.1 and 3±0.1 µg m−3yr−1, respectively). The slope
estimate, however, was not statistically different from zero and indicated no apparent trend in PM10 concentration with
time in northern Xinjiang. A decrease in both dust deposi-tion and PM10 concentration over 2000 to 2013 suggests a
positive relationship between dust deposition and PM10
con-centration. This relationship is supported by data in Fig. 7. Dust particles are delivered back to the surface by both dry and wet deposition (Shao, 2000). In arid and semi-arid re-gions of central Asia, the deposition process is mainly dom-inated by dry deposition because of less precipitation, which is comprised of gravitational settling, turbulent diffusion and molecular diffusion (Zhang and Shao, 2014; Xi and Sokolik, 2015). Those physical processes from the air to surface are complex and dependent on dust concentration: the higher the dust concentration, the higher the dust deposition (Slinn and Slinn, 1980; Wesely and Hicks, 2000; Petroff, et al., 2008; J. Zhang et al., 2014). Figure 7 showed that dust deposition significantly increased with high PM10 concentration above
200 µg m−3. A logarithmic function fit the data better than a linear function, suggesting that changes in atmospheric PM10
concentration are smaller at higher rates of deposition with a correlation coefficientR2≥0.81. This trend could be due to deposition of larger or more massive particles under more se-vere dust or sand storms. While PM10concentration may rise
under more severe wind erosion events, the limited supply of PM10in sand (major soil type in the province) will likely
sup-press a rise in PM10 concentration in the atmosphere under
more severe erosion events. Nevertheless, from 2000 to 2013, the decline in both dust deposition and PM10 concentration
across Xinjiang could be due to less frequent or intense dust storms because dust deposition in major cities of northern China was found to be closely related to the frequency of sand and dust storms (Zhang et al., 2010).
3.3 Influence of atmospheric dust deposition on local air quality
Daily ambient air quality has been reported by the MEP since 2000. Airborne dust is one of three pollutants influencing the API; thus the relative contribution of dust to the API was of interest. Accordingly, we made a comparative analysis to identify the impact of airborne dust on air quality in Urumqi and Kuytun in northern Xinjiang, Turpan and Hami in east-ern Xinjiang, and Kashgar and Hotan in southeast-ern Xinjiang (Fig. 8). In 2010, there were 178, 286, 351, 334, 363 and 360 days on which PM10was the main constituent of the API
in Kuytun, Urumqi, Turpan, Hami, Kashgar and Hotan, re-spectively (Fig. 8). The PM10constituent accounted for 48.7,
78.4, 96.2, 91.5, 99.5 and 99.6 % of the API in the respec-tive above cities. These data suggest that particulate matter is the main air pollutant in Xinjiang. Severe PM10pollution
(Kash-Figure 8.Daily air pollution index for Kuytun and Urumqi in north-ern Xinjiang, Hami and Turpan in eastnorth-ern Xinjiang, and Kashgar and Hotan in southern Xinjiang in 2010. The main air pollutant contributing to the daily API is identified for each station. “Not de-tected” indicates excellent air quality (API < 50).
gar and Hotan) had higher APIs caused by elevated PM10
concentrations throughout the year. This can be attributed to the violent and persistent eolian activity around the Takla-makan Desert (Pi et al., 2014). Consequently, PM10 is an
important pollutant which dominates ambient air quality in Xinjiang.
3.4 Factors influencing dust deposition and PM10
concentration
Many factors influence ambient particulate concentration and dust deposition, but weather appears to be a dominate factor in arid regions (Zhang et al., 1996, 2010). In fact, dust ac-tivity is highly correlated with variability in global climate and atmospheric circulation (Gong, et al, 2006; Mao et al.,
Figure 9.Dust day frequency in Xinjiang Province from 2000 to 2013.
2011; Shao et al., 2013). The Eurasian atmospheric circula-tion greatly affects weather in central and east Asia (Zhang et al., 1997; Kang et al., 2013; Xi and Sokolik, 2015). Dust activities are primarily driven by the strength of cyclones and the Siberian High affecting the study region (Park et al., 2011; Shao et al., 2013). Strong winds associated with this at-mospheric circulation cause large amounts of dust to be emit-ted into the atmosphere. Deserts in central Asia are an im-portant source of atmospheric mineral dust (Miller-Schulze et al., 2015). Under the strong westerly circulation, atmo-spheric dust can be transported a few hundred kilometers to the east and be deposited through wet scavenging and dry settling (Shao, 2000; Chen et al., 2014). Despite the Takli-makan and Gurbantunggut deserts being local sources of dust in Xinjiang Province, long-range transport of dust from the central Asian Aralkum, Karakum, Caspian and Kyzylkum deserts (Indoitu et al., 2012) could also contribute to the dust deposition and ambient PM10concentration in
neighbor-ing Xinjiang Province. Since the 1980s, the Aralkum Desert in Uzbekistan and Kazakhstan has become one of world’s youngest deserts and a potential source of salt dust in east Asia (Indoitu et al., 2012; Groll et al., 2013; Opp et al., 2016). Climate also directly influences the atmospheric environ-ment of arid and semi-arid areas (Wei et al., 2004; Zu et al., 2008; Huang et al., 2014). The annual average precip-itation in north, east and south Xinjiang is 237, 94 and 87 mm, respectively. Dust emission was negatively corre-lated with precipitation (Gong et al., 2006). Therefore, the lack of precipitation contributes to dust emissions. In fact, regions with lower precipitation have higher PM10
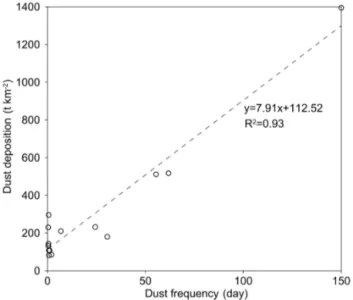
dis-Figure 10. Relationship between annual dust deposition and dust day frequency in Xinjiang Province. Each point represents data av-eraged across 2000 to 2013 at one station.
tribution in south Xinjiang (including the Tarim Basin and Taklamakan Desert), however, is strongly affected by wind flow patterns. Eolian transport in the Taklamakan Desert is predominantly from the northeast toward the south (Wang et al., 2014; Rittner et al., 2016). Huang et al. (2014) reported that the Taklamakan Desert is a source of fine dust particles (≤3 µm in aerodynamic diameter) which significantly influ-ences East Asia. Strong northeast winds dominate the pre-vailing wind regime in the eastern Taklamakan Desert; these winds influence air quality in both the eastern and the south-eastern parts of the desert. The western and northern parts of the Taklamakan Desert and Tarim Basin are highly affected by west, northwest and north winds (Sun and Liu, 2006; Zan et al., 2014; Li et al., 2015). Under prevailing winds, dust aerosols are transported from the northern to the southern Taklamakan Desert (e.g., Hotan city) and thereby cause high ambient PM10concentration and dust deposition.
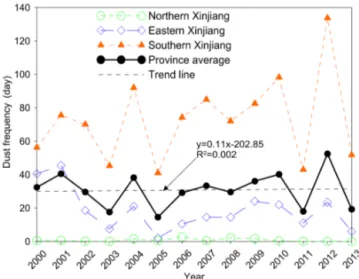
Spatial differences in dust deposition and PM10
concentra-tion across Xinjiang Province may also be due in part to dif-ferences in frequency of dust days in the region. Dust storms normally occurred in all seasons in southern Xinjiang. The magnitude of wind erosion and dust day frequency in south-ern Xinjiang is nearly twice as large as in northsouth-ern and east-ern Xinjiang (Wang et al., 2006). Figure 9 displays the vari-ation in dust day frequency in Xinjiang Province from 2000 to 2013. The data indicate that the annual average frequency of dust days fluctuated from 15 to 52 days. The frequency of dust days in the southern region ranged from 41 to 133 days, while the frequency of dust days in eastern and northern gions ranged from 2 to 45 days and from 0 to 3 days, re-spectively, across years. The slope estimate of the relation-ship between dust days and years (0.11 day yr−1)indicated no apparent trend for an increase or decrease in dust days
Figure 11.Relationship between PM10concentration and dust day
frequency in Xinjiang Province. Each point represents data aver-aged across 2000 to 2013 at one station.
from 2000 to 2013. Thus, despite no temporal trend in dust days, we observed a decline in dust deposition and PM10
concentration across years. This decline in dust deposition or PM10 concentration could be due to a decrease in
fre-quency of severe dust days versus frefre-quency of dust days from 2000 to 2013 in the region. We are unaware of any previous study which has examined dust day severity in Xin-jiang Province; thus we used data available through the China Meteorological Administration to assess trends in dust day severity. Dust days were characterized according to dust-in-suspension, blowing dust and dust storm events. Although there was no trend in the frequency of blowing dust and dust storm events from 2000 to 2013, there was a trend for fewer dust-in-suspension events from 2000 to 2013 (Fig. S1 in the Supplement). Thus, there appeared to be a close asso-ciation between frequency of dust-in-suspension events and PM10concentration and dust deposition. Nevertheless, in
ex-amining the relationship between average annual dust days and dust deposition or PM10 concentration across stations,
the frequency of dust days was closely related to dust de-position (R2=0.93; Fig. 10) and ambient PM10
concentra-tion (R2=0.89; Fig. 11). There was a significant increase in dust deposition (7.91 t km−2day−1)and PM10
concentra-tion (2.06 µg m−3day−1)associated with an increase in dust days.
4 Conclusions
The atmospheric environment of central and east Asia is severely affected by the airborne dust; thus this study was un-dertaken to quantify dust deposition and ambient PM10
The spatial distribution and temporal variability in dust de-position and ambient PM10concentration showed significant
variation and a trend for lower deposition and concentration with time. The interannual dynamic of dust deposition var-ied significantly with seasonality. Spring and summer had the highest dust deposition (1.3 times the average), followed by autumn and winter. The highest intensity of dust deposition was observed in May, followed by April, June and July.
In dust source areas such as Xinjiang, China, windblown sand and dust affect air quality, especially during the spring season. The analysis of the data indicated no trend in fre-quency of dust days from 2000 to 2013. A positive relation-ship existed, however, between dust days and dust deposition as well as airborne PM10 concentration across stations. The
effect of weather on dust deposition and ambient air qual-ity cannot be expressed by a simple correlation and should not be extrapolated based on the currently limited evidence. This study provides information on the potential spatiotem-poral dust deposition and ambient dust aerosol variation in east Asia. Although longer-term datasets are needed to ad-dress trends over longer time periods, this work can aid in adjusting model parameters in simulating dry dust deposi-tion or PM10concentration in desertification regions of east
Asia.
5 Data availability
The data used in this study are available upon request by con-tacting corresponding author ([email protected]).
The Supplement related to this article is available online at doi:10.5194/acp-17-1699-2017-supplement.
Competing interests. The authors declare that they have no conflict of interest.
Carslaw, K. S., Lee, L. A., Reddington, C. L., Pringle, K. J., Rap, A., Forster, P. M., Mann, G. W., Spracklen, D. V., Woodhouse, M. T., Regayre, L. A., and Pierce, J. R.: Large contribution of natural aerosols to uncertainty in indirect forcing, Nature, 503, 67–71, doi:10.1038/nature12674, 2013.
Cattle, S. R., McTainsh, G. H., and Elias, S.: Aeolian dust deposi-tion rates, particle-sizes and contribudeposi-tions to soils along a tran-sect in semi-arid New South Wales, Australia, Sedimentology, 56, 765–783, doi:10.1111/j.1365-3091.2008.00996.x, 2009. Chen, S., Huang, J., Zhao, C., Qian, Y., Leung, L. R., and Yang, B.:
Modeling the transport and radiative forcing of Taklimakan dust over the Tibetan Plateau: A case study in the summer of 2006, J. Geophys. Res.-Atmos., 118, 797–812, doi:10.1002/jgrd.50122, 2013.
Chen, S., Zhao, C., Qian, Y., Leung, L. R., Huang, J., Huang, Z., Bi, J., Zhang, W., Shi, J., Yang, L., Li, D., and Li, J.: Regional modeling of dust mass balance and radiative forc-ing over East Asia usforc-ing WRF-Chem, Aeolian Res., 15, 15–30, doi:10.1016/j.aeolia.2014.02.001, 2014.
Chen, X.: Physical geography of arid land in China, Science Press, Beijing, 124–155, 2010.
Derbyshire, E., Meng, X., and Kemp, R.A.: Provenance, transport and characteristics of modern aeolian dust in western Gansu Province, China, and interpretation of the quaternary loess record, J. Arid Environ., 39, 497–516, doi:10.1006/jare.1997.0369, 1998.
Dong, Z., Lv, P., Qiang, G., Xia, X., Zhao, Y., and Mu G.: Re-search progress in China’s Lop Nur, Earth-Sci. Rev., 111, 142– 153, doi:10.1016/j.earscirev.2011.11.003, 2012.
Drees, L. R., Manu, A., and Wilding, L. P.: Characteristics of aeolian dusts in Niger, West Africa, Geoderma, 59, 213–233, doi:10.1016/0016-7061(93)90070-2, 1993.
Duce, R. A., Liss, P. S., Merrill, J. T., Atlas, E. L, Buat-Menard, P., Hicks, B. B., Miller, J. M., Prospero, J. M., Arimoto, R, Church, T. M., Ellis, W., Galloway, J. N., and Hansen, L.: The atmo-spheric input of trace species to the world ocean, Global Bio-geochem. Cy., 5, 193–259, doi:10.1029/91GB01778, 1991. Gile, L. H. and Grossman, R. B.: The desert project soil monograph:
soils and landscapes of a desert region astride the Rio Grande Valley near Las Cruces, New Mexico, USDA-SCS, Washington D.C., 1979.
aerosols simulated with the GOCART model, J. Geophys. Res., 106, 20255–20273, doi:10.1029/2000JD000053, 2001.
Ginoux, P., Prospero, J. M., Gill, T. E., Hsu, N. C., and Zhao, M.: Global-scale attribution of anthropogenic and nat-ural dust sources and their emission rates based on MODIS Deep Blue aerosol products, Rev. Geophys., 50, RG3005, doi:10.1029/2012RG000388, 2012.
Gong, S. L, Zhang, X. Y., Zhao, T. L., Zhang, X. B., Barrie, L. A., Mckendry, I. G., and Zhao, C. S.: A Simulated climatology of Asian dust aerosol and its trans-Pacific transport, Part II: Inter-annual variability and climate connections, J. Climate, 19, 104– 122, doi:10.1175/JCLI3606.1, 2006.
Goudie, A. S.: Desert dust and human health disorders, Environ. Int., 63, 101–113, doi:10.1016/j.envint.2013.10.011, 2014. Groll, M., Opp, Chr., and Aslanov, I.: Spatial and temporal
dis-tribution of the dust deposition in Central Asia – results from a long term monitoring program, Aeolian Res., 9, 49–62, doi:10.1016/j.aeolia.2012.08.002, 2013.
Huang, J., Fu, Q., Su, J., Tang, Q., Minnis, P., Hu, Y., Yi, Y., and Zhao, Q.: Taklimakan dust aerosol radiative heating derived from CALIPSO observations using the Fu-Liou radiation model with CERES constraints, Atmos. Chem. Phys., 9, 4011–4021, doi:10.5194/acp-9-4011-2009, 2009.
Huang, J., Wang, T., Wang, W., Li, Z., and Yan, H.: Cli-mate effects of dust aerosols over East Asian arid and semi-arid regions, J. Geophys. Res.-Atmos., 119, 11398–11416, doi:10.1002/2014JD021796, 2014.
Huang, X., Oberhänsli, H., von Suchodoletz H., and Sor-rel P.: Dust deposition in the Aral Sea: implications for changes in atmospheric circulation in central Asia during the past 2000 years, Quaternary Sci. Rev., 30, 3661–3674, doi:10.1016/j.quascirev.2011.09.011, 2011.
Huneeus, N., Schulz, M., Balkanski, Y., Griesfeller, J., Prospero, J., Kinne, S., Bauer, S., Boucher, O., Chin, M., Dentener, F., Diehl, T., Easter, R., Fillmore, D., Ghan, S., Ginoux, P., Grini, A., Horowitz, L., Koch, D., Krol, M. C., Landing, W., Liu, X., Mahowald, N., Miller, R., Morcrette, J.-J., Myhre, G., Penner, J., Perlwitz, J., Stier, P., Takemura, T., and Zender, C. S.: Global dust model intercomparison in AeroCom phase I, Atmos. Chem. Phys., 11, 7781–7816, doi:10.5194/acp-11-7781-2011, 2011. Husar, R. B., Tratt, D. M., Schichtel, B. A., Falke, S. R., Li, F.,
Jaffe, D., Gasso, S., Gill, T., Laulainen, N. S., Lu, F., Reheis, M. C., Chun, Y., Westphal, D., Holben, B. N., Gueymard, C., McK-endry, I., Kuring, N., Feldman, G. C., McClain, C., Frouin, R. J., Merrill, J., DuBois, D., Vignola, F., Murayama, T., Nickovic, S., Wilson, W. E., Sassen, K., Sugimoto, N., and Malm, W. C.: The Asian dust events of April 1998, J. Geophys. Res, 106, 18317– 18330, doi:10.1029/2000JD900788, 2001.
Indoitu, R., Orlovsky, L., and Orlovsky, N.: Dust storms in Central Asia: Spatial and temporal variations, J. Arid Environ., 85, 62– 70, doi:10.1016/j.jaridenv.2012.03.018, 2012.
IPCC: Intergovernmental Panel on Climate Change, Climate change-the physical science basis, Cambridge University Press, New York, 252–271, 2013.
Kang, L., Ji, M., Huang, J., and Guan, X.: Impact of Eurasian atmospheric circulation on dust events in spring over northern China, J. Desert Res., 33, 1453–1460, doi:10.7522/j.issn.1000-694X.2013.00211, 2013.
Khalaf, F. and Al-Hashash, M.: Aeolian sedimentation in the north-western part of the Arabian Gulf, J. Arid Environ., 6, 319–332, 1983.
Li, F., Zhao, L., Zhang, H., Zhang, T., and Shirato, Y.: Wind ero-sion and airborne dust deposition in farmland during spring in the Horqin Sandy Land of eastern Inner Mongolia, China, Soil Till. Res., 75, 121–130, doi:10.1016/j.still.2003.08.001, 2004. Li, J., Zhuang, G., Huang, K., Lin, Y., Xu, C., and Yu, S.:
Charac-teristics and sources of air-borne particulate in Urumqi, China, the upstream area of Asia dust, Atmos. Environ., 42, 776–787, doi:10.1016/j.atmosenv.2007.09.062, 2008.
Li, J., Wang, Z., Zhuang, G., Luo, G., Sun, Y., and Wang, Q.: Mix-ing of Asian mineral dust with anthropogenic pollutants over East Asia: a model case study of a super-duststorm in March 2010, Atmos. Chem. Phys., 12, 7591–7607, doi:10.5194/acp-12-7591-2012, 2012.
Li, X., Feng, G., Sharratt, B., and Zheng, Z.: Aerodynamic properties of agricultural and natural surfaces in north-western Tarim Basin, Agr. Forest Meteorol., 204, 37–45, doi:10.1016/j.agrformet.2015.01.005, 2015.
Lin, Y. and Feng, J.: Aeolian dust contribution to the formation of alpine soils at Amdo (Northern Tibetan Plateau), Geoderma, 259–260, 104–115, doi:10.1016/j.geoderma.2015.05.012, 2015. Liu, L. Y., Shi, P. J., Gao, S. Y., Zou, X. Y., Erdon, H., Yan, P., Li, X. Y., Ta, W. Q., Wang, J. H., and Zhang, C. L.: Dustfall in China’s western loess plateau as influenced by dust storm and haze events, Atmos. Environ., 38, 1699–1703, doi:10.1016/j.atmosenv.2004.01.003, 2004.
Mahowald, N. M, Kohfeld, K. E., Hansson, M., Balkanski, Y., Har-rison, S. P., Prentice, I. C., Michael, S., and Rodhe, H.: Dust sources and deposition during the last glacial maximum and cur-rent climate: a comparison of model results with paleodata from ice cores and marine sediments, J. Geophys. Res., 104, 15895– 916, doi:10.1029/1999JD900084, 1999.
Mahowald, N. M., Engelstaedter, S., Luo, C., Sealy, A., Artaxo, P., Benitez-Nelson, C., Bonnet, S., Chen, Y., Chuang, PY., Cohen, D. D., Dulac, F., Herut, B., Johansen, A. M., Kubilay, N., Losno, R., Maenhaut, W., Paytan, A., Prospero, J. M., Shank, L. M., and Siefert, R. L.: Atmospheric iron deposition: global distribu-tion, variability, and human perturbations, Annu. Rev. Mar. Sci, 1, 245–278, doi:10.1146/annurev.marine.010908.163727, 2009. Mamtimin, B. and Meixner, F.: Air pollution and
meteoro-logical processes in the growing dryland city of Urumqi (Xinjiang, China), Sci. Total Environ., 409, 1277–1290, doi:10.1016/j.scitotenv.2010.12.010, 2011.
Mao, R., Ho, C., Shao, Y., Gong, D., and Kim, J.: Influence of Arctic Oscillation on dust activity over northeast Asia, Atmos. Environ., 45, 326–337, doi:10.1016/j.atmosenv.2010.10.020, 2011. McTainsh, G. H. and Walker, P.H.: Nature and distribution of
Har-mattan dust, Z. Geomorphol., 26, 417–435, 1982.
Menéndeza, I., Díaz-Hernándezb, J. L., and Mangasa, J.: Airborne dust accumulation and soil development in the North-East sector of Gran Canaria (Canary Islands, Spain), J. Arid Environ., 71, 57–81, doi:10.1016/j.jaridenv.2007.03.011, 2007.
MEP: Ministry of Environmental Protection, China, Ambient Air Determination of Dustfall Gravimetric Method (GB/T 15265– 1994), Standards Press of China, Beijing, 1994.
36, 211–223, doi:10.1006/jare.1996.0225, 1997.
O’Hara, S. L., Clarke, M. L., and Elatrash, M. S.: Field measure-ments of desert dust deposition in Libya, Atmos. Environ., 40, 3881–3897, doi:10.1016/j.atmosenv.2006.02.020, 2006. Opp, C., Groll, M., Aslanov, I., Lotz T., and Vereshagina, N.:
Ae-olian dust deposition in the southern Aral Sea region (Uzbek-istan): Ground-based monitoring results from the LUCA project, Quatern. Int., doi:10.1016/j.quaint.2015.12.103, 2016.
Osada, K., Ura, S., Kagawa, M., Mikami, M., Tanaka, T. Y., Ma-toba, S., Aoki, K., Shinoda, M., Kurosaki, Y., Hayashi, M., Shimizu, A., and Uematsu, M.: Wet and dry deposition of min-eral dust particles in Japan: factors related to temporal variation and spatial distribution, Atmos. Chem. Phys., 14, 1107–1121, doi:10.5194/acp-14-1107-2014, 2014.
Park, T. W., Ho, C. H., Jeong, S. J., Choi, Y. S., Park, S. K., and Song, C. K.: Different characteristics of cold day and cold surge frequency over East Asia in a global warming situation, J. Geo-phys. Res., 116, D12118, doi:10.1029/2010JD015369, 2011. Péwé, T. L.: Desert dust: origin, characteristics, and effect on man,
Geol. Soc. Am. Bull., 186, 1–10, doi:10.1130/SPE186-p1, 1981. Petroff, A., Mailliat, A., Amielh, M., and Anselmet, F.: Aerosol dry deposition on vegetative canopies. Part I: Re-view of present knowledge, Atmos. Environ., 42, 3625–3653, doi:10.1016/j.atmosenv.2007.09.043, 2008.
Pi, H., Feng, G., Sharratt, B., Li, X., and Zheng, Z.: Val-idation of SWEEP for contrasting agricultural land use types in the Tarim Basin, Soil Sci., 179, 433–445, doi:10.1097/SS.0000000000000083, 2014.
Prospero J. M.: Long-range transport of mineral dust in the global atmosphere: impact of African dust on the environment of the southeastern United States, P. Natl. Acad. Sci. USA, 96, 3396– 3403, doi:10.1073/pnas.96.7.3396, 1999.
Pye, K.: Aeolian dust and dust deposits, Academic Press, London, 5–63, 1987.
Rittner, M., Vermeesch, P., Carter, A., Bird, A., Stevens, T., Garzanti, E., Andò, S., Vezzoli, G., Dutt, R., Xu, Z., and Lu, H.: The provenance of Taklamakan desert sand, Earth Planet. Sc. Lett., 437, 127–137, doi:10.1016/j.epsl.2015.12.036, 2016. Saeid, H., Khademia, H., Angel, F., and Ahmad, L.:
Char-acteristics of dust deposited along a transect between cen-tral Iran and the Zagros Mountains, Catena, 88, 27–36, doi:10.1016/j.catena.2011.09.002, 2012.
Shoemaker, J. K., Schrag, D. P., Molina, M. J., and Rmanathan, V.: What role for short-lived climate pollutants in mitigation policy, Science, 342, 1323–1324, doi:10.1126/science.1240162, 2013. Simonson, R.: Airborne dust and its significance to soil, Geoderma,
65, 1–43, doi:10.1016/0016-7061(94)00031-5, 1995.
Slinn, S. A. and Slinn, W. G. N.: Predictions for particle de-position on natural waters, Atmos. Environ., 14, 1013–1016, doi:10.1016/0004-6981(80)90032-3, 1980.
Song, H., Zhang, K., Piao, S., and Wan, S.: Spatial and tem-poral variations of spring dust emissions in northern China over the last 30 years, Atmos. Environ., 126, 117–127, doi:10.1016/j.atmosenv.2015.11.052, 2016.
Stanhill, G.: Global dimming: a new aspect of climate change, Weather, 60, 11–14, doi:10.1256/wea.210.03, 2005.
Sun, J. and Liu, T.: The age of the Taklimakan Desert, Science, 312, 1621, doi:10.1126/science.1124616, 2006.
Tsoar, H. and Pye, K.: Dust transport and the question of desert loess formation, Sedimentology, 34, 139–153, doi:10.1111/j.1365-3091.1987.tb00566.x, 1987.
Uno, I., Eguchi, K., and Yumimoto, K.: Asian dust transported one full circuit around the globe, Nat. Geosci., 2, 557–560, doi:10.1038/ngeo583, 2009.
USEPA: Guideline for reporting of daily air quality – the Air Qual-ity Index (AQI), US Environmental Protection Agency, Office of Air Quality Planning and Standards, Research Triangle Park, North Carolina, 2006.
USDA: Dust deposition and weather, Weatherwise, 21, 65–70, doi:10.1080/00431672.1968.9932796, 1968.
Varga, G., Cserháti, C., Kovács, J., and Szaliai, Z.: Saharan dust deposition in the Carpathian Basin and its possible ef-fects on interglacial soil formation, Aeolian Res., 22, 1–12, doi:10.1016/j.aeolia.2016.05.004, 2016.
Wake, C. P. and Mayewski, P. A.: Modern aeolian dust deposi-tion in central Asia, Tellus, 46B, 220–233, doi:10.1034/j.1600-0889.1994.t01-2-00005.x, 1994.
Wang, H., Jia, X., Lib, K., and Wang, H.: External supply of dust in the Taklamakan sand sea, Northwest China, reveals the dust-forming processes of the modern sand sea surface, Catena, 119, 104–115, doi:10.1016/j.catena.2014.03.015, 2014.
Wang, X., Oenema, O., Hoogmoed, W. B., Perdok, U. D., and Cai, D.: Dust storm erosion and its impact on soil carbon and nitrogen losses in northern China, Catena, 66, 221–227, doi:10.1016/j.catena.2006.02.006, 2006.
Wang, Y. M., Wang, J. H., Qi, Y., and Yan, C. Z.: China 1:100000 Desert (Sand land) Map, Environmental and Ecological Sci-ence Data Centre for West China (http://westdc.westgis.ac.cn), doi:10.3972/westdc.006.2013.db, 2005.
Wei, W. S., Gao, W. D., Shi, Y. G., and Osamu, A. B. E.: Influence of climate and environment change on dust storms in Xinjiang, China, J. Arid Land Geogr., 27, 137–141, doi:10.13826/j.cnki.cn65-1103/x.2004.02.002, 2004.
Wesely M. L. and Hicks B. B.: A review of the current status of knowledge on dry deposition, Atmos. Environ., 34, 2261–2282, doi:10.1016/S1352-2310(99)00467-7, 2000.
WHO: Ambient Air Pollution database, available at: http: //gamapserver.who.int/mapLibrary/app/searchResults.aspx, last access: May 2016a.
WHO: Ambient (outdoor) air quality and health, available at: http://www.who.int/mediacentre/factsheets/fs313/en/, last ac-cess: September 2016b.
Xi, X. and Sokolik, I. N.: Dust interannual variability and trend in Central Asia from 2000 to 2014 and their climatic linkages, J. Geophys. Res., 120, 12175–12197, doi:10.1002/2015JD024092, 2015.
Xinjiang Statistical Bureau: Xinjiang Statistical Yearbook 2014, China Statistical Press, Beijing, 60–225, 2014.
Xu, J., Hou, S., Qin, D., Kang, S., Ren, J., and Ming, J.: Dust storm activity over the Tibetan Plateau recorded by a shal-low ice core from the north slope of Mt. Qomolangma (Ever-est), Tibet-Himal region, Geophys. Res. Lett., 34, L17504, doi:10.1029/2007GL030853, 2007.
Xuan, J.: Dust emission factors for environment of northern China, Atmos. Environ., 33, 1767–1776, doi:10.1016/S1352-2310(98)00339-2, 1999.
Xuan, J., Liu, G. L., and Du, K.: Dust emission inventory in north-ern China, Atmos. Environ., 34, 4565–4570, doi:10.1016/S1352-2310(00)00203-X, 2000.
Yaalon, D. H. and Ganor, E.: Rates of aeolian dust accretion in the Mediterranean and desert fringe environments of Israel, 9th Inter-national Sedimentological Congress, Nice, France, 2, 169–174, 1975.
Zan, J., Fang, X., Appel, E., Yan, M., and Yang, S.: New insights into the magnetic variations of aeolian sands in the Tarim Basin and its paleoclimatic implications, Phys. Earth Planet. In., 229, 82–87, doi:10.1016/j.pepi.2014.01.010, 2014.
Zhang, D.: Preliminary analysis on climatology of dust deposition in China history, Sci. Sinica, 3, 278–288, 1984.
Zhang, J. and Shao, Y.: A new parameterization of particle dry de-position over rough surfaces, Atmos. Chem. Phys., 14, 12429– 12440, doi:10.5194/acp-14-12429-2014, 2014.
Zhang, J., Shao, Y., and Huang, N.: Measurements of dust deposi-tion velocity in a wind-tunnel experiment, Atmos. Chem. Phys., 14, 8869–8882, doi:10.5194/acp-14-8869-2014, 2014.
Zhang, X. X., Shi, P. J., Liu, L. Y., Tang, Y., Cao, H. W., Zhang, X. N., Hu, X., Guo, L. L., Lue, Y. L., Qu, Z. Q., Jia, Z. J., and Yang, Y. Y.: Ambient TSP concentration and dustfall in major cities of China: spatial distribution and temporal variability, Atmos. Envi-ron., 44, 1641–1648, doi:10.1016/j.atmosenv.2010.01.035, 2010. Zhang, X. X., Chen, X., Guo, Y. H., Wang, Z. F., Liu, L. Y., Paul, C., Li, S. Y., and Pi, H. W.: Ambient TSP concentration and dustfall variation in Urumqi, China, J. Arid Land, 6, 668–677, doi:10.1007/s40333-014-0069-6, 2014.
Zhang, X. Y., Shen, Z. B., Zhang, G. Y., Chen, T., and Liu, H.: Remote mineral aerosols in westerlies and their contributions to the Chinese loess, Sci. China Ser. D, 39, 134–143, 1996. Zhang, X. Y., Arimoto, R., and An, Z. S.: Dust emission
from Chinese desert sources linked to variations in atmo-spheric circulation, J. Geophys. Res., 102, 28041–28047, doi:10.1029/97JD02300, 1997.
Zheng, Y., Zhao, T., Che, H., Liu, Y., Han, Y., Liu, C., Xiong, J., Liu, J., and Zhou, Y.: A 20-year simulated climatology of global dust aerosol deposition, Sci. Total Environ., 557–558, 861–868, doi:10.1016/j.scitotenv.2016.03.086, 2016.