BGD
4, 2525–2557, 2007Impact of dust on ocean biogeochemistry
A. Tagliabue et al.
Title Page
Abstract Introduction
Conclusions References
Tables Figures
◭ ◮
◭ ◮
Back Close
Full Screen / Esc
Printer-friendly Version
Interactive Discussion
EGU Biogeosciences Discuss., 4, 2525–2557, 2007
www.biogeosciences-discuss.net/4/2525/2007/ © Author(s) 2007. This work is licensed
under a Creative Commons License.
Biogeosciences Discussions
Biogeosciences Discussionsis the access reviewed discussion forum ofBiogeosciences
Ocean biogeochemistry exhibits
contrasting responses to a large scale
reduction in dust deposition
A. Tagliabue1, L. Bopp1, and O. Aumont2 1
Laboratoire des Sciences du Climat et de l’Environnement, IPSL-CNRS-CEA-UVSQ Orme des Merisiers, Bat 712, CEA/Saclay, 91198 Gif sur Yvette, France
2
Laboratoire d’Oc ´eanographie et Climatologie: Exp ´erimentation et Approches Num ´eriques, IRD/IPSL, Plouzan ´e, France
BGD
4, 2525–2557, 2007Impact of dust on ocean biogeochemistry
A. Tagliabue et al.
Title Page
Abstract Introduction
Conclusions References
Tables Figures
◭ ◮
◭ ◮
Back Close
Full Screen / Esc
Printer-friendly Version
Interactive Discussion
EGU
Abstract
Dust deposition of iron is thought to be an important control on ocean biogeochemistry
and air-sea CO2 exchange. In this study, we examine the impact of a large scale,
yet climatically realistic, reduction in the aeolian Fe input during a 240 year transient simulation. In contrast to previous studies, we find that the ocean biogeochemical
5
cycles of carbon and nitrogen are relatively insensitive to a 60% reduction in Fe input from dust. Net primary productivity (NPP) is reduced in the Fe limited regions, but the excess macronutrients that result are able to fuel additional NPP elsewhere. Overall,
NPP and air-sea CO2 exchange are only reduced by around 3% between 1860 and
2100. While the nitrogen cycle is perturbed more significantly (by∼15%), reduced N2
10
fixation is balanced by a concomitant decline in denitrification. Feedbacks between N2
fixation and denitrification are controlled by variability in surface utilization of inorganic nitrogen and subsurface oxygen consumption, as well as the direct influence of Fe on
N2fixation. Overall, there is relatively little impact of reduced aeolian Fe input (<4%) on
cumulative CO2fluxes over 240 years. The lower sensitivity of our model to changes in
15
dust input is primarily due to the more detailed representation of the continental shelf Fe, which was absent in previous models.
1 Introduction
The necessary nutrients for phytoplankton growth, including nitrogen (N), phosphorous (P), silica (Si), and iron (Fe), can be supplied to ocean surface waters via the aeolian
20
deposition of mineral aerosols (Duce et al., 1991). Of these, Fe has received particular interest, due to its potential to influence the cycle of carbon (C) in climatically signifi-cant regions of the worlds oceans (Jickells et al., 2005). Total dust inputs to the ocean
are on the order of 450 Tg yr−1 (Ginoux et al., 2001; Mahowald and Luo, 2003; Tegen
et al., 2004) and usually contain around 3.5% Fe, with a solubility that can be highly
25
BGD
4, 2525–2557, 2007Impact of dust on ocean biogeochemistry
A. Tagliabue et al.
Title Page
Abstract Introduction
Conclusions References
Tables Figures
◭ ◮
◭ ◮
Back Close
Full Screen / Esc
Printer-friendly Version
Interactive Discussion
EGU nutrient, low chlorophyll” (HNLC) ocean regions, such as the Southern Ocean (Boyd
et al., 2000), Equatorial Pacific (Coale et al., 1996) and Sub Arctic Pacific (Boyd et al., 2004) and elevated oceanic dust deposition to the Southern Ocean might drive
Glacial-Inter Glacial atmospheric CO2variability (Martin, 1990). Oceanic dust deposition has
likely declined from the pre industrial (PI) to the present day (Mahowald et al., 2006).
5
Prediction of future deposition are model dependent and will be controlled by land use
changes, as well as climate effects (Tegen et al., 2004; Mahowald et al., 2006;
Ma-howald, 20071). Processes that impact sources areas and dust loading, such as CO2
fertilization, have the potential to drive dramatic reductions in oceanic dust deposition over the coming century (Mahowald et al., 2006).
10
Variability in the atmospheric deposition of Fe can significantly impact C biogeo-chemistry. Phytoplankton require Fe for a variety of photosynthetic and respiratory enzymes (Falkowski et al., 1998; Raven, 1990) and changes in exogenous Fe supply will therefore directly impact net primary production (NPP) and the fixation of inorganic C. Moreover, the amount of Fe that is required to fix a given quantity of C is greater
un-15
der low irradiance (Sunda and Huntsman, 1997; Raven, 1990) and nitrate (NO3) based
growth (Raven, 1990), as well as for large phytoplankton functional groups (Timmer-mans et al., 2004). Accordingly, all HNLC mesoscale Fe addition experiments have
elicited increases in large diatoms, which can efficiently export fixed C to depth, and
are more efficient (per unit Fe added) in shallow mixed layers (De Baar et al., 2005;
20
Tagliabue and Arrigo, 2006). Atmospheric pCO2 might increase dramatically (via a
decline in both NPP and air to sea CO2 transfer) if the aeolian input of Fe were to
de-crease significantly over the coming decades (Moore et al., 2006; Parekh et al., 2006), although other studies show a much lower sensitivity (Bopp et al., 2003).
Aside from its direct impact on C fixation, the aeolian input of Fe can also influence
25
the biogeochemistry of N. Nitrogenase, the enzyme responsible for fixation of
dinitro-gen (N2) by phytoplankton, has a large Fe requirement (Rueter et al., 1992) and this
1
BGD
4, 2525–2557, 2007Impact of dust on ocean biogeochemistry
A. Tagliabue et al.
Title Page
Abstract Introduction
Conclusions References
Tables Figures
◭ ◮
◭ ◮
Back Close
Full Screen / Esc
Printer-friendly Version
Interactive Discussion
EGU has led to speculation that N fixation might be regulated by Fe and sensitive to
variabil-ity in aeolian inputs (Falkowski, 1997; Moore and Doney, 2007). As such, increased
N2 fixation can elevate surface dissolved inorganic N (DIN) concentrations, potentially
increasing overall NPP and the uptake of CO2from the atmosphere (Falkowski et al.,
1997; Michaels et al., 2001; Moore and Doney, 2007). That said, it is also important to
5
consider how changes in Fe deposition might impact processes that govern the losses
of DIN. During denitrification, bacteria utilize NO3 as an alternative electron acceptor
for remineralization under low oxygen conditions. N2 fixation and denitrification are
therefore coupled by their generation and consumption of DIN and analyses of both models and observations have suggested a balanced, or homeostatic, DIN inventory
10
(Redfield, 1934; Gruber and Sarmiento, 1997; Tyrrell, 1999; Gruber, 2004; Deutsch et al., 2007). Nevertheless, this concept remains controversial (see: Codispoti, 2007) and, with particular reference to dust, Fe has been proposed to be an agent that can unbalance the N cycle (Moore and Doney, 2007).
In this study we use the Pelagic Integration Scheme for Carbon and Ecosystem
15
studies (PISCES) global ocean-biogeochemistry model (Aumont and Bopp, 2006) to examine the response of ocean biogeochemistry to a reduction in aeolian Fe input dur-ing a transient simulation from 1860 to 2100. We use climatically realistic projections from Mahowald et al. (2006) (rather than arbitrary changes) to investigate the biogeo-chemical consequences of such an extreme change. Previously, models using either
20
simple ecosystem dynamics or performing short term simulations have shown a high sensitivity to changes in dust deposition (Dutkiewicz et al., 2005; Parekh et al., 2006; Moore et al., 2006). In contrast, we find that the biogeochemical cycles of C and N are actually relatively insensitive (globally) to a massive reduction in dust input
dur-ing a transient simulation from 1860 to 2100. While N2 fixation is more significantly
25
impacted by reduced dust inputs, it is also accompanied by a concomitant decline in denitrification, which stabilizes ocean DIN inventories. The disparity in model results is
discussed in terms of inter-model differences in the ocean Fe cycle and the timescales
BGD
4, 2525–2557, 2007Impact of dust on ocean biogeochemistry
A. Tagliabue et al.
Title Page
Abstract Introduction
Conclusions References
Tables Figures
◭ ◮
◭ ◮
Back Close
Full Screen / Esc
Printer-friendly Version
Interactive Discussion
EGU
2 Methods
2.1 The PISCES model
The PISCES ocean-biogeochemistry model is extensively described in Aumont and Bopp (2006) and includes two phytoplankton functional groups (nanophytoplankton and diatoms), meso- and micro-zooplankton, 2 detrital size classes for particulate
or-5
ganic carbon (POC), calcium carbonate, biogenic silica, DIC, biogenic Si, dissolved
organic C, NO3, phosphate (PO4), Silicic acid (Si(OH)4), ammonium (NH4), and Fe,
as well as carbon-13 for all carbon pools. Here we describe the parameterizations relevant for this study.
2.2 Net primary production, species composition and gas exchange
10
In order to calculate net primary productivity (NPP) we first calculate a maximum
phyto-plankton specific growth rate (µmax) for each phytoplankton functional type (PFT) that
is a function of temperature. µmax is then scaled by the product of the most limiting
nutrient (assuming Michaelis Menten kinetics) and the light (using the initial slope (α)
of the P-E relationship, including photoadaptation) limitation terms to produce the
real-15
ized growth rate (µ), and C fixation rate of each PFT. The half saturation constant for
growth (Kµ) is fixed for all nutrients except Fe, where it varies as a function of biomass
(taken as a proxy for cell size). The uptake of NO3 and PO4 that accompanies NPP
is calculated assuming fixed Redfield ratios (C/N=122/16 and C/P=122/1). On the
other hand, the Fe/C ratio increases as light declines and decreases with Fe stress,
20
while Si/C decreases as light increases and also permits lighter silicification if Si(OH)4
concentrations decline.
Each PFT has certain specific physiological characteristics that will govern their re-sponse to our imposed changes in aeolian Fe deposition. Diatoms are assumed to
have a requirement for Si(OH)4 (no such requirement for nanophytoplankton) and a
25
BGD
4, 2525–2557, 2007Impact of dust on ocean biogeochemistry
A. Tagliabue et al.
Title Page
Abstract Introduction
Conclusions References
Tables Figures
◭ ◮
◭ ◮
Back Close
Full Screen / Esc
Printer-friendly Version
Interactive Discussion
EGU
Diatoms also have a greater maximum and minimum C-specific Fe demand and KµFe
than nanophytoplankton. Finally, nanophytoplankton support a more regenerative food web, producing small particles and being preferentially grazed by microzooplankton. In contrast, mesozooplankton have a preference for diatoms and microzooplankton
graz-ing of diatoms is zero when their biomass is greater than 0.5µmol C l−1. Diatoms also
5
produce large, rapidly sinking particles.
The air-sea exchange of CO2(aq)follows the OCMIP protocols and is a function of the
air-sea pCO2 gradient, temperature, ice-cover, and the piston velocity. We represent
the wind speed dependence of the piston velocity via a quadratic function of the wind speed at 10 m (Wanninkhof, 1992).
10
The Fe cycle is represented in a relatively simple fashion and dissolved Fe is as-sumed to be made up of free inorganic and organically complexed Fe, both of which are bioavailable. The concentration of organically complexed Fe is computed using a chemical equilibrium constant and a fixed ligand concentration of 0.6 nM. The impact of abiotic Fe chemistry (e.g., Tagliabue and Arrigo, 2006) on Fe speciation is not
in-15
cluded. Free inorganic Fe can be converted to particulate species by scavenging onto particles. Atmospheric deposition of Fe assumes that Fe is 3.5% of dust, with a solu-bility of 0.5% and includes subsurface dissolution of dust particles. Additional sources of Fe are sediment resuspension, which includes a representation of continental shelf supply that is usually ignored by global models (Aumont and Bopp, 2006), as well as
20
riverine supply (hydrothermal sources are not represented in PISCES).
2.3 Nitrogen cycling in PISCES
The uptake of DIN by phytoplankton and subsequent remineralization of organic matter
to DIN is described in Aumont and Bopp (2006), here we concentrate on describing N2
fixation and denitrification.
25
Marine N2fixation is carried out by numerous planktonic organisms, including the oft
mentioned Trichodesmium sp., as well as a variety of unicellular diazotrophes,
BGD
4, 2525–2557, 2007Impact of dust on ocean biogeochemistry
A. Tagliabue et al.
Title Page
Abstract Introduction
Conclusions References
Tables Figures
◭ ◮
◭ ◮
Back Close
Full Screen / Esc
Printer-friendly Version
Interactive Discussion
EGU Given this taxonomic diversity and the associated physiological variability, we decided
not to prognostically simulate a N2fixing plankton functional type (PFT) within PISCES.
Instead, we chose to include N2 fixation as a process that produces NH4 under
cer-tain conditions (Aumont and Bopp, 2006). Specifically, N2 fixation is a function of the
growth rate of the nanophytoplankton function group and only occurs in surface waters
5
that have a temperature warmer than, or equal to, 20◦C. This maximum potential rate
of N2 fixation is then scaled by the limitation term for Fe and one minus the limitation
term for DIN (NO3and NH4). Therefore, the realized rate of N2fixation increases with
decreasing DIN and declines as Fe becomes more limiting.
Denitrification occurs in suboxic waters and results in NO3 instead of O2 being
con-10
sumed during the remineralization of organic matter. In PISCES, we restrict
denitrifica-tion to waters whose O2concentration is below 8µM (Lipshultz et al. 2000) and set the
N/C stiochiometric ratio for denitrification to be 0.8 mol : mol (Middelburg et al., 1996;
Soetaert et al., 2000). Finally, we also include the bacterial conversion of NH4to NO3
via nitrification, which occurs in oxic waters and is inhibited by light.
15
Despite our relatively simple parameterization scheme, denitrification and N2fixation
are implicitly coupled in PISCES. Although we do not include a diazotrophic PFT in
PISCES, we do include the main role of N2 fixation in supplying NH4 under certain
conditions. The absence of an explicit PFT might be important if diazotrophes are
significantly different in their sinking and remineralization characteristics, or food web
20
structure; all of which are currently difficult to generalize for use in a global model.
Variability in denitrification will alter DIN concentrations which will, in turn, impact the
rate of N2 fixation. While on the other hand, changes in export production (mediated
by N2fixation and/or Fe and other nutrients) will modify subsurface O2concentrations
and thus denitrification rates. This approach also allows the long spin up and simulation
25
BGD
4, 2525–2557, 2007Impact of dust on ocean biogeochemistry
A. Tagliabue et al.
Title Page
Abstract Introduction
Conclusions References
Tables Figures
◭ ◮
◭ ◮
Back Close
Full Screen / Esc
Printer-friendly Version
Interactive Discussion
EGU
2.4 Physical model
The physical model coupled to PISCES is based on the ORCA2 global configuration of OPA version 8.2 (Madec et al., 1998), including a dynamic-thermodynamic sea ice model (Timmermann et al., 2003). The mean horizontal resolution is approximately
2◦ by 2◦ cos latitude and the meridional resolution is enhanced to 0.5◦ at the
equa-5
tor. The model has 30 vertical levels, with an increment that increases from 10 m at the surface to 500 m at depth (12 levels are located in the first 125 m). Our stan-dard physical model employs climatological atmospheric forcing from various datasets. These include NCEP/NCAR 2 m atmospheric temperature (averaged between 1948 and 2003) and relative humidity, ISCCP total cloudiness (averaged between 1983 and
10
2001), CMAP precipitation (averaged between 1979 and 2001), weekly wind stress based on ERS and TAO observations and creates a representation of ocean circula-tion/mixing that is constrained by observations. Please see Aumont and Bopp (2006) for more details and the associated references.
2.5 Experimental design
15
After spinning up the model for over 3000 years under preindustrial conditions, we ran PISCES for a 240 year period from 1860 to 2100 with a specified atmospheric
pCO2that is constrained by observations between 1860 and 2000 (Keeling et al., 2001)
and the A2 scenario from 2000 to 2100 (Nakicenovic and Swart, 2000). A recent study by Mahowald et al. (2006) used the National Center for Atmospheric Research’s
20
Community Climate System Model (NCAR-CCSM) to investigate the change in mineral aerosols in response to climate and predict pre industrial, current, and future dust sources, as well as oceanic deposition. We linearly interpolated the aeolian Fe supply to the ocean between the pre industrial (1860), current (taken to be 2000) and doubled
CO2 (taken as 2100) fields of Mahowald et al. (2006), and assume Fe to be 3.5% of
25
dust, with a solubility of 0.5%. We also ran a control experiment from 1860 to 2100 that
BGD
4, 2525–2557, 2007Impact of dust on ocean biogeochemistry
A. Tagliabue et al.
Title Page
Abstract Introduction
Conclusions References
Tables Figures
◭ ◮
◭ ◮
Back Close
Full Screen / Esc
Printer-friendly Version
Interactive Discussion
EGU PI dust deposition. Finally, we use the year 2000 as a reference, as it represents
‘modern’ dust deposition.
3 Results and discussion
3.1 Changes in aeolian Fe input in 2100
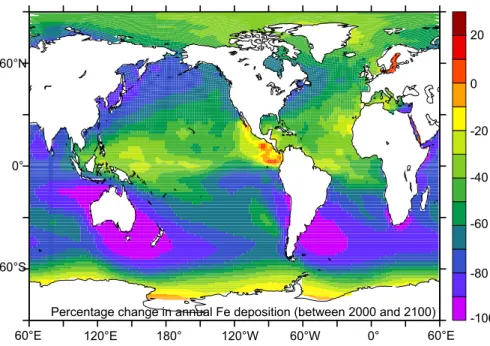
The predicted reduction in aeolian Fe input in 2100 (relative to 2000) is spatially
het-5
erogenous and results from changes in sources area and dust loading (see: Mahowald et al., 2006). The largest percentage reductions in aeolian Fe input are found through-out the sub-Antarctic Sthrough-outhern Ocean, specifically to the sthrough-outh of Australia, Patagonia and, to a lesser degree, South Africa (Fig. 1). In the remaining HNLC regions (the sub-Arctic and Equatorial Pacific) there are slightly lesser, but still significant, reductions in
10
Fe deposition (Fig. 1). It is noteworthy that the locations where a proportionally high reduction in dust is predicted are all HNLC regions of relatively high NPP. Aside from that, there are also large absolute reductions in Fe deposition in the Northern Sub-tropical Atlantic Ocean (Fig. 1). The decline in dust deposition is due to the predicted decline in future dust loading that results from climate induced changes in
vegeta-15
tion, as well as CO2 fertilization (Mahowald et al., 2006; Mahowald, 2007
1
) and can therefore be thought to be climatically realistic (rather than arbitrary changes in model forcings). Between the pre-industrial and modern periods; the decline is dust deposi-tion is controlled by changes in source area, mostly at southerly latitudes (Mahowald et al., 2006). Quantitatively, this represents a reduction in total aeolian Fe deposition
20
to ocean surface waters of 38% and 60% by 2000 and 2100, respectively (relative to 1860).
3.2 Impact on NPP
Despite an overall reduction of 60% in aeolian Fe input, we find little impact upon global NPP by 2100. At the beginning of our experiments (1860), annual NPP is
BGD
4, 2525–2557, 2007Impact of dust on ocean biogeochemistry
A. Tagliabue et al.
Title Page
Abstract Introduction
Conclusions References
Tables Figures
◭ ◮
◭ ◮
Back Close
Full Screen / Esc
Printer-friendly Version
Interactive Discussion
EGU
35.8 Pg C yr−1and declines to 35.3 and 34.6 Pg C yr−1by 2000 and 2100, respectively
(Table 1). This represents a decline of only 3.3% (1.2 Pg C) or 1.8% (0.7 Pg C) between 1860 and 2100 or 2000 and 2100, respectively (Table 1). As expected, NPP is reduced in the HNLC regions that are impacted by the reduced aeolian Fe input, such as the
Atlantic sector of the Southern Ocean (ATL-SO, by 15 to 30 gC m−2), the Sub Arctic
Pa-5
cific (SAPac, by 5 to 15 gC m−2) and the Equatorial Pacific (EqPac, by 5 to 30 gC m−2)
(Fig. 1, Fig. 2a, Fig. 3a, between 2000 and 2100). Nevertheless, the overall reductions in NPP are only slight (especially in the Sub Arctic Pacific and the Antarctic sector of the Southern Ocean) and suggest that aeolian Fe input is only important in regions directly adjacent to dust sources. This is probably because the continental shelf is the
10
principal source of Fe to the mixed layer in the large majority of HNLC waters (Tyrrell
et al., 2005; Blain et al., 2007; Aumont et al., 20072).
The spatial re-organization in NPP that follows the reduction in aeolian Fe input is responsible for the small change in global NPP that results. The decline in ATL-SO
NPP (Fig. 3a) reduces the utilization of macronutrients (such as NO3) and an excess
15
therefore remains in surface waters (up to 2µM between 2000 and 2100, Fig. 4a).
These excess nutrients are now able to enter mode waters (especially in the ATL-SO, Fig. 4d) and fuel additional NPP in the macronutrient limited low latitudes (Fig. 3a) (Aumont et al., 2003; Sarmiento et al., 2004a; Aumont and Bopp, 2006). A similar mechanism also occurs in the EqPac, where the decline in eastern tropical Pacific
20
(ETP) NPP and NO3 utilization is balanced by elevated NPP in the western tropical
Pacific (WTP) (Fig. 3a) as the unused upwelled nutrients flow westward (Dutkiewicz et al., 2005). This highlights the dynamic nature of the global ocean system, whereby changes in local nutrient utilization can have far field ramifications (Sarmiento et al.,
2004a; Dutkiewicz et al., 2005). Overall, the net effect of this re-organization of NPP is
25
BGD
4, 2525–2557, 2007Impact of dust on ocean biogeochemistry
A. Tagliabue et al.
Title Page
Abstract Introduction
Conclusions References
Tables Figures
◭ ◮
◭ ◮
Back Close
Full Screen / Esc
Printer-friendly Version
Interactive Discussion
EGU
3.3 Species composition and nutrients
Despite a small effect on global NPP, reduced aeolian Fe input does cause a decline
in diatom abundance in high latitude HNLC waters. In the Southern Ocean, for exam-ple, lower aeolian Fe inputs reduce the competitive advantage of diatoms and drive a floristic shift to the smaller nanophytoplankton functional group (by as much as 30%,
5
Fig. 4d). This is due to the higher affinity for dissolved Fe that is associated with
nanophytoplankton, relative to diatoms (Aumont and Bopp, 2006). Overall, diatom Fe limitation increases by between 10 and over 60% between 2000 and 2100, compared to around 5 to 25% for the nanophytoplankton PFT. As a consequence, the abundance of diatom grazing mesozooplankton also declines, resulting in a more regenerative
ma-10
rine food web. Overall, the Fe-mediated shift in food web structure results in a larger relative decline in C export, relative to NPP, by 2100 (–5.1 and –3.3% for carbon export and NPP, respectively, Table 1).
Only the concentrations of non-limiting nutrients will change greatly by 2100. As
mentioned previously, NO3 concentrations increase in the Fe-limited HNLC regions
15
where aeolian Fe input declines (Fig. 1, Fig. 4a). While high residual NO3
concentra-tions unsurprisingly persist in the Southern Ocean, EqPac, and SAPac, we also predict
excess NO3in North Atlantic under low aeolian Fe deposition conditions (Fig. 4a). This
would suggest a switch from a predominantly N limited system to one limited by Fe, thus highlighting the potential importance of atmospheric supply as a source of Fe to
20
this particular region. In the N-STP and tropical Atlantic, N remains the limiting
nu-trient and prevents any accumulation of residual NO3 (Fig. 4a) despite the increased
transport of NO3from adjacent regions of reduced NPP (Fig. 3a). Similarly, it is only in
regions that are not Fe limited that we see any change in Fe concentrations by 2100 (Fig. 4b). Although there is less Fe being delivered to the Southern Ocean and the
25
BGD
4, 2525–2557, 2007Impact of dust on ocean biogeochemistry
A. Tagliabue et al.
Title Page
Abstract Introduction
Conclusions References
Tables Figures
◭ ◮
◭ ◮
Back Close
Full Screen / Esc
Printer-friendly Version
Interactive Discussion
EGU Ocean; regions of particularly high atmospheric deposition rates (Jickells et al., 2005;
Mahowald et al., 2006).
The diagnostic tracer Si* ((Si(OH)4)-(NO3)) was originally proposed by Sarmiento et
al. (2004a) and declines with increasing Fe stress, due to the elevated Si/N uptake ratios of Fe limited diatoms (e.g., Takeda, 1998). However, we find that although Fe
5
stress does increase in 2100 (see above), the replacement of diatoms by
nanophy-toplankton (which have no Si(OH)4 requirement) actually increases Si* (not shown).
Therefore, Fe-mediated changes in phytoplankton species composition, with particu-lar regard to any taxon-specific Si requirements, should be considered when
evaluat-ing spatio-temporal changes in Si*. For example, the exhaustion of Si(OH)4 at more
10
southerly latitudes than NO3in the Southern Ocean (causing negative Si*) (Franck et
al., 2000; Sarmiento et al., 2004a), might arise from local aeolian inputs of Fe, or the advection of high-Fe subsurface waters from the Patagonian shelf. Greater Fe supply would allow diatoms to make up a greater proportion of phytoplankton biomass near
dust deposition sites, therefore increasing Si(OH)4 uptake and reducing Si* (i.e. the
15
inverse of our results).
3.4 Nitrogen biogeochemistry
3.4.1 Integrated rates and spatial distributions
Annual global N2 fixation is 75 Tg N yr−1 (in 2000, Table 1), which is towards the lower
end of the estimate of 120±50 Tg N yr−1 proposed by Gruber (2004) in a recent
syn-20
thesis. Regarding specific ocean basins, Mahaffey et al. (2005) compiled estimates
of Atlantic N2 fixation that are between 15 and 77 Tg N yr−
1
, while Pacific N2 fixation
rates were 21 to 59 Tg N yr−1(Mahaffey et al., 2005 and references therein). We find
area-integrated rates are 24.2 and 31.3 Tg N yr−1for the Atlantic and Pacific Oceans,
respectively during this study (in 2000, Table 2). More recently, a model-based study
25
(Deutsch et al., 2007) concluded that N2 fixation rates in the Pacific may be as much
fix-BGD
4, 2525–2557, 2007Impact of dust on ocean biogeochemistry
A. Tagliabue et al.
Title Page
Abstract Introduction
Conclusions References
Tables Figures
◭ ◮
◭ ◮
Back Close
Full Screen / Esc
Printer-friendly Version
Interactive Discussion
EGU
ation rates (137 Tg N yr−1). In our model, N2fixation is of roughly the same order in the
Atlantic and the Pacific and is distributed throughout the tropical oceans, apart from the
high NO3EqPac (Fig. 2c). This is a region where Deutsch et al. (2007) predict very high
rates of N2fixation (greater than 200 mmol N m−
2
yr−1), despite high concentrations of
DIN, and may go someway towards explaining the disparity between our estimates.
5
In the Indian Ocean we obtain 20 Tg N yr−1 of N2 fixation, but while both geochemical
evidence (Gruber and Sarmiento, 1997) and the few measurements available (Capone
et al., 1997) would support high rates of N2fixation, no basin scale estimate exists.
Global denitrification is 36.1 Tg of N yr−1 (in 2000, Table 1) and is dominated by
the ETP region (Table 2, Fig. 2d). This is somewhat below the 65±20 Tg N yr−1
pro-10
posed by Gruber (2004) for pelagic denitrification and well beneath estimates of up
to 150 Tg N yr−1 (Codispoti et al., 2001). Unfortunately, while we are able to capture
the major features of ETP denitrification (Fig. 2d, Table 2), we evidently underestimate Indian Ocean denitrification severely (Table 2). As a result of the high rates of Antarctic bottom water formation near the Antarctic shelf, as well as the relatively high resolution
15
simulations that are needed to accurately capture the complex physics, Indian Ocean deep waters contain too much oxygen in PISCES. Therefore, denitrification rates are retarded in a region that has been estimated to consume over 20 Tg N per year (How-ell et al., 1997), a factor of 5 greater than we find (Table 2). In addition, our model also does not include any sedimentary denitrification, which can be between 180 and
20
300 Tg N yr−1(Codispoti et al., 2001; Gruber, 2004).
Overall, our value for global annual pelagic N2 fixation of 75.7 Tg N (for 2000,
Ta-ble 1) is very similar (also in terms of spatial distributions, Fig. 2a) to estimates of 58
to 75 Tg N yr−1 that are produced by models that contain a prognostic N2 fixing PFT
(Moore et al., 2006; Moore and Doney, 2007) and well within the geochemistry-based
25
range of 120±50 Tg N yr−1 (Gruber, 2004). As regards denitrification, our model
re-sults are low relative to those produced by Moore and Doney (2007) (65 Tg N yr−1),
but within the range of 45 to 85 Tg N yr−1 proposed by Gruber (2004) (especially
BGD
4, 2525–2557, 2007Impact of dust on ocean biogeochemistry
A. Tagliabue et al.
Title Page
Abstract Introduction
Conclusions References
Tables Figures
◭ ◮
◭ ◮
Back Close
Full Screen / Esc
Printer-friendly Version
Interactive Discussion
EGU
results with the high end estimates of water column denitrification of up to 150 Tg N yr−1
(Codispoti et al., 2001; Galloway et al., 2004) remains a challenge for global ocean-biogeochemistry models.
3.4.2 Changes in N2fixation with dust
N2fixation responds much more dramatically to changes in aeolian Fe deposition than
5
NPP. Globally, N2 fixation declines by 17% (or 14 Tg N) to approximately 67 Tg N yr−
1
by the end of our 240 year simulation (in 2100, Table 1). The majority of this reduction
is due to changes in the Pacific Ocean basin, wherein N2 fixation declines by almost
25% (Table 2). In contrast, N2fixation declined by slightly more than 10% in the Atlantic
and Indian Oceans. Overall, changes in aeolian Fe input have a far greater impact on
10
N2fixation (by as much as 25%) than NPP or C export (3 to 5%, Table 1).
N2 fixation reacts both directly and indirectly to the reduced aeolian Fe inputs.
The largest absolute decline in N2 fixation occurs in the southern subtropical Atlantic
(Fig. 3c) and is a result of both reduced aeolian input of Fe (Fig. 1), as well as
addi-tional NO3 that results from the Fe-mediated decline in ATL-SO NPP (Figs. 3a, 4a).
15
Moreover, the large area of reduced absolute N2fixation in the N-STP gyre (Fig. 3c) is
also a consequence of both the additional NO3 that is transported from the region of
reduced NPP in the EqPac (Figs. 3a, 4a), as well as reduced Fe input (Fig. 1). Indeed,
N2 fixation in the N-STP gyre will be highly sensitive to any Fe-mediated changes in
DIN utilization in the directly adjacent HNLC regions such as the EqPac and SAPac
20
(Figs. 3a and 4a), as well as local changes in Fe inputs.
Moore et al. (2006) suggest that annual N2fixation would decline by almost 40 Tg N
under an identical reduction in dust, far greater than our reduction of<10 Tg N (Table 1).
This is because Moore et al. (2006) conducted 40 year simulations using the future dust deposition field, wherein the impact of the reduced dust input will be exaggerated,
25
relative to our incremental decline in dust deposition from 1860 to 2100. Indeed, the
BGD
4, 2525–2557, 2007Impact of dust on ocean biogeochemistry
A. Tagliabue et al.
Title Page
Abstract Introduction
Conclusions References
Tables Figures
◭ ◮
◭ ◮
Back Close
Full Screen / Esc
Printer-friendly Version
Interactive Discussion
EGU al. (2006) is more in line with our results.
3.4.3 Changes in denitrification with dust
Denitrification also exhibits a strong response to the reduced atmospheric Fe inputs simulated in this study. This is due to the Fe mediated changes in C export, which
modify the amount of O2 consumed during remineralization and consequentially, the
5
amount of denitrification that occurs. In the Pacific Ocean, the reduction in ETP NPP
(Fig. 3a), results in greater subsurface O2 concentrations and denitrification declines
accordingly (by 24%, Table 2). On the other hand, the increase in low latitude NPP is re-sponsible for the very slight absolute increase in Atlantic Ocean denitrification (Figs. 3a
and d, Table 2). The decline in ETP denitrification results in additional subsurface NO3
10
(Fig. 4d), which will eventually enter surface waters and will reduce the area over which
N2 fixation is selected for. While N2 fixation can be directly controlled by the degree
of Fe limitation, denitrification responds to the change in export production (and thus
O2 consumption) that results from the impact of Fe (or any other resource) on NPP
(processes “I”, “J”, “K”, and “F” in Fig. 5).
15
3.4.4 The interplay between N2fixation and denitrification
At the beginning of our experiments the imbalance between pelagic N2 fixation and
denitrification amounts to excess of 42.3 Tg N. As mentioned previously, this most likely results from our underestimation of Indian Ocean denitrification and the absence of any benthic DIN consumption. For comparison, the recent synthesis of Gruber (2004)
in-20
cludes an imbalance of 65 Tg N between N2fixation and denitrification. Over the course
of our experiment, the degree of imbalance declines by around 9 Tg N (to 33.4 Tg N,
Table 1) and results from the rapid response of N2fixation to the surface water
conse-quences of the reduction in aeolian Fe input (on both Fe and DIN concentrations).
Denitrification remains a relatively constant fraction of N2 fixation by the end of our
25
BGD
4, 2525–2557, 2007Impact of dust on ocean biogeochemistry
A. Tagliabue et al.
Title Page
Abstract Introduction
Conclusions References
Tables Figures
◭ ◮
◭ ◮
Back Close
Full Screen / Esc
Printer-friendly Version
Interactive Discussion
EGU
is especially so in the Pacific Ocean, where N2 fixation and denitrification are tightly
coupled over the duration of our experiment (240 years, Table 2). This is probably due
to the geographic proximity of regions of N2 fixation and denitrification in the Pacific,
as well as the increased deep-water ventilation over ETP denitrification sites (Deutsch et al., 2007). In contrast, Moore and Doney (2007) used an alternative experimental
5
design (varying nitrogen cycle parameters) to suggest N2 fixation and denitrification
feedbacks were ‘muted’ in the Pacific Ocean. For example, simulated changes in N2
fixation yielded a lesser change in denitrification (and vice-versa) than was seen in other ocean basins (Moore and Doney, 2007). In our study, the high rates of denitrifica-tion in the ETP are mostly supported by the high rates of NPP (e.g., Fig. 2a), and thus
10
C export, that arise from the local upwelling of nutrients. We find that denitrification
reacts to the impact of Fe on ETP NPP, rather than N2 fixation, and that N2 fixation
responds to changes in DIN utilization in the ETP, as well as to Fe.
The impact of N2 fixation and denitrification on DIN concentrations are segregated
with respect to depth (Fig. 5). Denitrification responds to the subsurface consequences
15
of the reduction in aeolian Fe input on C export and O2 consumption (processes “K”
and “F” in Fig. 5), by either stimulating N2 fixation or NPP (processes ‘B’ and ‘I’ in
Fig. 5). Therefore, the degree of deep-water ventilation will control the efficiency with
which denitrification can negatively feedback onto N2 fixation (via DIN concentrations,
processes “G”, “L”, and “C” in Fig. 5). Reduced ventilation will also reduce vertical
nu-20
trient supply (process “L” in Fig. 5), as well as reducing subsurface O2concentrations,
which may further reduce vertical DIN supply (via greater consumption during denitrifi-cation (processes “F” and “G” in Fig. 5). Nevertheless, any decline in vertical nutrient
supply would reduce surface NPP, C export and subsurface O2consumption, thereby
resulting in reduced denitrification (Fig. 5). Overall, the inter play between Fe fuelled
25
NPP and N2fixation and the subsequent impact on DIN, C export, as well as
BGD
4, 2525–2557, 2007Impact of dust on ocean biogeochemistry
A. Tagliabue et al.
Title Page
Abstract Introduction
Conclusions References
Tables Figures
◭ ◮
◭ ◮
Back Close
Full Screen / Esc
Printer-friendly Version
Interactive Discussion
EGU pools represented in Fig. 5, as well the degree of ocean ventilation, would greatly assist
future investigations.
Overall, our results suggest that it is unlikely that Fe can significantly unbalance the oceanic N cycle (Moore and Doney, 2007), especially over long timescales. While
the decline in aeolian Fe deposition does reduce N2 fixation, it is accompanied by an
5
oxygen mediated decline in the amount of denitrification (Tables 1 and 2). Moreover,
besides the direct requirement of N2fixation for Fe, it is also important to consider that
Fe will influence the amount of NPP, and thus DIN utilization, that occurs in the HNLC regions (Figs. 4a and 5). In this sense, anything that changes the degree of EqPac DIN
utilization (not only Fe) has the potential to feedback onto both surface N2fixation and
10
subsurface denitrification (processes “D” and “H”, as well as “D”, “J”, “K”, “F” and “G” in Fig. 5). This suggests that the ocean DIN inventory would be relatively insensitive to any increases in aeolian Fe input that may have occurred during the geologic past (e.g., during the last glaciation, LGM). That said, if increased dust deposition was also accompanied by a decline in ETP ocean ventilation (i.e. altering the strength of
pro-15
cesses ‘L’ in Fig. 5), then the efficiency of the denitrification-N2 fixation feedback can
potentially become more complex (see above).
3.5 Air-sea CO2exchange
Ocean uptake of atmospheric CO2(FCO2) is 1.9 Pg C yr-1 in 2000 (Table 1, Fig. 2b)
and compares well with current estimates of approximately 2 Pg C yr-1 (Le Qu ´er ´e et
20
al., 2003). The 38% decline in dust deposition between the PI period and present day
reduces FCO2 by 5.5% (or 0.1 Pg C), relative to the impact of the 80µatm rise in
at-mospheric pCO2 (Table 1). However, by 2100 the 470µatm increase in atmospheric
pCO2is predominantly responsible for the change in the global ocean C sink (to 6.2 Pg
C yr−1) and dust decreases ocean uptake by only 3.4% (or 0.22 Pg C, Table 1).
Cu-25
BGD
4, 2525–2557, 2007Impact of dust on ocean biogeochemistry
A. Tagliabue et al.
Title Page
Abstract Introduction
Conclusions References
Tables Figures
◭ ◮
◭ ◮
Back Close
Full Screen / Esc
Printer-friendly Version
Interactive Discussion
EGU As seen for NPP, the change in dust deposition results in a spatial reorganization in
FCO2 (Fig. 3b). The degree of uptake of atmospheric CO2in the ATL-SO (Fig. 2b) is
retarded and shifted to lower latitudes (Fig. 3b). Since higher temperatures and lower wind speeds characterize the tropical south Atlantic, gas exchange is reduced and
FCO2 declines more than NPP (–5.5% and –1.5% for FCO2 and NPP, respectively,
5
between the PI and present, Table 1). This disparity is all but eliminated by 2100,
by which time the rise in atmospheric pCO2 is the principal control on FCO2 and the
reduction in FCO2is only 0.1% greater than for NPP (Table 1). The decrease in EqPac
FCO2 by 2100 is due to an increase in the degree of outgassing (as NPP declines,
Fig. 3a) and is partly balanced by increased ocean uptake in the WTP (Figs. 2b and
10
3b).
Recent studies have suggested a large reduction in the air-sea CO2 flux (Moore et
al., 2006) and a dramatic increase in atmospheric pCO2concentrations (Parekh et al.,
2006) might result from a marked decline in oceanic dust deposition. In contrast, our
results indicate that the impact of a massive decline in dust on air-sea CO2 fluxes is
15
much lower and is, at most, on the order of 3 to 5% (Table 1). Moore et al. (2006) found
that the ocean uptake of CO2 declined by 0.5 Pg C yr−1 under a future dust scenario,
but kept atmospheric pCO2 at PI levels (∼280µatm). Given that atmospheric pCO2is
projected to increase by as much as 470µatm by 2100, it is difficult to compare to the
results of our study, which includes the observed and predicted change in atmospheric
20
pCO2between 1860 and 2100 (see Methods). Although we did not compute the impact
of ocean CO2fluxes on atmospheric pCO2(instead this was used as a model forcing),
it is clear that the impact of the reduced dust deposition will be far lower than the
increase of up to 180µatm from Parekh et al. (2006) and would be closer to that of
3µatm from Bopp et al. (2003). In a more recent study, phytoplankton biomass in
25
PISCES was found to be highly insensitive to variability in atmospheric deposition of
Fe (Aumont et al., 20072), mostly because of the explicit representation (Aumont and
2
BGD
4, 2525–2557, 2007Impact of dust on ocean biogeochemistry
A. Tagliabue et al.
Title Page
Abstract Introduction
Conclusions References
Tables Figures
◭ ◮
◭ ◮
Back Close
Full Screen / Esc
Printer-friendly Version
Interactive Discussion
EGU Bopp, 2006) of the high Fe flux that arises from continental shelves (Elrod et al., 2004;
Tyrrell et al., 2005; Lam et al., 2006; Blain et al., 2007). Coarse resolution ocean-biogeochemistry models are often unable to represent the continental shelves and the absence of any sediment Fe source (Dutkiewicz et al., 2005; Parekh et al., 2006) will obviously increase the sensitivity of such models to any changes in aeolian input.
5
4 Perspectives
Our study only addresses the impacts of a change in dust deposition and atmospheric
pCO2 on ocean biogeochemistry. In reality, it is highly likely that changes in ocean
circulation, such as increased surface stratification (e.g., Sarmiento et al., 2004b), will accompany any possible change in dust deposition. Greater stratification will impact
10
the vertical supply of nutrients to surface waters, which might hamper the growth of large PFTs, such as diatoms (Bopp et al., 2005). Changing the degree of ocean
ven-tilation also has the potential to change subsurface O2 concentrations, which would
impact denitrification rates. Moreover, reduced ventilation might also reduce the
ef-ficiency of the denitrification – N2 fixation negative feedback (process “L” in Fig. 5),
15
especially in the ETP. To that end, longer simulations would be required to adequately address the impact of changes in deep nutrient inventories (driven by export production and denitrification) on surface biogeochemistry.
Recent research has demonstrated an enhancement of N2 fixation rates under
higher CO2 concentrations (Hutchins et al., 2007; Barcelos e Ramos et al., 2007),
20
which might offset any dust-mediated decline in N2 fixation. As an initial calculation,
we use our modeled spatial increase in CO2(aq) between 2000 and 2100, alongside
a Michaelis-Menten fit to the proportional increase in N2 fixation per unit change in
pCO2from Hutchins et al. (2007), to suggest that global N2fixation could be enhanced
by 22 Tg N (or 30%) by 2100 (relative to 2000); more than compensating for the
dust-25
mediated decline of 8 Tg N (Table 1). However, this upper bound estimate assumes
BGD
4, 2525–2557, 2007Impact of dust on ocean biogeochemistry
A. Tagliabue et al.
Title Page
Abstract Introduction
Conclusions References
Tables Figures
◭ ◮
◭ ◮
Back Close
Full Screen / Esc
Printer-friendly Version
Interactive Discussion
EGU
that N2 fixation will simply increase with CO2(aq), while in reality, concentrations of
DIN, Fe, and PO4also exert a strong control. Therefore, any CO2enhancement would
be unlikely to realize the complete 22 Tg N (or 30%) by 2100. Nevertheless, the CO2
effect on N2 fixation merits further investigation, especially as anthropogenic CO2 is
accumulating in the poorly ventilated subtropical gyres (Sabine et al., 2004) that are
5
frequented by N2fixing phytoplankton (e.g., Mahaffey et al., 2005).
The sensitivity of individual global ocean biogeochemistry models to changes in ae-olian iron input will be dependent on the model specific importance of atmospheric de-position, relative to other sources of Fe. The significance of aeolian Fe inputs to global ocean biogeochemistry depends on whether a given model also represents continental
10
shelf inputs of Fe (low sensitivity to dust), or relies solely on dust as an external source (high sensitivity to dust). Although current global models do not address the observed spatial variability in the solubility of dust-bound Fe, including (or increasing the impor-tance of) the continental shelf Fe inputs does permit a more accurate representation of the elevated phytoplankton biomass and Fe concentrations typical of these regions
15
(Aumont and Bopp, 2006). Notwithstanding, observational estimates of sedimentary Fe fluxes, as well as their geographic variability and the bioavailability of the Fe sup-plied, remain sparse (but see: Elrod et al., 2004; Lam et al., 2006, Blain et al., 2007) and require further investigation.
5 Conclusions
20
Despite enforcing a climatically realistic dramatic reduction in the ocean deposition of
aerosol Fe, we find that global NPP and FCO2 only decline by 3–5%. This is due to
the spatial redistribution of NPP that accompanies a decline in aeolian Fe input, as well as the lesser importance of aeolian Fe sources relative to continental shelf supply in PISCES. Locally, dust deposition does have a role in sustaining diatom biomass in
25
the ATL-SO and could therefore be important in controlling the relative utilization of
BGD
4, 2525–2557, 2007Impact of dust on ocean biogeochemistry
A. Tagliabue et al.
Title Page
Abstract Introduction
Conclusions References
Tables Figures
◭ ◮
◭ ◮
Back Close
Full Screen / Esc
Printer-friendly Version
Interactive Discussion
EGU in response to both the reduction in Fe supply, as well as the increased DIN
concen-trations that result from reduced nutrient utilization in dust impacted HNLC regions. Nevertheless, concomitant declines in denitrification stabilize the ocean DIN inventory
(especially in the Pacific Ocean) and the excess NO3 that arises from reduced
bacte-rial consumption can act as a negative feedback on N2 fixation. The denitrification –
5
N2 fixation feedback is controlled by changes in nutrients and NPP, and its efficiency
depends on the degree and timescales of deep-water ventilation above denitrification
sites (summarized in Fig. 5). The change in air-sea CO2exchange between 1860 and
2100 is predominantly controlled by the change in atmospheric pCO2and the decline
in dust deposition reduces cumulative uptake (over the 240 year study period) by only
10
22.8 Pg C, or 4%. The impact of future changes in dust deposition, as well as other changes in climate, on ocean biogeochemical cycles should utilize a variety of global ocean biogeochemical models in order to minimize model-specific conclusions.
Acknowledgements. We thank N. Mahowald (NCAR) for providing us with the dust deposition fields. This manuscript also benefited from insightful discussions with S. Dutkiewicz (MIT)
15
and B. Schneider (LSCE). Funding was provided by ANR/GOBAC and all simulations were performed at the French National computing center IDRIS.
References
Aumont, O., Max-Reimer, E., Blain, S., and Monfray, P.: An ecosystem model of the global ocean including Fe, Si, P co-limitations, Global Biogeochem. Cycles, 17, 1060,
20
doi:10.1029/2001GB001745, 2003.
Aumont, O. and Bopp, L.: Globalizing results from ocean in situ iron fertilization studies, Global Biogeochem. Cycles, 20, GB2017, doi:10.1029/2005GB002591, 2006.
Baar, H. J. W. de, Boyd, P. W., Coale, K. H., et al.: Synthesis of iron fertilization experi-ments: From the iron age in the age of enlightenment, J. Geophys. Res., 110, C09S16,
25
doi:10.1029/2004JC002601, 2005.
BGD
4, 2525–2557, 2007Impact of dust on ocean biogeochemistry
A. Tagliabue et al.
Title Page
Abstract Introduction
Conclusions References
Tables Figures
◭ ◮
◭ ◮
Back Close
Full Screen / Esc
Printer-friendly Version
Interactive Discussion
EGU
rising atmospheric carbon dioxide on the marine nitrogen fixer Trichodesmium, Global. Bio-geochem. Cycles, 21, GB2028, doi:10.1029/2006GB002898, 2007.
Blain, S., Quguiner, B., Armand, L., et al.: Effect of natural iron fertilization on carbon seques-tration in the Southern Ocean, Nature, 446, 1070-U1, doi:10.1038/nature05700, 2007. Bopp, L., Aumont, O., Cadule, P., Alvain, S., and Gehlen, M.: Response of diatoms distribution
5
to global warming and potential implications: A global model study, Geophys. Res. Lett., 32, L19606, doi:10.1029/2005GL023653, 2005.
Bopp, L, Kohlfield, K. E., Le Quere, C., and Aumont, O.: Dust impact on ma-rine biota and atmospheric CO2 during glacial periods, Paleoceanography, 18, 1046, doi:10.1029/2002PA000810, 2003.
10
Boyd, P. W., Watson, A. J., Law, C. S., et al.: A mesoscale phytoplankton bloom in the polar Southern Ocean stimulated by iron fertilization, Nature, 407, 695–702, 2000.
Boyd, P. W., Law, C. S., Wong, C. S., et al.: The decline and fate of an iron-induced phytoplank-ton bloom, Nature, 428, 549–553, 2004.
Capone, D. G., Zehr, J. P., Paerl, H. W., Bergman, B., and Carpenter, E.: Trichodesmium, a
15
globally significant marine cyanobacterium, Science, 276, 1221–1229, 1997.
Coale, K. H. Johnson, K. S., Fitzwater, S. E., et al.: A massive phytoplankton bloom induced by an ecosystem-scale iron fertilization experiment in the equatorial Pacific Ocean, Nature, 383, 495–501, 1996.
Codispoti, L., Brandes, J. A., Christensen, J. P., et al.: The oceanic fixed nitrogen and nitrous
20
oxide budgets: Moving targets as we enter the anthropocene?, Sci. Mar., 65, 85–105, 2001. Codispoti, L. A.: An oceanic fixed nitrogen sink exceeding 400 Tg N a−1 vs the concept of
homeostasis in the fixed-nitrogen inventory, Biogeosciences, 4, 233–253, 2007,
http://www.biogeosciences.net/4/233/2007/.
Deutsch, C., Sarmiento, J. L., Sigman, D. M., Gruber, N., and Dunne, J. P.: Spatial coupling
25
of nitrogen inputs and losses in the ocean, Nature, 445, 05392, doi:10.1038/nature05392, 2007.
Duce, R. A., Liss, P. S., Merrill, J. T., et al.: The atmospheric input of trace species to the world ocean, Global Biogeochem. Cycles, 5, 293–259, 1991.
Dutkiewicz, S., Follows, M. J., and Parekh, P.: Interactions of the iron and phosphorous
30
cycles: A three dimensional model study, Global Biogeochem. Cycles, 19, GB1021, doi:10.1029/2004GB002342, 2005.
BGD
4, 2525–2557, 2007Impact of dust on ocean biogeochemistry
A. Tagliabue et al.
Title Page
Abstract Introduction
Conclusions References
Tables Figures
◭ ◮
◭ ◮
Back Close
Full Screen / Esc
Printer-friendly Version
Interactive Discussion
EGU
shelf sediments: A missing source for global budgets, Geophys. Res. Lett., 31, L12307, doi:10.1029/2004GL020216, 2004.
Falkowski, P. G.: Evolution of the nitrogen cycle and its influence on the biological sequestration of CO2in the ocean, Nature, 387, 272–275. 1997.
Falkowski, P. G., Barber, R. T., and Smetacek, V.: Biogeochemical controls and feedbacks on
5
ocean primary production, Science, 281, 200–206, 1998.
Franck, V. M., Brzezinski, M. A., Coale, K. H., and Nelson, D. M.: Iron and silicic acid concen-trations regulate Si uptake north and south of the Polar Frontal Zone in the Pacific Sector of the Southern Ocean, Deep Sea Res. Part II, 47, 3315–3338, 2000.
Galloway, J. N., Dentener, F. J., Capone, D. G., et al.: Nitrogen cycles: past, present and future,
10
Biogeochemistry, 70, 153–226, 2004.
Ginoux, P., Chin, M., Tegen, I., Prospero, J. M., Holben, B., Dubovik, O., and Lin, S.-J.: Sources and distribution of dust aerosols with the GOCART model, J. Geophys. Res., 106, 20 225– 20 273, 2001.
Gruber, N. and Sarmiento, J. L.: Global patterns of nitrogen fixation and denitrification, Global
15
Biogeochem. Cycles, 11, 235–266, 1997.
Gruber, N.: The dynamics of the marine nitrogen cycle and its influence on atmospheric CO2 variations, in The Ocean Carbon Cycle, edited by M. Follow and T. Orguz, 97–148, Springer, New York, 2004.
Howell, E. A., Doney, S. C., Fine, R. A., and Olsen, D. B.: Geochemical estimates of
denitri-20
fication in the Arabian Sea and the Bay of Bengal during WOCE, Geophys. Res. Lett., 24, 2539–2552, 1997.
Hutchins, D. A. Fu, F.-X., Zhang, Y., et al.: CO2 control of Trichodesmium nitrogen fixation, photosynthesis, growth rates and elemental ratios: Implications for past, present and future ocean biogeochemistry, Limnol. Oceanogr., 52, 1293–1304, 2007.
25
Jickells, T. M. and Spokes, L. J.: in: The Biogeochemistry of Iron in Seawater, edited by: Turner, D. R. and Hunter, K., 85–121, Wiley, UK, 2001.
Jickells, T. D., An, Z. S., Andersen, K. K., et al.: Global iron connections between desert dust, ocean biogeochemistry, and climate, Science, 308, 67–71, 2005.
Keeling, C. D., Piper, S. C., Bacastow, R. B., Wahlen, M., Whorf, T. P., Heimann, M., and Meijer,
30
H. A.: Exchanges of Atmospheric CO2 and CO13CO2 with the Terrestrial Biosphere and Oceans from 1978 to 2000. I Global Aspects. SIO Reference No. 01-06, 2001.
BGD
4, 2525–2557, 2007Impact of dust on ocean biogeochemistry
A. Tagliabue et al.
Title Page
Abstract Introduction
Conclusions References
Tables Figures
◭ ◮
◭ ◮
Back Close
Full Screen / Esc
Printer-friendly Version
Interactive Discussion
EGU
Y.: Wintertime phytoplankton bloom in the subarctic Pacific supported by continental margin iron, Global Biogeochem. Cycles, 20, GB1006, doi:10.1029/2005GB002557, 2006.
Le Qu ´er ´e, C., Aumont, O., Bopp, L., et al.: Two decades of ocean CO2 sink and variability, Tellus B, 55, 649–656, 2003.
Lipschulz, F., Wofsy, S., Ward, B., Codispoti, L., Friedrich, G., and Elkins, J.: Bacterial
trans-5
formations of inorganic nitrogen in the oxygen deficient waters of the eastern tropical South Pacific, Deep Sea Res. Part I, 37, 1513–1541, 1990.
Madec, G., Delecluse, P., Imbard, M., and L ´evy, C.: OPA8.1 Ocean general circulation model reference manual, Notes du pole de model. 11, 91PP., Inst. Pierre-Simon Laplace, Paris, 1990.
10
Mahaffey, C, Michaels, A. F., and Capone, D. G.: The conundrum of marine n-2 fixation, Am. J. Sci., 305, 546–595, 2005.
Mahowald, N. M. and Luo, C.: A less dusty future? Geophys. Res. Lett., 30, 1903, doi:10.1029/2003GL017880 , 2003.
Mahowald, N. M., Muhs, D. R., Levis, S., et al.: Change in atmospheric mineral aerosols in
15
response to climate: last glacial period, modern and doubled carbon dioxide climates, J. Geophys. Res., 111, D10202, doi:10.1029/2005JD006653, 2006.
Martin, J. H.: Glacial-Interglacial CO2Change: the iron hypothesis, Paleoceanography, 5, 1–13, 1990.
Michaels, A. F., Karl, D. M., and Capone, D. G.: Element stoichiometry, new production nitrogen
20
fixation, Oceanography, 14, 68–77, 2001.
Middleberg, J. J., Soetaert, K, Herman, P. M. J., and Heip, C. H. R.: Denitrification in marine sediments: A model study, Global Biogeochem. Cycles, 10, 661–673, 1996.
Moore, J. K., Doney, S. C., Lindsay, K., et al.: N fixation amplifies the ocean biogeochemical response to decadal timescale variations in mineral dust deposition, Tellus, Ser. B, 58, 560–
25
572, 2006.
Moore, J. K. and Doney, S. C.: Iron availability limits the ocean nitrogen inventory stabilizing feedback between marine denitrification and nitrogen fixation, Global Biogeochem. Cycles, 21, GB2001, doi:10.1029/2006GB002762, 2007.
Nakicenovic, N. and Swart, R. (Eds.): Special Report on Emissions Scenarios. A Special
Re-30
BGD
4, 2525–2557, 2007Impact of dust on ocean biogeochemistry
A. Tagliabue et al.
Title Page
Abstract Introduction
Conclusions References
Tables Figures
◭ ◮
◭ ◮
Back Close
Full Screen / Esc
Printer-friendly Version
Interactive Discussion
EGU
world, Geophys. Res. Lett., 33, L03610, doi:10.1029/2005GL025098, 2006.
Raven, J. A.: Predictions of Mn and Fe use efficiencies of phototrophic growth as a function of light availability for growth and of C assimilation pathway, New. Phytol., 116, 1–18, 1990. Redfield, A. C.: On the proportions of organic derivations in sea water and their relation to the
composition of plankton, James Johnston Memorial Volume, pp. 176–192, Liverpool, 1934.
5
Rueter, J. G., Hutchins, D. A., Smith, R. W., and Unsworth, N. L.: Iron nutrition of Tri-chodesmium, in Marine Pelagic Cyanobacteria: Trichodesmium and other diazotrophs, edited by E. J. Carpenter, pp 289-306, Kluwer Academic Publishers, Dordecht, 1992. Sabine, C. L., Feely, R. A., Gruber, N., et al.: The oceanic sink for anthropogenic CO2, Science,
305, 367–371, 2004.
10
Sarmiento, J. L., Gruber, N., Brzezinski, M. A., and Dunne, J. P.: High latitude control of ther-mocline nutrients and low latitude productivity, Nature, 427, 56–60, 2004a.
Sarmiento, J. L., Slater, R., Barber, R., et al.: Response of ocean ecosystems to climate warm-ing, Global Biogeochem. Cycles, 18, GB3003, doi:10.1029/2003GB002134, 2004b.
Soetaert, K., Middleberg, J. J., Herman, P. M. J., and Buis, K.: On the coupling of benthic and
15
pelagic biogeochemical models, Earth Science Reviews, 51, 173–201, 2000.
Sunda, W. G. and Huntsman, S. A.: Interrelated influence of iron, light and cell size on marine phytoplankton growth, Nature, 390, 389–392, 1997
Tagliabue, A. and Arrigo, K. R.: Processes governing the supply of iron to phytoplankton in stratified seas, J. Geophys. Res., 111, C06019, doi:10.1029/2005JC003363, 2006.
20
Takeda, S.: Influence of iron availability on nutrient consumption ratio of diatoms in oceanic waters. Nature, 393, 774–777, 1998.
Tegen, I., Werner, M., Harrison, S. P., and Kohlfeld, K. E.: Relative importance of climate and land use in determining present and future global soil dust emission, Geophys. Res. Lett., 31, L0515, doi:10.1029/2003GL019216, 2004
25
Timmermann, R., Goose, H., Madec, G., Fichefet, T., Eth ´e, C., and Duli ´ere, V.: On the respre-sentation of high latitude processes in the ORCALIM global coupled sea ice-ocean model, Ocean Modell., 8, 175–201, 2003
Timmermans, K. R., van der Wagt, B., and de Baar, H. J. W.: Growth rates, half saturation constants, and silicate, nitrate, and phosphate depletion in relation to iron availability of four
30
large, open ocean diatoms from the Southern Ocean, Limnol. Oceanogr., 49, 2141–2151, 2004
BGD
4, 2525–2557, 2007Impact of dust on ocean biogeochemistry
A. Tagliabue et al.
Title Page
Abstract Introduction
Conclusions References
Tables Figures
◭ ◮
◭ ◮
Back Close
Full Screen / Esc
Printer-friendly Version
Interactive Discussion
EGU
Nature, 400, 525–531, 1999
Tyrrell, T., Merico, A., Waniek, J. J., et al.: Effect of seafloor depth on phytoplankton blooms in high-nitrate, low-chlorophyll (HNLC) regions, J. Geophys. Res., 110, G02007, doi:10.1029/2005JG000041, 2005
Wanninkhof, R.: Relationship between wind-speed and gas-exchange over the ocean, J.
Geo-5
BGD
4, 2525–2557, 2007Impact of dust on ocean biogeochemistry
A. Tagliabue et al.
Title Page
Abstract Introduction
Conclusions References
Tables Figures
◭ ◮
◭ ◮
Back Close
Full Screen / Esc
Printer-friendly Version
Interactive Discussion
EGU
Table 1. The impact of the simulated change in aeolian Fe deposition (Fe Dep, Tg Fe yr−1) on globally integrated NPP (NPP, Pg C yr−1
), N2fixation (N2Fix, Tg N yr−1
), denitrification (Denitr, Tg N yr−1
), the air-sea CO2 exchange (FCO2, Pg C yr−1
), and export production (Ex P, Pg C yr−1
) at three time points. The number in parenthesis is the percentage change relative to a control run, at the same point in time, which includes the change in atmospheric pCO2, but assumes pre industrial (i.e. 1860) dust deposition.
Year Fe Dep NPP N2Fix Denitr FCO2* Ex Pˆ
1860 0.25 35.8 81.7 39.4 –0.1 8.3 2000 0.16 (–38) 35.3 (–1.5) 75.7 (–7.4) 36.1 (–8.5) 1.9 (–5.5) 8.1 (–2.1) 2100 0.06 (–60) 34.6 (–3.3) 67.8 (–17.0) 34.4 (–12.7) 6.2 (–3.4) 7.8 (–5.1)
*For FCO2, a positive value denotes ocean uptake of atmospheric CO2and a negative percent-age change therefore represents a reduction in ocean uptake.
BGD
4, 2525–2557, 2007Impact of dust on ocean biogeochemistry
A. Tagliabue et al.
Title Page
Abstract Introduction
Conclusions References
Tables Figures
◭ ◮
◭ ◮
Back Close
Full Screen / Esc
Printer-friendly Version
Interactive Discussion
EGU
Table 2. Integrated annual rates (Tg N yr−1
) of N2fixation and denitrification, as a function of year and ocean basin. The number in parenthesis is the percentage change relative to a control run, at the same point in time, which includes the change in atmospheric pCO2, but assumes pre industrial (i.e. 1860) dust deposition. See Table 1 for the globally integrated rates.
N2Fixation (Tg N yr−1
) Denitrification (Tg N yr−1
) Atlantic Pacific Indian Atlantic Pacific Indian
1860 25.2 35.2 21.0 2.0 33.4 4.2 2000 24.2
(–4.1)
31.3 (–11.2)
20.0 (–5.1)
2.1 (+7.9)
29.9 (–10.5)
4.1 (–2.3) 2100 22.2
(–12.1)
26.8 (–23.9)
18.6 (–11.6)
2.2 (+13.1)
28.5 (–14.7)
BGD
4, 2525–2557, 2007Impact of dust on ocean biogeochemistry
A. Tagliabue et al.
Title Page
Abstract Introduction
Conclusions References
Tables Figures
◭ ◮
◭ ◮
Back Close
Full Screen / Esc
Printer-friendly Version
Interactive Discussion
EGU
-100 -80 -60 -40 -20 0 20
Percentage change in annual Fe deposition (between 2000 and 2100) 60°N
0°
60°S
60°E 120°E 180° 120°W 60°W 0° 60°E
BGD
4, 2525–2557, 2007Impact of dust on ocean biogeochemistry
A. Tagliabue et al.
Title Page
Abstract Introduction
Conclusions References
Tables Figures
◭ ◮
◭ ◮
Back Close
Full Screen / Esc
Printer-friendly Version
Interactive Discussion
EGU 0
50 100 150 200 250 350 450
Annual NPP in 2000 (gC m-2 yr-1)
60°N
0°
60°S
-70 -50 -30 -10 10 30 50 70
Annual air-sea CO2 exchange in 2000 (gC m-2 yr-1)
60°N
0°
60°S
60°E 120°E 180° 120°W 60°W 0° 60°E
0 0.4 0.8 1.2 1.6 2
Annual N2 fixation in 2000 (gN m-2 yr-1)
0 2 4 6 8 10 15 20 25
Annual Denitrification in 2000 (gN m-2 yr-1)
60°E 120°E 180° 120°W 60°W 0° 60°E
A
B
D
C
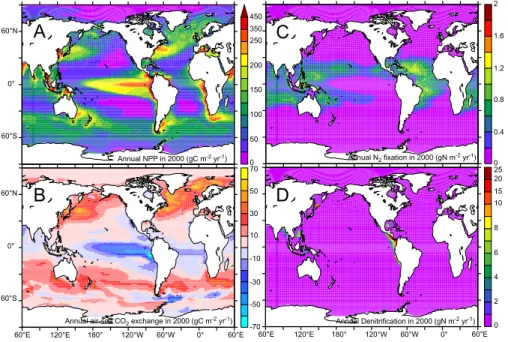
Fig. 2.The annual rate of(a)NPP (gC m−2
yr-1),(b)air-sea CO2exchange (gC m−2
yr−1
),(c)
N2fixation (gN m−2
yr−1
), and(d)denitrification (gN m−2
yr−1
BGD
4, 2525–2557, 2007Impact of dust on ocean biogeochemistry
A. Tagliabue et al.
Title Page
Abstract Introduction
Conclusions References
Tables Figures
◭ ◮
◭ ◮
Back Close
Full Screen / Esc
Printer-friendly Version
Interactive Discussion
EGU
-30 -20 -10 0 10 20 30
Absolute D annual NPP in 2100 (gC m-2
yr-1
) 60°N
0°
60°S
LONGITUDE
-20 -10 0 10 20
Absolute D annual air-sea CO2 exchange in 2100 (gC m-2
yr-1
) 60°N
0°
60°S
60°E 120°E 180° 120°W 60°W 0° 60°E
-0.3 -0.2 -0.1 0.1 0.2 0.3
0
Absolute D N2 fixation in 2100 (gN m-2
yr-1
)
-1.5 -0.9 -0.3 0 0.3 0.9 1.5
Absolute D denitrification in 2100 (gN m-2
yr-1
) 60°E 120°E 180° 120°W 60°W 0° 60°E
FIGURE 3 A
B D
C
Fig. 3.The absolute change in(a)NPP (gC m-2 yr-1),(b)air-sea CO2exchange (gC m−2
yr−1
),
(c)N2fixation (gN m−2
yr−1
), and(d)denitrification (gN m−2
yr−1
BGD
4, 2525–2557, 2007Impact of dust on ocean biogeochemistry
A. Tagliabue et al.
Title Page Abstract Introduction Conclusions References Tables Figures ◭ ◮ ◭ ◮ Back Close
Full Screen / Esc
Printer-friendly Version Interactive Discussion EGU -0.2 0 0.2 0.4 0.6 0.8 1 1.2 1.4 1.6 1.8 2
Absolute D in surface NO3 in 2100 (µM) 60°N 0° 60°S 60°N 0° 60°S
60°E 120°E 180° 120°W 60°W 0° 60°E
-5 -4 -3 -2 -1 -0.8 -0.6 -0.4 -0.2 0 0.1
Absolute D in surface Fe in 2100 (nM)
Percentage D in diatom abundance in 2100 -50 -40 -30 -20 -10 10 20 30 40 50 0 -0.2 0 0.2 0.4 0.6 0.8 1 1.2
Absolute D in 250 m NO3 in 2100 (µM)
60°E 120°E 180° 120°W 60°W 0° 60°E
FIGURE 4
A
B
D
C
Fig. 4.The change in the annually averaged(a)NO3at the surface (absolute,µM),(b)Fe at the
BGD
4, 2525–2557, 2007Impact of dust on ocean biogeochemistry
A. Tagliabue et al.
Title Page
Abstract Introduction
Conclusions References
Tables Figures
◭ ◮
◭ ◮
Back Close
Full Screen / Esc
Printer-friendly Version
Interactive Discussion
EGU
SURF
DEEP
Dust
NPP
NFix Fe
DIN
DIN
O2
O2
Denit EP
A
I
D
E
J L
L B
H
C
G
F K