ACPD
10, 25329–25354, 2010Deposition of dinitrogen pentoxide,
N2O5
D. M. Huffet al.
Title Page
Abstract Introduction
Conclusions References
Tables Figures
◭ ◮
◭ ◮
Back Close
Full Screen / Esc
Printer-friendly Version
Interactive Discussion
Discussion
P
a
per
|
Dis
cussion
P
a
per
|
Discussion
P
a
per
|
Discussio
n
P
a
per
|
Atmos. Chem. Phys. Discuss., 10, 25329–25354, 2010 www.atmos-chem-phys-discuss.net/10/25329/2010/ doi:10.5194/acpd-10-25329-2010
© Author(s) 2010. CC Attribution 3.0 License.
Atmospheric Chemistry and Physics Discussions
This discussion paper is/has been under review for the journal Atmospheric Chemistry and Physics (ACP). Please refer to the corresponding final paper in ACP if available.
Deposition of dinitrogen pentoxide, N
2
O
5
,
to the snowpack at high latitudes
D. M. Huff1,2, P. L. Joyce1,2, G. J. Fochesatto2,3, and W. R. Simpson1,2
1
Department of Chemistry and Biochemistry, University of Alaska, Fairbanks, AK, USA
2
Geophysical Institute, University of Alaska, Fairbanks, AK, USA
3
Department of Atmospheric Science, University of Alaska, Fairbanks, AK, USA
Received: 22 September 2010 – Accepted: 9 October 2010 – Published: 1 November 2010
Correspondence to: W. R. Simpson ([email protected])
ACPD
10, 25329–25354, 2010Deposition of dinitrogen pentoxide,
N2O5
D. M. Huffet al.
Title Page
Abstract Introduction
Conclusions References
Tables Figures
◭ ◮
◭ ◮
Back Close
Full Screen / Esc
Printer-friendly Version
Interactive Discussion
Discussion
P
a
per
|
Dis
cussion
P
a
per
|
Discussion
P
a
per
|
Discussio
n
P
a
per
|
Abstract
Dinitrogen pentoxide, N2O5, is an important nighttime intermediate in oxidation of NOx
that is hydrolysed on surfaces. We conducted a field campaign in Fairbanks, Alaska during November, 2009 to measure the flux (and deposition velocity) of N2O5 deposit-ing to snowpack usdeposit-ing the aerodynamic gradient method. The deposition velocity of
5
N2O5under Arctic winter conditions was found to be 0.59±0.47 cm/s, which is the first
measurement of this parameter to our knowledge. Based on the measured deposition velocity, we compared the chemical loss rate of N2O5 via snowpack deposition to the
total steady state loss rate and found that deposition to snowpack is a significant frac-tion of the total chemical removal of N2O5measured within a few meters of the ground
10
surface.
1 Introduction
High-latitude nighttime nitrogen oxide chemistry is dominated by the oxidation of NO2 by ozone to form nitrate radical, NO3 (Reaction R1). NO3 and NO2 combine to form
N2O5, (Reaction R2) in a temperature dependent equilibrium that is favored under cold
15
and dark conditions that exist in winter at high latitudes. The major chemical loss process for N2O5is heterogeneous hydrolysis (Reaction R3). The following reactions
are the nighttime pathway for N2O5chemical removal.
NO2+O3→NO3+O2 (R1)
NO2+NO3⇆N2O5 (R2)
20
N2O5+H2O Surface
−−−−−→2HNO3 (R3)
The production of nitric acid (Reaction R3) contributes to acid rain, adds fixed nitrogen
to the ecosystem, and removes NOx. Acid rain is known to have many damaging
ACPD
10, 25329–25354, 2010Deposition of dinitrogen pentoxide,
N2O5
D. M. Huffet al.
Title Page
Abstract Introduction
Conclusions References
Tables Figures
◭ ◮
◭ ◮
Back Close
Full Screen / Esc
Printer-friendly Version
Interactive Discussion
Discussion
P
a
per
|
Dis
cussion
P
a
per
|
Discussion
P
a
per
|
Discussio
n
P
a
per
|
latitudes (Andersen and Hovmand, 1995; Bytnerowicz et al., 1998; Fenn et al., 2003), and removal of NOxaffects the possibility of downwind ozone production.
The heterogeneous reaction of N2O5(Reaction R3) is an important reaction for NOx
loss. In a modeling study, Dentener and Crutzen (1993) found that during the winter 80% of high latitude NOxis lost by Reaction (R3a), which is the dominant dark pathway
5
to nitric acid. Since the Dentener and Crutzen (1993) modeling study, many laboratory experiments have been completed investigating N2O5 heterogeneous hydrolysis and
the dependence on aerosol particle chemical composition (Mozurkewich and Calvert, 1988; Kirchner et al., 1990; Hanson and Ravishankara, 1991; Van Doren et al., 1991). The N2O5uptake coefficient, or surface reaction probability,γ, describes the probability
10
of chemical reaction of N2O5 on an aerosol surface. In more recent models, different parameterizations ofγ have been used that identify the dependence on aerosol com-position and temperature (Riemer et al., 2003; Evans and Jacob 2005). Bertram and Thornton (2009) parameterized N2O5 based on γ’s dependence on H2O(l), Cl− and
NO−3 for organic and inorganic mixed aerosols.
15
There have been several field measurements of N2O5 at mid-latitudes (Brown et
al., 2001; Matsumoto et al., 2005; Wood et al., 2005; Brown et al., 2006; Bertram et al., 2009). Brown et al. (2006) was the first field study to show a dependence on aerosol particle composition in a large aircraft field study over the Eastern US. Brown et al. (2006) related N2O5 chemistry to sulfate aerosol particle content and observed
20
faster uptake of N2O5 to the aerosol particles when the aerosol particles had high
sulfate content. Most recently, mid-latitude field studies found N2O5 in both coastal
(Roberts et al., 2008) and inland (Thornton et al., 2009) regions reacts with chloride and forms nitryl chloride. Nitryl chloride is a photolabile nighttime reservoir that can produce reactive chlorine radicals when photolysed at sunrise (Thornton et al., 2009).
25
Bertram et al. (2009) employed a new technique measuring the uptake coefficient of N2O5 on ambient aerosols directly by using chemical ionization mass spectroscopy
(CIMS) to measure reactive loss of N2O5when added to a flow tube reactor containing
ACPD
10, 25329–25354, 2010Deposition of dinitrogen pentoxide,
N2O5
D. M. Huffet al.
Title Page
Abstract Introduction
Conclusions References
Tables Figures
◭ ◮
◭ ◮
Back Close
Full Screen / Esc
Printer-friendly Version
Interactive Discussion
Discussion
P
a
per
|
Dis
cussion
P
a
per
|
Discussion
P
a
per
|
Discussio
n
P
a
per
|
Our research group has previously performed high latitude field studies and have reported aerosol surfaces densities were insufficient to account for all of the chemical loss of N2O5 at high latitudes (Ayers and Simpson, 2006; Apodaca et al., 2008). We
implicated other reactive surfaces for N2O5chemical loss, such as ice, either on atmo-spheric particles or in the snowpack. Ayers and Simpson (2006) measured N2O5on the
5
top of a building, 85 m above the ground and found higher mixing ratios aloft, which is consistent with some of the N2O5removal being by deposition to Earth’s snow-covered surface. Calculated lifetimes aloft ranged from minutes to several hours. Higher N2O5
mixing ratios further from Earth’s surface is in agreement with others who have studied the vertical profile of N2O5 (Brown et al., 2003; Geyer and Stutz 2004; Stutz et al.,
10
2004; Brown et al., 2007a, b). Apodaca et al. (2008) observed the mixing ratios of N2O5 to be much lower and the average lifetime was 6 min under nighttime high
rela-tive humidity conditions, which is common in the wintertime Arctic near the surface. In these past studies, there was not a sufficient amount of meteorological data recorded to separate snowpack deposition from reaction on particles.
15
Here, we report upon a field campaign quantifying the heterogeneous hydrolysis loss of N2O5 by snowpack deposition. The deposition velocity of N2O5 helps to im-prove process-based models aimed at understanding the vertical profile of N2O5 at
high latitudes and the fate of NOx via the nighttime chemical pathway. Measuring a
flux during nighttime in the Arctic is difficult due to extreme atmospheric stability. In a
20
very stable atmosphere the vertical mixing is hindered and turbulence is sporadic and upper layers may become decoupled from the ground (Anderson and Neff, 2008). The experimental design to measure a flux required sufficient instrumentation and calcu-lations to have an adequate fetch and neutral atmospheric conditions appropriate to satisfy the Monin-Obukhov similarity theory. Although the deposition velocity of N2O5
25
ACPD
10, 25329–25354, 2010Deposition of dinitrogen pentoxide,
N2O5
D. M. Huffet al.
Title Page
Abstract Introduction
Conclusions References
Tables Figures
◭ ◮
◭ ◮
Back Close
Full Screen / Esc
Printer-friendly Version
Interactive Discussion
Discussion
P
a
per
|
Dis
cussion
P
a
per
|
Discussion
P
a
per
|
Discussio
n
P
a
per
|
In this study, we measure the N2O5 deposition flux using the aerodynamic gradient method. From the flux we can calculate the deposition velocity of N2O5. In addition
to deposition of N2O5 to the surface, N2O5 is also lost by reaction on atmospheric
particles. Therefore, we can divide (Reaction R3) into two sub-processes.
N2O5+H2O→2HNO3(snowpack deposition) (R3a)
5
N2O5+H2O→2HNO3(reaction on particles) (R3b)
The measured deposition velocity of N2O5is combined with atmospheric assumptions to estimate the effective snowpack deposition rate k3a (Reaction R3a). We also mea-sured the total chemical removal rate of N2O5 via a steady-state analysis, which
de-termines the sum of the loss ratesk3a andk3b. Therefore, the relative role of the two
10
sub-processes, snowpack deposition and atmospheric reactions, is determined. We conclude by discussing implications of these results for the deposition of nitric acid, NOxlosses, and N2O5vertical profiles at high latitudes.
2 Experimental design
The field site for the study was located in a snow-covered agricultural field 20 km
south-15
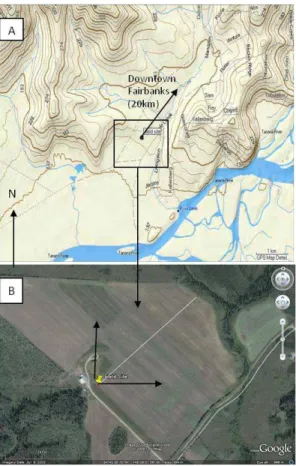
west of the city of Fairbanks (the site coordinates are 64.75929◦N, 148.10618◦W, 161 m above mean sea level). An insulated hut on skis housed the instruments at this remote field site. The field study operated continuously from 5 November 2009 until 18 November 2009. Mildly polluted air originating from Fairbanks is carried from the northeast direction by a down-slope drainage flow towards the field site. The local
20
drainage flow is guided by a U-shaped ridge that forms a bowl around the field site as seen in the contour map in Fig. 1a.
Using the contour lines in Fig. 1a, we can estimate the slope of the field site. The bowl loses 6 m of elevation in 400 m of fetch, a change of 1.5% or a 0.8◦ slope. The fetch is a uniform flat upwind distance from the measurement towers. Oke (1987)
esti-25
ACPD
10, 25329–25354, 2010Deposition of dinitrogen pentoxide,
N2O5
D. M. Huffet al.
Title Page
Abstract Introduction
Conclusions References
Tables Figures
◭ ◮
◭ ◮
Back Close
Full Screen / Esc
Printer-friendly Version
Interactive Discussion
Discussion
P
a
per
|
Dis
cussion
P
a
per
|
Discussion
P
a
per
|
Discussio
n
P
a
per
|
which, in our case, is 2.4 m, indicating a 240 m fetch is required. Our site satisfies the minimum requirement with a 400 m fetch. Under the common nighttime cold and stable air flow in the Arctic, we recognize the possibility of needing longer fetch. Therefore, we considered other methods as described in Horst and Weil (1994) to calculate the adequacy of the fetch and are discussed in Huff(2010).
5
3 Methods
3.1 Chemical measurements
A field portable instrument using the cavity ring down spectroscopy (CRDS) was de-veloped in our laboratory to measure N2O5 at remote sites (Simpson, 2003; Ayers et al., 2005). We have used this CRDS instrument during past field studies (Ayers and
10
Simpson, 2006; Apodaca et al., 2008) and the major modification we made for the present field study was adding a 10 m Teflon inlet. The 3/8′′ (9.5 mm) inner diameter
PFA Teflon inlet was configured with a 100 slpm bypass flow to minimize the contact time of the sampled air with the inlet. The total residence time in the fast-flow inlet is 0.4 seconds. Flow-changing studies were carried out to determine inlet loss of N2O5
15
on the tubing resulting in a transmission of 76%. The transmission of N2O5on the inlet
and instrumental surfaces were taken into account in the analysis resulting in corrected ambient mixing ratios, as has been done in past studies (Ayers and Simpson, 2006; Apodaca et al., 2008). In addition to the N2O5instrument, the same high-flow inlet
pro-vided air to ancillary instruments that measure NOx (Thermo Environmental 42c) and
20
ACPD
10, 25329–25354, 2010Deposition of dinitrogen pentoxide,
N2O5
D. M. Huffet al.
Title Page
Abstract Introduction
Conclusions References
Tables Figures
◭ ◮
◭ ◮
Back Close
Full Screen / Esc
Printer-friendly Version
Interactive Discussion
Discussion
P
a
per
|
Dis
cussion
P
a
per
|
Discussion
P
a
per
|
Discussio
n
P
a
per
|
3.2 Steady state analysis of N2O5measurements
We use the steady state approximation to calculate a lifetime of N2O5from the
concen-tration of N2O5divided by the source rate of N2O5(Apodaca et al., 2008),
τN2O5ss=
N2O5
k1[NO2]
O3. (1)
The source rate of N2O5 is the rate coefficient for Reaction (R1), k1, multiplied by
5
the concentration of NO2 and ozone. We assume we achieve steady state rapidly
(Apodaca et al., 2008), although this assumption is discussed later. The steady-state lifetime of N2O5is used to determine the total heterogeneous hydrolysis rate of N2O5,
the sum of Reactions (R3a) and (R3b).
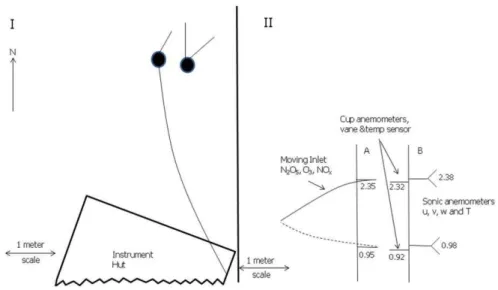
3.3 Near surface gradient measurements 10
Figure 2 shows the field configuration of the chemical inlet and meteorological mea-surement towers designed for near-surface gradient meamea-surements. Two separate tow-ers, one with a moving inlet for chemical measurements and one for meteorological measurements, were used so the vibration of the moving inlet did not affect the meteo-rological measurements. The measurement towers were located 2 m upwind from the
15
instrument-housing insulated hut.
The moveable-inlet tower alternated position between “up” and “down” heights, 2.35 m and 0.95 m, respectively. The moveable inlet sampled the gases, N2O5, NOx
and ozone, at the two levels. The up/down state of the inlet was recorded in data files and used in post-processing to calculate gradients in each chemical. The moveable
20
inlet was mounted on a separate tower horizontally displaced 0.5 m from the meteoro-logical tower.
ACPD
10, 25329–25354, 2010Deposition of dinitrogen pentoxide,
N2O5
D. M. Huffet al.
Title Page
Abstract Introduction
Conclusions References
Tables Figures
◭ ◮
◭ ◮
Back Close
Full Screen / Esc
Printer-friendly Version
Interactive Discussion
Discussion
P
a
per
|
Dis
cussion
P
a
per
|
Discussion
P
a
per
|
Discussio
n
P
a
per
|
vanes to measure wind speed and direction (model 03001-5) and two temperature sensors (RM Young 41342) at the same heights as the moveable inlet (within a few cm, as noted on Fig. 2) and logged as one minute averages on a Campbell Scientific CR10x data logger. The meteorological tower and sampling inlet both faced into the prevailing wind direction at approximately the same length from the towers (within a
5
few cm) so they were horizontally aligned.
The meteorological measurement tower also supported two sonic anemometers (RM Young model 84000) producing 10 Hz data on a separate data logger (Chaparral Physics). The purpose of the sonic anemometers at the same height as the low fre-quency meteorological tower instruments is twofold. First, the redundant
measure-10
ments verify the temperature, wind speed and direction data and gradients. Second, the high frequency data from the sonic anemometers allow validation of our flux mea-surements by calculating the heat flux by both the aerodynamic gradient method and eddy covariance. The details of the heat flux comparison by the aerodynamic and eddy covariance methods can be found in the Supplement.
15
3.4 Aerodynamic gradient flux analysis
There are three main flux measurement techniques: the aerodynamic method, the Bowen ratio method, and the eddy covariance method (Oke, 1987; Monteith and Unsworth, 1990; Bocquet, 2007). The aerodynamic method uses a two (or more) point profile system to measure the chemicals near surface gradient and
anemome-20
ters to measure the wind speed and direction and gradients. Using the aerodynamic method, we rely on the Monin-Obukhov similarity theory to derive a flux equation for N2O5. The similarity theory states that under neutral atmospheric stability the surface
layer is homogenous and the eddy diffusivity transfer coefficient of momentum,Km, is equal to the gas’s transfer coefficient,KN
2O5 (Oke, 1987; Monteith and Unsworth, 1990;
25
ACPD
10, 25329–25354, 2010Deposition of dinitrogen pentoxide,
N2O5
D. M. Huffet al.
Title Page
Abstract Introduction
Conclusions References
Tables Figures
◭ ◮
◭ ◮
Back Close
Full Screen / Esc
Printer-friendly Version
Interactive Discussion
Discussion
P
a
per
|
Dis
cussion
P
a
per
|
Discussion
P
a
per
|
Discussio
n
P
a
per
|
near the surface, which is a downward-directed flux. To obtain the deposition velocity, we divide the opposite of the flux by the average concentration of N2O5,
vdep=−
FN2O5
CN2O5
=−k2
∆u∆C N2O5
[ln(z1/z2)] 2
CN2O5
(ΦMΦN
2O5)
−1. (2)
In this equation,∆uis the average difference in wind speed between the two heights,
z1 and z2,∆CN2O5 is the average difference in mixing ratio of N2O5 between the two
5
heights,kis the Von Karman constant, which equals 0.4. The generalized stability fac-tor, (ΦMΦN
2O5) −1
, allows us to correct the flux (FN2O5) for atmospheric conditions that
are near neutral (Oke, 1987). The generalized stability factor has different equations under different atmospheric stabilities and we used the generalized stability factors
and Ri range found in Oke (1987) and these factors are the same as Monteith and
10
Unsworth (1990), but theRi range application is different. The average N2O5 mixing ratio isCN2O5. The deposition velocity (vdep) is independent of the amount of pollution
(the amount of N2O5) and is therefore more useful for modeling of snowpack
deposi-tion. When the deposition velocity is positive, N2O5 is directed downward toward the surface.
15
The aerodynamic method for calculating the flux of N2O5,FN2O5 only applies under
a very narrow window of atmospheric stability under a nearly neutral atmosphere. A neutral atmosphere is defined by having negligible buoyancy effects. We can use the gradient Richardson number, Ri, to indentify appropriate atmospheric stability condi-tions and to correct the flux for a slightly stable or unstable atmosphere. The
dimen-20
sionless Richardson number relates the vertical gradients of wind and temperature by taking the ratio of the buoyancy to shear stress, (Stull, 1988)
Ri=g
T
∆
T
∆z
∆
u
∆z
ACPD
10, 25329–25354, 2010Deposition of dinitrogen pentoxide,
N2O5
D. M. Huffet al.
Title Page
Abstract Introduction
Conclusions References
Tables Figures
◭ ◮
◭ ◮
Back Close
Full Screen / Esc
Printer-friendly Version
Interactive Discussion
Discussion
P
a
per
|
Dis
cussion
P
a
per
|
Discussion
P
a
per
|
Discussio
n
P
a
per
|
The linear approximation for Richardson number Eq. (3) is more accurate than the log-arithmic approximation (Arya, 2001) under stable atmospheric conditions. Under night-time Arctic conditions, we are more commonly under stable atmospheric conditions, so we used the linear approximation for the Richardson number. On the other hand, when the Richardson number is above 0.25, turbulence decays and the atmosphere is very
5
stable, and laminar flow, once established, is stable. When the Richardson number is less than−1, the atmosphere is dominated by free convection (Monteith and Unsworth,
1990; Stull, 1988).
Outside of the gradient Richardson index range−1 to 0.25, the general stability
fac-tors, (ΦMΦN
2O5) −1
are unusually large or small and cannot correct the flux to account
10
for divergence from near neutral atmospheric conditions. As the Richardson number approaches 0.25, this is considered the critical Richardson number beyond which tur-bulent exchange is completely dissipated. Though the value of 0.25 is still debated and is only an approximation to limit of turbulent exchange, some turbulence exchange with a gradient Richardson number as high as 1 (Pardyjak et al., 2002). Although other
15
authors (Monteith and Unsworth, 1990; Stull, 1988; Arya, 2001) propose slightly dif-ferent limiting Ri values ranges and formulations for the general stability factors, we
chose to use general stability factors and acceptableRi ranges from Oke (1987). Two
different general stability factor correction functions are used, one for positive Ri val-ues, and one for negativeRi values. Because these general stability factors become
20
large towards limits, we only analyzed data in the range−0.1< Ri <0.12. We used a
narrow range ofRi values to ensure we not reaching our fetch limitations, and based on a method described in Horst and Weil (1994), we are measuring>90% of the true flux.
4 Results 25
ACPD
10, 25329–25354, 2010Deposition of dinitrogen pentoxide,
N2O5
D. M. Huffet al.
Title Page
Abstract Introduction
Conclusions References
Tables Figures
◭ ◮
◭ ◮
Back Close
Full Screen / Esc
Printer-friendly Version
Interactive Discussion
Discussion
P
a
per
|
Dis
cussion
P
a
per
|
Discussion
P
a
per
|
Discussio
n
P
a
per
|
data. The two individual state averages were differenced and divided by the height difference to get the chemical gradients. Steady-state chemical lifetimes were calcu-lated using temperature-dependent formation kinetics. Wind speed and temperature differences were calculated from the two inter-calibrated instrument sets. The gradient Richardson number,Ri, was calculated to determine periods where the stability was
5
appropriate for the calculation of fluxes.
First, a filter was applied for the wind direction and a solar flag for nighttime data to find appropriate nights for analysis. The data were then selected by calculating the Richardson number in Eq. (3) and using the narrow range of 0.12> Ri>−0.1. From the
results of the gradient Richardson number calculation, wind direction, and instrument
10
calibrations we focused our analysis on three nights of the campaign. The three nights were 5, 10 and 11 November, 2009. On these three nights the parameters were met for calculating a deposition velocity except for one half hour period on 5 November, 2009 where the Richardson number was 0.16, and was slightly out of range; however, this point was included in the analysis for completeness.
15
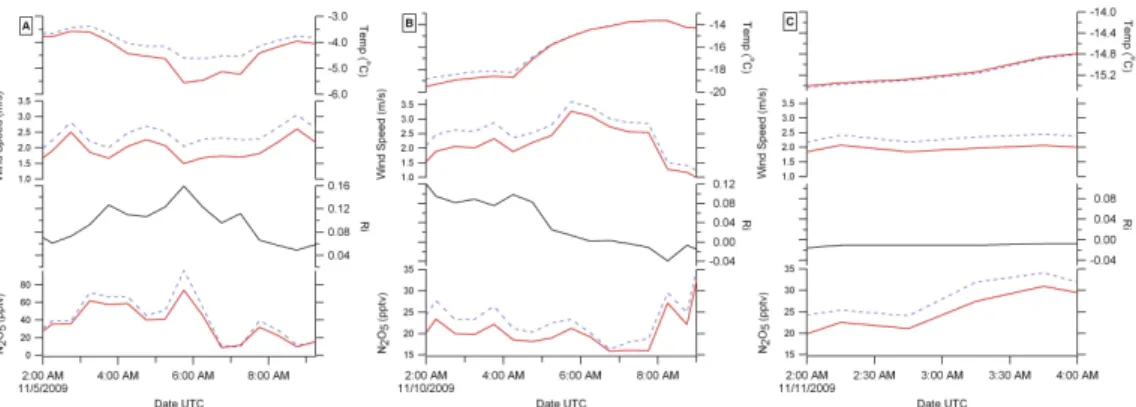
In Fig. 3, all three nights had neutral to near neutral atmospheric conditions. The temperature averages on the 5, 10, and 11 November 2009 were−4◦, −18◦,−14◦C,
respectively. The highest temperature gradient was seen on 5 November with a 1◦C difference in the two heights and a stable atmosphere. In this case, the upper level was warmer indicating an inversion, which is typical of cold, stable Arctic nights. Most
20
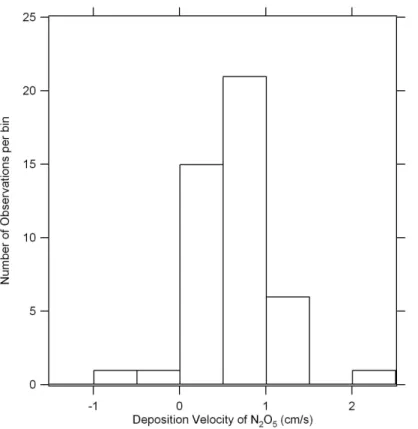
of the data had small to no inversions, which was appropriate of measuring a flux. The average wind speeds were 2.3, 2.7 and 2.5 m/s, respectively. The difference in wind speeds and the difference in N2O5 mixing ratios were used to calculate the flux, the numerator in the deposition velocity Eq. (2). Figure 4 shows a histogram of the mea-surements of the deposition velocity. More than 90% of the deposition velocities are
25
positive or directed downward toward the snowpack. The average deposition velocity is 0.59±0.47 cm/s.
ACPD
10, 25329–25354, 2010Deposition of dinitrogen pentoxide,
N2O5
D. M. Huffet al.
Title Page
Abstract Introduction
Conclusions References
Tables Figures
◭ ◮
◭ ◮
Back Close
Full Screen / Esc
Printer-friendly Version
Interactive Discussion
Discussion
P
a
per
|
Dis
cussion
P
a
per
|
Discussion
P
a
per
|
Discussio
n
P
a
per
|
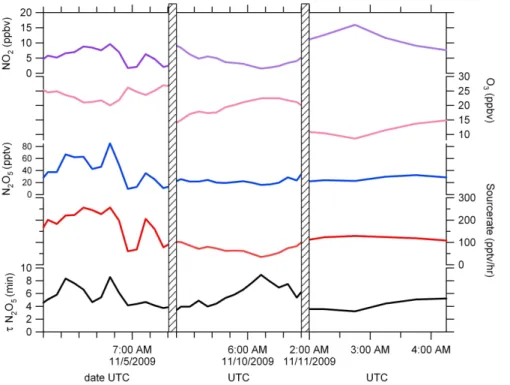
lifetime of N2O5using Eq. (1). The steady state lifetime represents total chemical loss of N2O5, including snowpack deposition and atmospheric reactions. The time series of
the average NO2, O3, source rate, N2O5and steady state lifetime of N2O5are displayed
in Fig. 5.
The concentration of NO2 in ppbv ranges from a few ppbv to 20 ppbv at night.
Al-5
though we found large differences in N2O5 between heights (15% on average and up to 50%), the difference between NO2 and ozone between the heights was small. The average difference in NO2between the two measurement heights varied by less than 2.6±3% and the ozone varied by 1±2%. Because the gradients in all chemicals other
than N2O5 were small, Fig. 5 shows half-hour averages independent of the up/down
10
state of the sampler.
The average steady state lifetime of N2O5 is 6 min. The transport timescale of
polluted air to reach the site from Fairbanks given an average measured speed of 2.3 m/s and 20 km distance and assuming direct transport is around 2 h. The transport timescale is longer than the maximum calculated lifetime of N2O5of 10 min, reinforcing
15
the picture that the steady-state approximation is decent in this application.
5 Discussion
5.1 Deposition velocity of N2O5
Deposition velocities are parameters used to model the effects of nitrogen oxides on the environment. There are many studies using micrometeorology methods to
mea-20
sure trace gas dry deposition velocities (Lovett, 1994; Wesely and Hicks, 2000; Watt et al., 2004; Muller et al., 2009). Deposition velocities above a snow pack have been measured for ozone and our summarized in Helmig et al. (2007) and Wesley and Hicks (2000). Arctic studies of the deposition velocities to snow pack have been mea-sured for ozone and found to be less than or equal to 0.01 cm/s (Helmig et al., 2009).
25
ACPD
10, 25329–25354, 2010Deposition of dinitrogen pentoxide,
N2O5
D. M. Huffet al.
Title Page
Abstract Introduction
Conclusions References
Tables Figures
◭ ◮
◭ ◮
Back Close
Full Screen / Esc
Printer-friendly Version
Interactive Discussion
Discussion
P
a
per
|
Dis
cussion
P
a
per
|
Discussion
P
a
per
|
Discussio
n
P
a
per
|
they are generally negligible. There are several studies quantifying the emission of NOx from the snowpack and though NOx emission from the snowpack can be signifi-cant, it is driven by photochemistry (Honrath et al., 2002; Jones et al., 2001), which is not relevant in the present nocturnal study. Jones et al. (2001) studied NOx emission
form the Arctic snowpack by measuring NO2at two different heights and found a diurnal
5
cycling of NOxwith deposition velocities near zero at night. To our knowledge, there are
no reported deposition velocities for N2O5. A positive deposition velocity means N2O5
is reacting to other species on snowpack surfaces. At high latitude in winter, snow pack covers almost the entire ground surface. The snowpack deposition is a reactive loss of N2O5and it is therefore important to quantify the deposition velocity for understanding
10
the fate of nitrogen oxides in the high latitude environments.
Our measured downward directed deposition velocity of N2O5to the snowpack is on
the order of 1 cm/s and is in the same range as previously reported values for nitric acid over snow (0.5–1.4 cm/s) (Cadle et al., 1985). In Fig. 4, the average deposition velocity for all three focus nights is 0.59±0.47 cm/s.
15
5.2 Comparisons of N2O5chemical removal rates
To compare the atmospheric N2O5chemical removal rate arising from snowpack
depo-sition to the total steady state chemical removal rate, we need to estimate an effective deposition layer height. The profile of the N2O5 deposition flux through the boundary
layer is unknown, but decays to zero at the boundary layer height by the definition that
20
the boundary layer is the region influenced by surface chemical processes. Because the flux decreases with height, the effective layer height, zeff, over which N2O5 is de-posited, is less than the boundary layer height under moderately stable conditions. The profile of the momentum flux is represented by the shear stress equation for a moder-ately stable boundary layer and decays toward zero as a power law, as shown in Arya
25
ACPD
10, 25329–25354, 2010Deposition of dinitrogen pentoxide,
N2O5
D. M. Huffet al.
Title Page
Abstract Introduction
Conclusions References
Tables Figures
◭ ◮
◭ ◮
Back Close
Full Screen / Esc
Printer-friendly Version
Interactive Discussion
Discussion
P
a
per
|
Dis
cussion
P
a
per
|
Discussion
P
a
per
|
Discussio
n
P
a
per
|
under slightly stable boundary layer conditions. The vertical profile of the N2O5 depo-sition flux has the same shape as the momentum flux profile based the Monin-Obukov similarity theory, which assumes that all the fluxes are the same in the surface layer, typically the lower 10% of the boundary layer (Oke, 1987; Monteith and Unsworth, 1990; Arya, 2001). Using this flux profile, we show in the supplemental material that
5
zeff is approximately 15 m. The N2O5 chemical removal rate arising from snowpack
deposition (Reaction R3a) is then given by
k3a=
vdep
zeff
. (4)
For these three nights, the average chemical removal rate is 0.024 min−1for snowpack
deposition (k3a). This chemical removal can be compared to the total removal rate that
10
is estimated from the steady-state lifetime of N2O5by
k3=1/τN2O5ss. (5)
During these three nights, we find that the total chemical removal rate,k3, of N2O5is
0.18 min−1.
From these results, we find that, on average, about 1/8 of the chemical removal of
15
N2O5 arises from deposition of N2O5 to the surface. The range of k3a is 0.042 to
0.005 min−1 based on the standard deviation of the average deposition velocity. The chemical removal rate, k3a, ranges from none to 1/4 of the chemical removal rate of
N2O5, k3. However, there are a number of reasons that this estimate of the fraction
of N2O5 depositional loss might be larger. First, the calculation of the effective
sur-20
face layer relies upon an unknown flux profile for N2O5and similarity theory. Because boundary layer height is difficult to determine under stable Arctic conditions, (Ander-son and Neff, 2008) an error in the estimation of zeff from the boundary layer height would directly impact the fraction of chemical removal that is due to surface deposition. Second, although the fetch in our experiment satisfies the Oke (1987) criteria, other
ACPD
10, 25329–25354, 2010Deposition of dinitrogen pentoxide,
N2O5
D. M. Huffet al.
Title Page
Abstract Introduction
Conclusions References
Tables Figures
◭ ◮
◭ ◮
Back Close
Full Screen / Esc
Printer-friendly Version
Interactive Discussion
Discussion
P
a
per
|
Dis
cussion
P
a
per
|
Discussion
P
a
per
|
Discussio
n
P
a
per
|
authors (Horst and Weil, 1994; Horst, 1999) indicate that during stable atmospheric conditions, more fetch is required. If the fetch were not sufficient, then the gradient in N2O5 would have not fully developed at the point of measurement and the deposition
velocity would be underestimated. A larger value of deposition velocity would increase the fraction of the chemical removal that is due to the surface deposition. Lastly, it is
5
possible that the system does not completely achieve steady state, in which case the total chemical removal of N2O5 would be overestimated. The majority of these factors
would raise the fraction of chemical removal that is due to deposition to the snowpack, possibly even making it the dominant process for air masses sampled within a few meters of the snowpack.
10
The other possible chemical removal of N2O5is heterogeneous hydrolysis on aerosol particles. Apodaca et al. (2008) found that measured aerosol particle loadings along with reasonable assumptions for reactive uptake of N2O5(γN2O5) were insufficiently fast
to explain the total steady-state removal of N2O5 measured earlier at this same field site. Apodaca et al. (2008) also found chemical removal of N2O5is faster in the
pres-15
ence of ice saturation conditions, which was interpreted as possibly due to reactions on ice particles in the atmosphere or reactions on the snowpack. Reactions on the snow-pack would give the signature of increased chemical removal of N2O5for ice-saturated
airmasses because air that comes in contact with snowpack will become saturated with respect to ice by either sublimation of the snowpack ice or condensation of
super-20
saturated water vapor onto the snowpack. Therefore, the current measurements, which indicate a significant role for snowpack deposition combined with the result that aerosol processes are probably too slow to be a major sink of N2O5and the correlation with ice saturation all appear to point to a significant role for deposition of N2O5 to snowpack
as a major process for air sampled within meters of the snowpack surface. This finding
25
in combination with the fact that the Arctic wintertime conditions are very often stable with hindered vertical mixing indicates that removal process of N2O5 even just tens of
ACPD
10, 25329–25354, 2010Deposition of dinitrogen pentoxide,
N2O5
D. M. Huffet al.
Title Page
Abstract Introduction
Conclusions References
Tables Figures
◭ ◮
◭ ◮
Back Close
Full Screen / Esc
Printer-friendly Version
Interactive Discussion
Discussion
P
a
per
|
Dis
cussion
P
a
per
|
Discussion
P
a
per
|
Discussio
n
P
a
per
|
may act as a reservoir and transport farther than would be indicated by ground-based studies alone. Aircraft, or possibly tethered balloon studies would be able to assess the question of the fate of N2O5aloft and possible role for frozen or unfrozen aerosol
particles in that atmospheric layer.
6 Conclusions 5
The average deposition velocity towards the snowpack surface of N2O5 is
0.59±0.47 cm/s. The calculation of this deposition velocity is dependent upon the
fetch being sufficient for complete development of the near-surface gradient as well as general stability factor corrections, which may act to underestimate the actual de-position velocity. This dede-position velocity parameter can be used in models to help
10
understand the fate of NOx pollution at high latitudes. The deposition velocities along with an assumed flux profile were used to approximate the chemical removal rate aris-ing from deposition and to compare this rate to the total steady state chemical removal rate. In this comparison, we find that deposition to snowpack is responsible for 1/8 of the total removal, and also that the actual fraction of N2O5deposition to snowpack
15
may be more than this estimate. Therefore, we conclude that deposition of N2O5to the
snowpack is a significant and possibly the dominant process for air sampled with a few meters above snowpack. Airmasses aloft may experience slower losses, which would lead to enhanced transport of N2O5aloft as well as an important role for vertical mixing
in the fate of N2O5emitted at high latitudes.
20
Acknowledgements. The authors would like to thank the following people for their assistance: Javier Fochesatto and John Mayfield, Jr. for the set up and use of the sonic anemometers. Thomas Douglas, Matthew Sturm, and Art Galvin for access to the meteorological tower and
portable field hut; Eric Dick for access to the NOxinstrument; and Paul Quist for use of his farm
as a field site. Without the generosity of these people, this study would not have been possible. 25
ACPD
10, 25329–25354, 2010Deposition of dinitrogen pentoxide,
N2O5
D. M. Huffet al.
Title Page
Abstract Introduction
Conclusions References
Tables Figures
◭ ◮
◭ ◮
Back Close
Full Screen / Esc
Printer-friendly Version
Interactive Discussion
Discussion
P
a
per
|
Dis
cussion
P
a
per
|
Discussion
P
a
per
|
Discussio
n
P
a
per
|
Supplementary material related to this article is available online at: http://www.atmos-chem-phys-discuss.net/10/25329/2010/
acpd-10-25329-2010-supplement.pdf.
References
Andersen, H. V. and Hovmand, M. F.: Ammonia and nitric acid dry deposition and throughfall, 5
Water Air Soil Pollut., 85, 2211–2216, doi:10.1007/BF01186162, 1995.
Anderson, P. S. and Neff, W. D.: Boundary layer physics over snow and ice, Atmos. Chem.
Phys., 8, 3563–3582, doi:10.5194/acp-8-3563-2008, 2008.
Apodaca, R. L., Huff, D. M., and Simpson, W. R.: The role of ice in N2O5 heterogeneous
hydrolysis at high latitudes, Atmos. Chem. Phys., 8, 7451–7463, doi:10.5194/acp-8-7451-10
2008, 2008.
Arya, S. P.: Introduction to micrometeorology, second ed., Academic press, 420 pp., 2001.
Ayers, J. D., Apodaca, R. L., Simpson, W. R., and Baer, D. S.: Off-axis cavity ringdown
spec-troscopy: Application to atmospheric nitrate radical detection, Appl. Optics., 44, 7239–7242, 2005.
15
Ayers, J. D. and Simpson, W. R.: Measurements of N2O5near Fairbanks, Alaska, J. Geophys.
Res., 111, D14309, doi:10.1029/2006JD007070, 2006.
Bertram, T. H., Thornton, J. A., Riedel, T. P., Middlebrook, A. M., Bahreini, R., Bates, T. S.,
Quinn, P. K., and Coffman, D. J.: Direct observations of N2O5 reactivity on ambient aerosol
particles, Geophys. Res. Lett., 36, L19803, doi:10.1029/2009gl040248, 2009. 20
Bertram, T. H. and Thornton, J. A.: Toward a general parameterization of N2O5reactivity on
aqueous particles: the competing effects of particle liquid water, nitrate and chloride, Atmos.
Chem. Phys., 9, 8351–8363, doi:10.5194/acp-9-8351-2009, 2009.
Bocquet, F.: Surface layer ozone dynamics and air-snow interactions at summit, greenland spring and summer ozone exchange velocity and snowpack ozone: The complex interac-25
tions, Ph.D., Department of Atmospheric and Oceanic Sciences, University of Colorado, 197 pp., 2007.
atmo-ACPD
10, 25329–25354, 2010Deposition of dinitrogen pentoxide,
N2O5
D. M. Huffet al.
Title Page
Abstract Introduction
Conclusions References
Tables Figures
◭ ◮
◭ ◮
Back Close
Full Screen / Esc
Printer-friendly Version
Interactive Discussion
Discussion
P
a
per
|
Dis
cussion
P
a
per
|
Discussion
P
a
per
|
Discussio
n
P
a
per
|
spheric NO3 and N2O5 via cavity ring-down spectroscopy, Geophys. Res. Lett., 28, 3227,
doi:10.1029/2001GL013303, 2001.
Brown, S. S., Stark, H., Ryerson, T. B., Williams, E. J., Nicks Jr., D. K., Trainer, M., Fehsenfeld, F. C., and Ravishankara, A. R.: Nitrogen oxides in the nocturnal boundary layer:
Simultane-ous in situ measurements of NO3, N2O5, NO2, NO, and O3, J. Geophys. Res., 108, 4299,
5
doi:10.1029/2002jd002917, 2003.
Brown, S. S., Dibb, J. E., Stark, H., Aldener, M., Vozella, M., Whitlow, S., Williams, E. J., Lerner, B. M., Jakoubek, R., Middlebrook, A. M., DeGouw, J. A., Warneke, C., Goldan, P. D., Kuster, W. C., Angevine, W. M., Sueper, D. T., Quinn, P. K., Bates, T. S., Meagher, J. F., Fehsenfeld,
F. C., and Ravishankara, A. R.: Nighttime removal of NOx in the summer marine boundary
10
layer, Geophys. Res. Lett., 31, L07108, doi:10.1029/2004gl019412, 2004.
Brown, S. S., Ryerson, T. B., Wollny, A. G., Brock, C. A., Peltier, R., Sullivan, A. P., Weber, R. J., Dub ´e, W. P., Trainer, M., Meagher, J. F., Fehsenfeld, F. C., and Ravishankara, A. R.: Variability in nocturnal nitrogen oxide processing and its role in regional air quality, Science, 5757, 67–70, doi:10.1126/science.1120120, 2006.
15
Brown, S. S., Dub ´e, W. P., Osthoff, H. D., Wolfe, D. E., Angevine, W. M., and Ravishankara, A.
R.: High resolution vertical distributions of NO3 and N2O5 through the nocturnal boundary
layer, Atmos. Chem. Phys., 7, 139–149, doi:10.5194/acp-7-139-2007, 2007a.
Brown, S. S., Dub ´e, W. P., Osthoff, H. D., Stutz, J., Ryerson, T. B., Wollny, A. G., Brock, C.
A., Warneke, C., de Gouw, J. A., Atlas, E., Neuman, J. A., Holloway, J. S., Lerner, B. M., 20
Williams, E. J., Kuster, W. C., Goldan, P. D., Angevine, W. M., Trainer, M., Fehsenfeld, F.
C., and Ravishankara, A. R.: Vertical profiles in NO3and N2O5 measured from an aircraft:
Results from the NOAA P-3 and surface platforms during the New England air quality study 2004, J. Geophys. Res., 112, D22304, doi:10.1029/2007jd008883, 2007b.
Bytnerowicz, A., Percy, K., Riechers, G., Padgett, P., and Krywult, M.: Nitric acid vapor 25
effects on forest trees – deposition and cuticular changes, Chemosphere, 36, 697–702,
doi:10.1016/S0045-6535(97)10110-2, 1998.
Cadle, S. H., Dasch, J. M., and Mulawa, P. A.: Atmospheric concentrations and the deposition velocity to snow of nitric acid, sulfur dioxide and various particulate species, Atmos. Environ., 19, 1819–1827, doi:10.1016/0004-6981(85)90008-3, 1985.
30
Dentener, F. J. and Crutzen, P. J.: Reaction of N2O5 on tropospheric aerosols: Impact
on the global distributions of NOx, O3, and OH, J. Geophys. Res., 98, 7149–7163,
ACPD
10, 25329–25354, 2010Deposition of dinitrogen pentoxide,
N2O5
D. M. Huffet al.
Title Page
Abstract Introduction
Conclusions References
Tables Figures
◭ ◮
◭ ◮
Back Close
Full Screen / Esc
Printer-friendly Version
Interactive Discussion
Discussion
P
a
per
|
Dis
cussion
P
a
per
|
Discussion
P
a
per
|
Discussio
n
P
a
per
|
Evans, M. J. and Jacob, D. J.: Impact of new laboratory studies of N2O5 hydrolysis on global
model budgets of tropospheric nitrogen oxides, ozone and oh, Geophys. Res. Lett., 32, L09813, doi:10.1029/2005GL022469, 2005.
Fenn, M. E., Baron, J. S., Allen, E. B., Rueth, H. M., Nydick, K. R., Geiser, L., Bowman, W.
D., Sickman, J. O., Meixner, T., Johnson, D. W., and Neitlich, P.: Ecological effects of
ni-5
trogen deposition in the western united states, BioScience, 53, 404–420, doi:10.1641/0006-3568(2003)053[0404:EEONDI]2.0.CO;2, 2003.
Geyer, A. and Stutz, J.: Vertical profiles of NO3, N2O5, O3, and NOx in the nocturnal bound-ary layer: 2. Model studies on the altitude dependence of composition and chemistry, J. Geophys. Res., 109, D12307, doi:10.1029/2003jd004211, 2004.
10
Hanson, D. R. and Ravishankara, A. R.: The reaction probabilities of ClONO2 and N2O5 on
40 to 75% sulfuric acid solutions, J. Geophys. Res., 96, 5081–5090, doi:10.1029/91jd01750, 1991.
Helmig, D., Ganzeveld, L., Butler, T., and Oltmans, S. J.: The role of ozone atmosphere-snow gas exchange on polar, boundary-layer tropospheric ozone – a review and sensitivity analy-15
sis, Atmos. Chem. Phys., 7, 15–30, doi:10.5194/acp-7-15-2007, 2007.
Helmig, D., Cohen, L. D., Bocquet, F., Oltmans, S., Grachev, A., and Neff, W.: Spring and
sum-mertime diurnal surface ozone fluxes over the polar snow at summit, greenland, Geophys. Res. Lett., 36, L08809, doi:10.1029/2008gl036549, 2009.
Huff, D. M.: Investigating the role of ice and N2O5heterogeneous hydrolysis under high latitude 20
conditions. Ph.D. thesis, University of Alaska Fairbanks, in preparation, 2010.
Honrath, R. E., Lu, Y., Peterson, M. C., Dibb, J. E., Arsenault, M. A., Cullen, N. J., and Steffen,
K.: Vertical fluxes of NOx, HONO, and HNO3 above the snowpack at summit, Greenland,
Atmos. Environ., 36, 2629–2640, doi:10.1016/S1352-2310(02)00132-2, 2002.
Horst, T. W. and Weil, J. C.: How far is far enough: The fetch requirements for micrometeoro-25
logical measurement of surface fluxes, J. Atmos. Ocean. Techn., 11, 1018–1025, 1994. Horst, T. W.: The footprint for estimation of atmosphere-surface exchange fluxes by profile
techniques, Bound.-Lay. Meteorol., 90, 171–188, doi:10.1023/A:1001774726067 1999.
Jones, A. E., Weller, R., Anderson, P. S., Jacobi, H., W, Wolff, E. W., Schrems, O., and Miller,
H.: Measurements of NOx emissions from the antarctic snowpack, Geophys. Res. Lett., 28,
30
1499–1502, doi:10.1029/2000gl011956, 2001.
Kirchner, W., Welter, F., Bongartz, A., Kames, J., Schweighoefer, S., and Schurath, U.: Trace
ACPD
10, 25329–25354, 2010Deposition of dinitrogen pentoxide,
N2O5
D. M. Huffet al.
Title Page
Abstract Introduction
Conclusions References
Tables Figures
◭ ◮
◭ ◮
Back Close
Full Screen / Esc
Printer-friendly Version
Interactive Discussion
Discussion
P
a
per
|
Dis
cussion
P
a
per
|
Discussion
P
a
per
|
Discussio
n
P
a
per
|
J. Atmos. Chem., 10, 427–449, doi:10.1007/bf00115784, 1990.
Lovett, G. M.: Atmospheric deposition of nutrients and pollutants in North America: An ecolog-ical perspective, Ecol. Appl., 4, 630–650, doi:10.2307/1941997, 1994.
Matsumoto, J., Imai, H., Kosugi, N., and Kajii, Y.: In situ measurement of N2O5in the urban
at-mosphere by thermal decomposition/laser-induced fluorescence technique, Atmos. Environ., 5
39, 6802–6811, doi:10.1016/j.atmosenv.2005.07.055 2005.
Monteith, J. L. and Unsworth, M. H.: Principles of environmental physics, second ed., 291 pp., Edward Arnold, 1990.
Mozurkewich, M. and Calvert, J. G.: Reaction probability of N2O5 on aqueous aerosols, J.
Geophys. Res., 93, 15889–15896, doi:10.1029/JD093iD12p15889, 1988. 10
Muller, J. B. A., Coyle, M., Fowler, D., Gallagher, M. W., Nemitz, E. G., and Percival, C. J.: Comparison of ozone fluxes over grassland by gradient and eddy covariance technique, Atmos. Sci. Lett., 10, 164–169, 2009.
Nieuwstadt, F. T. M.: The turbulent structure of the stable, nocturnal boundary layer, J. Atmos.
Sci., 41, 2202–2216, doi:10.1175/1520-0469(1984)041<2202:TTSOTS>2.0.CO;2, 1984.
15
Oke, T. R.: Boundary layer climates, 2nd ed., Methuen, London, 435 pp.,1987.
Pardyjak, E. R., Monti, P., and Fernando, H. J. S.: Flux richardson number
measurements in stable atmospheric shear flows, J. Fluid Mech., 459, 307–316, doi:10.1017/S0022112002008406, 2002.
Riemer, N., Vogel, H., Vogel, B., Schell, B., Ackermann, I., Kessler, C., and Hass, H.: Im-20
pact of the heterogeneous hydrolysis of N2O5 on chemistry and nitrate aerosol formation
in the lower troposphere under photosmog conditions, J. Geophys. Res., 108(D4), 4144, doi:10.1029/2002jd002436, 2003.
Roberts, J. M., Osthoff, H. D., Brown, S. S., and Ravishankara, A. R.: N2O5oxidizes chloride to
Cl2in acidic atmospheric aerosol, Science, 321, 1059, doi:10.1126/science.1158777, 2008.
25
Simpson, W. R.: Continuous wave cavity ring-down spectroscopy applied to in-situ detection of
dinitrogen pentoxide (N2O5), Rev. Sci. Inst, 74, 3442–3452, 2003.
Sommariva, R., Osthoff, H. D., Brown, S. S., Bates, T. S., Baynard, T., Coffman, D., de Gouw,
J. A., Goldan, P. D., Kuster, W. C., Lerner, B. M., Stark, H., Warneke, C., Williams, E. J., Fehsenfeld, F. C., Ravishankara, A. R., and Trainer, M.: Radicals in the marine boundary 30
layer during NEAQS 2004: a model study of day-time and night-time sources and sinks, Atmos. Chem. Phys., 9, 3075–3093, doi:10.5194/acp-9-3075-2009, 2009.
ACPD
10, 25329–25354, 2010Deposition of dinitrogen pentoxide,
N2O5
D. M. Huffet al.
Title Page
Abstract Introduction
Conclusions References
Tables Figures
◭ ◮
◭ ◮
Back Close
Full Screen / Esc
Printer-friendly Version
Interactive Discussion
Discussion
P
a
per
|
Dis
cussion
P
a
per
|
Discussion
P
a
per
|
Discussio
n
P
a
per
|
666 pp.,1988.
Stutz, J., Alicke, B., Ackermann, R., Geyer, A., White, A., and Williams, E.: Vertical profiles of
NO3, N2O5, O3, and NOxin the nocturnal boundary layer: 1. Observations during the Texas
air quality study 2000, J. Geophys. Res., 109, D12306, doi:10.1029/2003JD004209, 2004. Thornton, J. A., Kercher, J. P., Riedel, T. P., Wagner, N. L., Cozic, J., Holloway, J. S., Dub ´e, W. 5
P., Wolfe, G. M., Quinn, P. K., Middlebrook, A. M., Alexander, B., and Brown, S. S.: A large atomic chlorine source inferred from mid-continental reactive nitrogen chemistry, Nature, 464, 271–274, doi:10.1038/nature08905, 2009.
Van Doren, J. M., Watson, L. R., Davidovits, P., Worsnop, D. R., Zahniser, M. S., and Kolb, C. E.: Uptake of dinitrogen pentoxide and nitric acid by aqueous sulfuric acid droplets, J. Phys. 10
Chem., 95, 1684–1689, doi:10.1021/j100157a037, 1991.
Watt, S. A., Wagner-Riddle, C., Edwards, G., and Vet, R. J.: Evaluating a flux-gradient approach for flux and deposition velocity of nitrogen dioxide over short-grass surfaces, Atmos. Environ., 38, 2619–2626, doi:10.1016/j.atmosenv.2004.02.021, 2004.
Wesely, M. L. and Hicks, B. B.: A review of the current status of knowledge on dry deposition, 15
Atmos. Environ., 34, 2261–2282, doi:10.1016/j.atmosenv.2004.02.021, 2000.
Wood, E. C., Bertram, T. H., Wooldridge, P. J., and Cohen, R. C.: Measurements of N2O5, NO2,
and O3east of the San Francisco Bay, Atmos. Chem. Phys., 5, 483–491,
ACPD
10, 25329–25354, 2010Deposition of dinitrogen pentoxide,
N2O5
D. M. Huffet al.
Title Page
Abstract Introduction
Conclusions References
Tables Figures
◭ ◮
◭ ◮
Back Close
Full Screen / Esc
Printer-friendly Version
Interactive Discussion
Discussion
P
a
per
|
Dis
cussion
P
a
per
|
Discussion
P
a
per
|
Discussio
n
P
a
per
|
Fig. 1.Field site location:(A)contour map of field site with a black outline of the field site area.
(B)Expanded satellite image of the inside of the black box area on map A. The black arrows
ACPD
10, 25329–25354, 2010Deposition of dinitrogen pentoxide,
N2O5
D. M. Huffet al.
Title Page
Abstract Introduction
Conclusions References
Tables Figures
◭ ◮
◭ ◮
Back Close
Full Screen / Esc
Printer-friendly Version
Interactive Discussion
Discussion
P
a
per
|
Dis
cussion
P
a
per
|
Discussion
P
a
per
|
Discussio
n
P
a
per
|
Fig. 2. (I) The plan view and orientation of the two measurement towers and instrument hut.
ACPD
10, 25329–25354, 2010Deposition of dinitrogen pentoxide,
N2O5
D. M. Huffet al.
Title Page
Abstract Introduction
Conclusions References
Tables Figures
◭ ◮
◭ ◮
Back Close
Full Screen / Esc
Printer-friendly Version
Interactive Discussion
Discussion
P
a
per
|
Dis
cussion
P
a
per
|
Discussion
P
a
per
|
Discussio
n
P
a
per
|
Fig. 3. Temperature (◦C), wind speed (m/s), Richardson number and mixing ratio of N2O5 in
pptv for(A)5 November 2009, (B)10 November 2009 and(C)11 November 2009. The red
ACPD
10, 25329–25354, 2010Deposition of dinitrogen pentoxide,
N2O5
D. M. Huffet al.
Title Page
Abstract Introduction
Conclusions References
Tables Figures
◭ ◮
◭ ◮
Back Close
Full Screen / Esc
Printer-friendly Version
Interactive Discussion
Discussion
P
a
per
|
Dis
cussion
P
a
per
|
Discussion
P
a
per
|
Discussio
n
P
a
per
|
Fig. 4.Histogram showing the distribution of deposition velocities of N2O5on the selected data
ACPD
10, 25329–25354, 2010Deposition of dinitrogen pentoxide,
N2O5
D. M. Huffet al.
Title Page
Abstract Introduction
Conclusions References
Tables Figures
◭ ◮
◭ ◮
Back Close
Full Screen / Esc
Printer-friendly Version
Interactive Discussion
Discussion
P
a
per
|
Dis
cussion
P
a
per
|
Discussion
P
a
per
|
Discussio
n
P
a
per
|
Fig. 5. From top to bottom are the mixing ratios of NO2 (ppbv), O3 (ppbv) and N2O5 (pptv),