www.biogeosciences.net/5/11/2008/ © Author(s) 2008. This work is licensed under a Creative Commons License.
Biogeosciences
Ocean biogeochemistry exhibits contrasting responses to a large
scale reduction in dust deposition
A. Tagliabue1, L. Bopp1, and O. Aumont2
1Laboratoire des Sciences du Climat et de l’Environnement, IPSL-CNRS-CEA-UVSQ Orme des Merisiers, Bat 712,
CEA/Saclay, 91198 Gif sur Yvette, France
2Laboratoire d’Oc´eanographie et Climatologie: Exp´erimentation et Approches Num´eriques, IRD/IPSL, Plouzan´e, France
Received: 12 July 2007 – Published in Biogeosciences Discuss.: 2 August 2007
Revised: 13 November 2007 – Accepted: 5 December 2007 – Published: 11 January 2008
Abstract. Dust deposition of iron is thought to be an im-portant control on ocean biogeochemistry and air-sea CO2
exchange. In this study, we examine the impact of a large scale, yet climatically realistic, reduction in the aeolian Fe in-put during a 240 year transient simulation. In contrast to pre-vious studies, we find that the ocean biogeochemical cycles of carbon and nitrogen are relatively insensitive (globally) to a 60% reduction in Fe input from dust. Net primary produc-tivity (NPP) is reduced in the Fe limited regions, but the ex-cess macronutrients that result are able to fuel additional NPP elsewhere. Overall, NPP and air-sea CO2exchange are only
reduced by around 3% between 1860 and 2100. While the nitrogen cycle is perturbed more significantly (by∼15%), reduced N2fixation is balanced by a concomitant decline in
denitrification. Feedbacks between N2fixation and
denitri-fication are controlled by variability in surface utilization of inorganic nitrogen and subsurface oxygen consumption, as well as the direct influence of Fe on N2 fixation. Overall,
there is relatively little impact of reduced aeolian Fe input (<4%) on cumulative CO2fluxes over 240 years. The lower
sensitivity of our model to changes in dust input is primar-ily due to the more detailed representation of the continental shelf Fe, which was absent in previous models.
1 Introduction
The necessary nutrients for phytoplankton growth, including nitrogen (N), phosphorous (P), silica (Si), and iron (Fe), can be supplied to ocean surface waters via the aeolian deposition of mineral aerosols (Duce et al., 1991). Of these, Fe has re-ceived particular interest, due to its potential to influence the cycle of carbon (C) in climatically significant regions of the worlds oceans (Jickells et al., 2005). Total dust inputs to the Correspondence to:A. Tagliabue
ocean are on the order of 450 Tg yr−1(Ginoux et al., 2001;
Mahowald and Luo, 2003; Tegen et al., 2004) and usually contain around 3.5% Fe, with a solubility that can be highly variable (e.g., Jickells and Spokes, 2001). Phytoplankton are limited by Fe in the “high nutrient, low chlorophyll” (HNLC) ocean regions, such as the Southern Ocean (Boyd et al., 2000), Equatorial Pacific (Coale et al., 1996) and Sub Arctic Pacific (Boyd et al., 2004) and elevated oceanic dust deposi-tion to the Southern Ocean might drive Glacial-Inter Glacial atmospheric CO2 variability (Martin, 1990). Oceanic dust
deposition has likely declined from the pre industrial (PI) to the present day (Mahowald et al., 2006). Predictions of fu-ture deposition are model dependent and will be controlled by land use changes, as well as climate effects (Tegen et al., 2004; Mahowald et al., 2006; Mahowald, 2007). Processes that impact sources areas and dust loading, such as CO2
fer-tilization, have the potential to drive dramatic reductions in oceanic dust deposition over the coming century (Mahowald et al., 2006).
Variability in the atmospheric deposition of Fe can sig-nificantly impact C biogeochemistry. Phytoplankton require Fe for a variety of photosynthetic and respiratory enzymes (Falkowski et al., 1998; Raven, 1990) and changes in ex-ogenous Fe supply will therefore directly impact net primary production (NPP) and the fixation of inorganic C. Moreover, the amount of Fe that is required to fix a given quantity of C is greater under low irradiance (Sunda and Huntsman, 1997; Raven, 1990) and nitrate (NO3)based growth (Raven, 1990),
as well as for large phytoplankton functional groups (Tim-mermans et al., 2004). Accordingly, all HNLC mesoscale Fe addition experiments have elicited increases in large di-atoms, which can efficiently export fixed C to depth, and are more efficient (per unit Fe added) in shallow mixed layers (De Baar et al., 2005; Tagliabue and Arrigo, 2006). Atmo-spheric pCO2 might increase dramatically (via a decline in
both NPP and air to sea CO2 transfer) if the aeolian input
(Moore et al., 2006; Parekh et al., 2006), although other stud-ies show a much lower sensitivity (Bopp et al., 2003).
Aside from its direct impact on C fixation, the aeolian in-put of Fe can also influence the biogeochemistry of N. Ni-trogenase, the enzyme responsible for fixation of dinitrogen (N2)by phytoplankton, has a large Fe requirement (Rueter et
al., 1992) and this has led to speculation that N fixation might be regulated by Fe and sensitive to variability in aeolian in-puts (Falkowski, 1997; Moore and Doney, 2007). As such, increased N2fixation can elevate surface dissolved inorganic
N (DIN) concentrations, potentially increasing overall NPP and the uptake of CO2from the atmosphere (Falkowski et al.,
1997; Michaels et al., 2001; Moore and Doney, 2007). That said, it is also important to consider how changes in Fe depo-sition might impact processes that govern the losses of DIN. During denitrification, bacteria utilize NO3, as an alternative
electron acceptor for remineralization under low oxygen con-ditions. N2fixation and denitrification are therefore coupled
by their generation and consumption of DIN and analyses of both models and observations have suggested a balanced, or homeostatic, DIN inventory (Redfield, 1934; Gruber and Sarmiento, 1997; Tyrrell, 1999; Gruber, 2004; Deutsch et al., 2007). Nevertheless, this concept remains controversial (see: Codispoti, 2007) and, with particular reference to dust, Fe has been proposed to be an agent that can unbalance the N cycle (Moore and Doney, 2007).
In this study we use the Pelagic Integration Scheme for Carbon and Ecosystem studies (PISCES) global ocean-biogeochemistry model (Aumont and Bopp, 2006) to exam-ine the response of ocean biogeochemistry to a reduction in aeolian Fe input during a transient simulation from 1860 to 2100. We use climatically realistic projections from Ma-howald et al. (2006) (rather than arbitrary changes) to inves-tigate the biogeochemical consequences of such an extreme change. Previously, models using either simple ecosystem dynamics or performing short term simulations have shown a high sensitivity to changes in dust deposition (Dutkiewicz et al., 2005; Parekh et al., 2006; Moore et al., 2006). In con-trast, we find that the biogeochemical cycles of C and N are actually relatively insensitive (globally) to a massive reduc-tion in dust input during a transient simulareduc-tion from 1860 to 2100. While N2 fixation is more significantly impacted by
reduced dust inputs, it is also accompanied by a concomi-tant decline in denitrification, which stabilizes ocean DIN inventories. The disparity in model results is discussed in terms of inter-model differences in the ocean Fe cycle and the timescales over which the particular study is evaluated.
2 Methods
2.1 The PISCES model
The PISCES ocean-biogeochemistry model is extensively described in Aumont and Bopp (2006) and includes two
phytoplankton functional groups (nanophytoplankton and di-atoms), meso- and micro-zooplankton, 2 detrital size classes for particulate organic carbon (POC), calcium carbonate, sili-cic acid (Si(OH)4), DIC, biogenic Si, dissolved organic C,
NO3, phosphate (PO4), Silicic acid (Si(OH)4), ammonium
(NH4), and Fe. Here we describe the parameterizations
rele-vant for this study.
2.2 Net primary production, species composition and gas exchange
In order to calculate net primary productivity (NPP) we first calculate a maximum phytoplankton specific growth rate (µmax)for each phytoplankton functional type (PFT) that is
a function of temperature. µmaxis then scaled by the
prod-uct of the most limiting nutrient (assuming Michaelis Menten kinetics) and the light (using the initial slope of the P-E rela-tionship, including photoadaptation) limitation terms to pro-duce the realized specific growth rate (µ), and C fixation rate of each PFT. The half saturation constant for growth (Kµ)is fixed for all nutrients except Fe, where it varies as a function of biomass (taken as a proxy for cell size). The uptake of NO3and PO4that accompanies NPP is calculated assuming
fixed Redfield ratios (C/N=122/16 and C/P=122/1). On the other hand, the Fe/C ratio increases as light declines and de-creases with Fe stress, while Si/C dede-creases as light inde-creases and also permits lighter silicification if Si(OH)4
concentra-tions decline.
Each PFT has certain specific physiological characteris-tics that will govern their response to our imposed changes in aeolian Fe deposition. Diatoms are assumed to have a re-quirement for Si(OH)4(no such requirement for
nanophyto-plankton) and a higher Kµ(relative to nanophytoplankton) for NH4, PO4, and Fe, but a lower Kµ for NO3 Diatoms
also have a greater maximum and minimum C-specific Fe de-mand and KµFe than nanophytoplankton. Finally, nanophy-toplankton support a more regenerative food web, producing small particles and being preferentially grazed by microzoo-plankton. In contrast, mesozooplankton have a preference for diatoms and microzooplankton grazing of diatoms is zero when their biomass is greater than 0.5µmol C l−1. Diatoms also produce large, rapidly sinking particles.
The air-sea exchange of CO2(aq)follows the OCMIP
pro-tocols and is a function of the air-sea pCO2 gradient,
tem-perature, ice-cover, and the piston velocity. We represent the wind speed dependence of the piston velocity via a quadratic function of the wind speed at 10 m (Wanninkhof, 1992).
Free inorganic Fe can be converted to particulate species by scavenging onto particles. Atmospheric deposition of Fe as-sumes that Fe is 3.5% of dust, with a solubility of 0.5% and includes subsurface dissolution of dust particles. Additional sources of Fe are sediment resuspension, which includes a representation of continental shelf supply that is usually ig-nored by global models (Aumont and Bopp, 2006), as well as riverine supply (hydrothermal sources are not represented in PISCES). For reference, the annual integrated aeolian and sediment sources of Fe are shown in Fig. 1a and b.
The fundamentals of the PISCES Fe cycle processes remain the same as previously detailed in Aumont and Bopp (2006). The greater overall dust deposition in the newer fields of Mahowald et al. (2006) necessitated a re-duction in the solubility of Fe from 1 to 0.5%, which is at the low end of previously published models (usually around 1%, e.g., Dutkiewicz et al., 2005; Moore and Doney, 2007) and the observations of up to 20 or 30% (e.g., Jickells and Spokes, 2001), in order to retain realistic distributions of NPP and biogeochemical tracers. On the other hand, a recent study (Sedwick et al., 2007) found the solubility of Saharan and anthropogenic aerosols to be 0.44 and 19%, respectively, which suggests 0.5% to be not completely unreasonable. We calculated correlation coefficients (R, after log transforma-tion) and the root mean squared error (RMSE) between the modeled and observed dFe at depths of 0 to 50 m, 100 to 300 m and 2000 to 3000 m. In surface waters, monthly cal-culations yield values forRthat range between 0.41 (in Oc-tober) and 0.79 (in August), with a mean of 0.61. Ten months are statistically significant at thep<0.01 level, while Decem-ber is significant at 0.01>p<0.05 and February not signifi-cant due to the paucity of data (R=0.62, but there are only 6 observations). In subsurface and deep waters,Ris 0.63 and 0.77 between 100 and 300 m and 2000 and 3000 m, respec-tively. RMSE values are 0.47, 0.35 and 0.3 for 0 to 50 m, 100 to 300 m and 2000 to 3000 m, respectively. For comparison, Moore and Braucher (2007) reportR and RMSE values of 0.598 and 0.443, and 0.602 and 0.338 for depth ranges of 0 to 103 m and 103 to 502 m, respectively.
2.3 Nitrogen cycling in PISCES
The uptake of DIN by phytoplankton and subsequent rem-ineralization of organic matter to DIN is described in Au-mont and Bopp (2006), here we concentrate on describing N2
fixation and denitrification. In previous versions of PISCES (e.g., Aumont and Bopp, 2006), N2fixation was artificially
linked to the annual rate of dentrification and were therefore explicitly coupled. This linkage is not present in the current study.
Marine N2 fixation is carried out by numerous
plank-tonic organisms, including the oft mentioned Trichodesmium sp., as well as a variety of unicellular diazotrophes, crocco-sphera and diatom endosymbionts (see: Mahaffey et al., 2005 and references therein). Given this taxonomic diversity and
-100 -80 -60 -40 -20 0 20
Percentage change in annual Fe deposition (between 2000 and 2100) Fe supply from dust in 2000 (mg Fe m-2 yr-1)
Fe supply from shelves (mg Fe m-2 yr-1)
60°N
0°
60°S 60°N
0°
60°S 60°N
0°
60°S
60°E 120°E 180° 120°W 60°W 0° 60°E
25
15
5
4
2 3
1
0
100
60
20 15 10 5
4
3
2
1
0
(a)
(b)
(c)
Fig. 1.The annual supply of Fe to the ocean in 2000 from(a)dust,
(b)continental shelves and(c)the percentage change in the oceanic Fe deposition from the atmosphere between 2000 and 2100.
the associated physiological variability, we decided not to prognostically simulate a N2fixing plankton functional type
(PFT) within PISCES. Instead, we chose to include N2
fix-ation as a process that produces NH4 under certain
condi-tions (Aumont and Bopp, 2006). Specifically, N2 fixation
is a function of the growth rate of the nanophytoplankton function group and only occurs in surface waters that have a temperature warmer than, or equal to, 20◦C. This maxi-mum potential rate of N2fixation is then scaled by the
limi-tation term for Fe and one minus the limilimi-tation term for DIN (NO3and NH4). Therefore, the realized rate of N2fixation
Denitrification occurs in suboxic waters and results in NO3
instead of O2 being consumed during the remineralization
of organic matter. In PISCES, we restrict denitrification to waters whose O2concentration is below 8µM (Lipshultz et
al., 2000) and set the N/C stiochiometric ratio for denitrifica-tion to be 0.8 mol : mol (Middelburg et al., 1996; Soetaert et al., 2000). Finally, we also include the bacterial conversion of NH4to NO3via nitrification, which occurs in oxic waters
and is inhibited by light.
Despite our relatively simple parameterization scheme, denitrification and N2 fixation are implicitly coupled in
PISCES. Although we do not include a diazotrophic PFT in PISCES, we do include the main role of N2 fixation in
supplying NH4under certain conditions. The absence of an
explicit PFT might be important if diazotrophes are signifi-cantly different in their sinking and remineralization charac-teristics, or food web structure; all of which are currently dif-ficult to generalize for use in a global model. This approach also assumes that N2 fixers exhibit the same physiology as
the nanophytoplankton PFT. Variability in denitrification will alter DIN concentrations which will, in turn, impact the rate of N2fixation. While on the other hand, changes in export
production (mediated by N2fixation and/or Fe and other
nu-trients) will modify subsurface O2 concentrations and thus
denitrification rates. This approach also allows the long spin up and simulation periods to be conducted with a relatively low computational cost.
2.4 Physical model
The physical model coupled to PISCES is based on the ORCA2 global configuration of OPA version 8.2 (Madec et al., 1998), including a dynamic-thermodynamic sea ice model (Timmermann et al., 2003). The mean horizontal resolution is approximately 2◦ by 2◦ cos latitude and the meridional resolution is enhanced to 0.5◦ at the equator. The model has 30 vertical levels, with an increment that in-creases from 10 m at the surface to 500m at depth (12 lev-els are located in the first 125 m). Our standard physical model employs climatological atmospheric forcing from var-ious datasets. These include NCEP/NCAR 2m atmospheric temperature (averaged between 1948 and 2003) and relative humidity, ISCCP total cloudiness (averaged between 1983 and 2001), CMAP precipitation (averaged between 1979 and 2001), weekly wind stress based on ERS and TAO observa-tions and creates a representation of ocean circulation/mixing that is constrained by observations. Please see Aumont and Bopp (2006) for more details and the associated references. 2.5 Experimental design
After spinning up the model for over 3000 years under preindustrial conditions, we ran PISCES for a 240 year pe-riod from 1860 to 2100 with a specified atmospheric pCO2
that is constrained by observations between 1860 and 2000
(Keeling et al., 2001) and the A2 scenario from 2000 to 2100 (Nakicenovic and Swart, 2000). A recent study by Mahowald et al. (2006) used the National Center for At-mospheric Research’s Community Climate System Model (NCAR-CCSM) to investigate the change in mineral aerosols in response to climate and predict pre industrial, current, and future dust sources, as well as oceanic deposition. We lin-early interpolated the aeolian Fe supply to the ocean between the pre industrial (1860), current (taken to be 2000) and dou-bled CO2(taken as 2100) fields of Mahowald et al. (2006),
and assume Fe to be 3.5% of dust, with a solubility of 0.5%. Only the atmospheric CO2concentration and dust deposition
change during our scenario (all other forcings remain con-stant). We also ran a control experiment from 1860 to 2100 that was forced by the annually changing atmospheric pCO2
concentrations, but constant PI dust deposition. Finally, we use the year 2000 as a reference, as it represents ‘modern’ dust deposition.
3 Results and discussion
3.1 Changes in aeolian Fe input in 2100
The predicted reduction in aeolian Fe input in 2100 (rel-ative to 2000) is spatially heterogenous and results from changes in sources area and dust loading (see: Mahowald et al., 2006). The largest percentage reductions in aeolian Fe input are found throughout the sub-Antarctic Southern Ocean, specifically to the south of Australia, Patagonia and, to a lesser degree, South Africa (Fig. 1). In the remaining HNLC regions (the sub-Arctic and Equatorial Pacific) there are slightly lesser, but still significant, reductions in Fe de-position (Fig. 1). It is noteworthy that the locations where a proportionally high reduction in dust is predicted are all HNLC regions of relatively high NPP. Aside from that, there are also large absolute reductions in Fe deposition in the Northern Subtropical Atlantic Ocean (Fig. 1). The decline in dust deposition is due to the predicted decline in future dust loading that results from climate induced changes in precip-itation, temperature and cloudiness, as well as CO2
0 50 100 150 200 250 350 450
Annual NPP in 2000 (gC m-2 yr-1)
60°N
0°
60°S
-70 -50 -30 -10 10 30 50 70
Annual air-sea CO2 exchange in 2000 (gC m-2 yr-1)
60°N
0°
60°S
60°E 120°E 180° 120°W 60°W 0° 60°E
0 0.4 0.8 1.2 1.6 2
0 5 10 15 20 25 30
0 0.5 1 5 10 Annual N2 fixation in 2000 (gN m-2 yr-1) Annual NO3 in 2000 (µM)
Annual Fe in 2000 (nM) 0
2 4 6 8 10 15 20 25
Annual Denitrification in 2000 (gN m-2 yr-1)
60°E 120°E 180° 120°W 60°W 0° 60°E 60°E 120°E 180° 120°W 60°W 0° 60°E
(a)
(b)
(d)
(c)
(e)
(f)
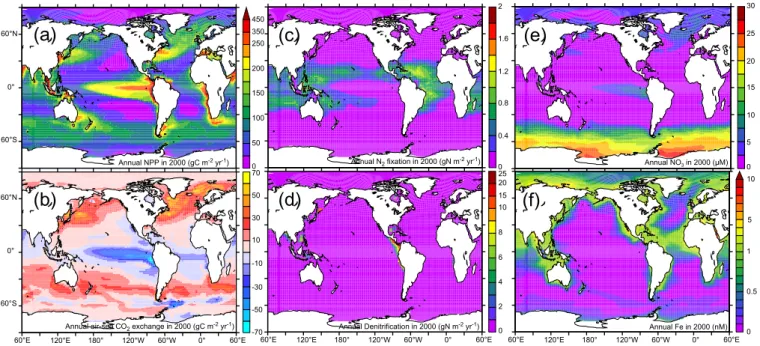
Fig. 2.The annual rate of(a)NPP (gC m−2yr-1),(b)air-sea CO2exchange (gC m−2yr−1),(c)N2fixation (gN m−2yr−1),(d) denitrifica-tion (gN m−2yr−1)in 2000 and surface concentrations of(e)NO3(µM) and(f)Fe (nM) in 2000.
3.2 Impact on NPP
Despite an overall reduction of 60% in aeolian Fe input, we find little impact upon global NPP by 2100. At the beginning of our experiments (1860), annual NPP is 35.8 Pg C yr−1
and declines to 35.3 and 34.6 Pg C yr−1by 2000 and 2100,
respectively (Table 1). This represents a decline of only 3.3% (1.2 Pg C) or 1.8% (0.7 Pg C) between 1860 and 2100 or 2000 and 2100, respectively (Table 1). As expected, NPP is re-duced in the HNLC regions that are impacted by the rere-duced aeolian Fe input, such as the Atlantic sector of the South-ern Ocean (ATL-SO, by 15 to 30 gC m−2), the Sub Arctic Pacific (SAPac, by 5 to 15 gC m−2)and the Equatorial Pa-cific (EqPac, by 5 to 30 gC m−2)(Figs. 1, 2a, 3a, between 2000 and 2100). Nevertheless, the overall reductions in NPP are only slight (especially in the Sub Arctic Pacific and the Antarctic sector of the Southern Ocean) and suggest that aeo-lian Fe input is only important in regions directly adjacent to dust sources. This is probably because the continental shelf is the hypothesized to be the principal source of Fe to the mixed layer in the large majority of HNLC waters (Tyrrell et al., 2005; Blain et al., 2007; Aumont et al., 2008).
The spatial re-organization in NPP that follows the reduc-tion in aeolian Fe input is responsible for the small change in global NPP that results. The decline in ATL-SO NPP (Fig. 3a) reduces the utilization of macronutrients (such as NO3)and an excess therefore remains in surface waters (up
to 2µM between 2000 and 2100, Fig. 4a). These excess nu-trients are now able to enter mode waters (especially in the ATL-SO, Fig. 4d) and fuel additional NPP in the
macronu-trient limited low latitudes (Fig. 3a) (Aumont et al., 2003; Sarmiento et al., 2004a; Aumont and Bopp, 2006). A sim-ilar mechanism also occurs in the EqPac, where the de-cline in eastern tropical Pacific (ETP) NPP and NO3
uti-lization is balanced by elevated NPP in the western tropi-cal Pacific (WTP) (Fig. 3a) as the unused upwelled nutrients flow westward (Dutkiewicz et al., 2005). This highlights the dynamic nature of the global ocean system, whereby changes in local nutrient utilization can have far field ram-ifications (Sarmiento et al., 2004a; Dutkiewicz et al., 2005; Aumont and Bopp, 2006). Overall, the net effect of this re-organization of NPP is a slight decline in globally integrated NPP (Table 1), despite the greatly reduced dust inputs. 3.3 Species composition and nutrients
Table 1.The impact of the simulated change in aeolian Fe deposition (Fe Dep, Tg Fe yr−1)on globally integrated NPP (NPP, Pg C yr−1), N2fixation (N2Fix, Tg N yr−1), denitrification (Denitr, Tg N yr−1), the air-sea CO2 exchange (FCO2, Pg C yr−1), and export production
(Ex P, Pg C yr−1)at three time points. The number in parenthesis is the percentage change relative to a control run, at the same point in time, which includes the change in atmospheric pCO2, but assumes pre industrial (i.e. 1860) dust deposition.
Year Fe Dep NPP N2Fix Denitr FCO2a Ex Pb
1860 0.25 35.8 81.7 39.4 −0.1 8.3
2000 0.16 (−38) 35.3 (−1.5) 75.7 (−7.4) 36.1 (−8.5) 1.9 (−5.5) 8.1 (−2.1) 2100 0.06 (−60) 34.6 (−3.3) 67.8 (−17.0) 34.4 (−12.7) 6.2 (−3.4) 7.8 (−5.1)
aFor FCO
2, a positive value denotes ocean uptake of atmospheric CO2and a negative percentage change therefore represents a reduction in
ocean uptake.
bExport production is defined as the amount of POC passing the 100 m depth horizon.
-30 -20 -10 0 10 20 30
Absolute D annual NPP in 2100 (gC m-2 yr-1
) 60°N
0°
60°S
LONGITUDE
-20 -10 0 10 20
Absolute D annual air-sea CO2 exchange in 2100 (gC m-2 yr-1
) 60°N
0°
60°S
60°E 120°E 180° 120°W 60°W 0° 60°E
-0.3 -0.2 -0.1 0.1 0.2 0.3
0
Absolute D N2 fixation in 2100 (gN m-2 yr-1
)
-1.5 -0.9 -0.3 0 0.3 0.9 1.5
Absolute D denitrification in 2100 (gN m-2 yr-1
) 60°E 120°E 180° 120°W 60°W 0° 60°E
FIGURE 3
(a)
(b)
(d)
(c)
Fig. 3.The absolute change in(a) NPP (gC m−2yr−1),(b)air-sea CO2exchange (gC m−2yr−1),(c)N2fixation (gN m−2yr−1), and(d)
denitrification (gN m−2yr−1), between 2000 and 2100.
web structure results in a larger relative decline in C export, relative to NPP, by 2100 (−5.1 and−3.3% for carbon export and NPP, respectively, Table 1).
Only the concentrations of non-limiting nutrients will change greatly by 2100. As mentioned previously, NO3
con-centrations increase in the Fe-limited HNLC regions where aeolian Fe input declines (Figs. 1, 4a, 5). While high resid-ual NO3concentrations unsurprisingly persist in the
South-ern Ocean, EqPac, and SAPac, we also predict excess NO3
in North Atlantic under low aeolian Fe deposition conditions (Fig. 4a). Indeed, the spatial extent of diatom Fe limitation increases by 2100 (Fig. 5a and c) , thus highlighting the po-tential importance of atmospheric supply as a source of Fe to this particular region. In the N-STP and tropical Atlantic, N remains the limiting nutrient and prevents any accumulation of residual NO3(Figs. 4a, 5) despite the increased transport
of NO3from adjacent regions of reduced NPP (Fig. 3a).
-0.2 0 0.2 0.4 0.6 0.8 1 1.2 1.4 1.6 1.8 2
Absolute D in surface NO3 in 2100 (µM) 60°N
0°
60°S
60°N
0°
60°S
60°E 120°E 180° 120°W 60°W 0° 60°E -5 -4 -3 -2 -1 -0.8 -0.6 -0.4 -0.2 0 0.1
Absolute D in surface Fe in 2100 (nM)
Percentage D in diatom abundance in 2100 -50 -40 -30 -20 -10 10 20 30 40 50
0
-0.2 0 0.2 0.4 0.6 0.8 1 1.2
Absolute D in 250 m NO3 in 2100 (µM)
60°E 120°E 180° 120°W 60°W 0° 60°E
FIGURE 4
(a)
(b)
(d)
(c)
Fig. 4.The change in the annually averaged(a)NO3at the surface (absolute,µM),(b)Fe at the surface (absolute, nM),(c)the abundance
of diatoms (percentage change in the proportion of total phytoplankton C associated with diatoms), and(d)NO3at 250 m (absolute,µM), between 2000 and 2100.
any change in Fe concentrations by 2100 (Figs. 4b, 5). Al-though there is less Fe being delivered to the Southern Ocean and the EqPac, in particular, by 2100 (Fig. 1), phytoplankton utilize all available Fe and therefore do not change surface concentrations. That said, there are notable reductions in Fe concentrations in the northern subtropical Atlantic Ocean, as well as the Indian Ocean; regions of particularly high atmo-spheric deposition rates (Jickells et al., 2005; Mahowald et al., 2006).
The diagnostic tracer Si* ((Si(OH)4)-(NO3)) was
orig-inally proposed by Sarmiento et al. (2004a) and declines with increasing Fe stress, due to the elevated Si/N uptake ratios of Fe limited diatoms (e.g., Takeda, 1998). However, we find that although Fe stress does increase in 2100 (see above), the replacement of diatoms by nanophytoplankton (which have no Si(OH)4requirement) actually increases Si*
(not shown). Therefore, Fe-mediated changes in phytoplank-ton species composition (e.g. Fig. 4c), with particular re-gard to any taxon-specific Si requirements, should be con-sidered when evaluating spatio-temporal changes in Si*. For example, the exhaustion of Si(OH)4 at more southerly
lati-tudes than NO3in the Southern Ocean (causing negative Si*)
(Franck et al., 2000; Sarmiento et al., 2004a), might arise from local aeolian inputs of Fe, or the advection of high-Fe subsurface waters from Patagonian shelf sources of high-Fe
(Fig. 1b). Greater Fe supply would allow diatoms to make up a greater proportion of phytoplankton biomass near dust deposition sites, therefore increasing Si(OH)4uptake and
re-ducing Si* (i.e. the inverse of our results). 3.4 Nitrogen biogeochemistry
3.4.1 Integrated rates and spatial distributions
Annual global N2 fixation is 75 Tg N yr−1 (in 2000,
Ta-ble 1), which is towards the lower end of the estimate of 120±50 Tg N yr−1 proposed by Gruber (2004) in a recent synthesis. Regarding specific ocean basins, Mahaffey et al. (2005) compiled estimates of Atlantic N2fixation that are
between 15 and 77 Tg N yr−1, while Pacific N2fixation rates
were 21 to 59 Tg N yr−1(Mahaffey et al., 2005 and
refer-ences therein). We find area-integrated rates are 24.2 and 31.3 Tg N yr−1for the Atlantic and Pacific Oceans,
respec-tively during this study (in 2000, Table 2). More recently, a model-based study (Deutsch et al., 2007) concluded that N2fixation rates in the Pacific may be as much as twice as
high as those in the Atlantic and proposed one of the high-est global N2fixation rates (137 Tg N yr−1). In our model,
N2fixation is of roughly the same order in the Atlantic and
60°N
0°
60°S
60°N
0°
60°S
60°E 180° 60°W 0° 60°E 180° 60°W 0°
(a)
(b)
(d)
(c)
Fig. 5.Maps of nutrient limitation for 2000 and 2100 diatoms (panels(a)and(c), respectively) and nanophytoplankton (panels(b)and(d),
respectively). The shading represents thze spatial area where a given nutrient is the most limiting for a minimum of 3 months (green for NO3, red for PO4, yellow for Si, and blue for Fe.)
where Deutsch et al. (2007) predict very high rates of N2
fix-ation (greater than 200 mmol N m−2yr−1), despite high con-centrations of DIN, and may go someway towards explaining the disparity between our estimates. In the Indian Ocean we obtain 20 Tg N yr−1of N
2fixation, but while both
geochemi-cal evidence (Gruber and Sarmiento, 1997) and the few mea-surements available (Capone et al., 1997) would support high rates of N2fixation, no basin scale estimate exists.
Global denitrification is 36.1 Tg of N yr−1(in 2000, Ta-ble 1) and is dominated by the ETP region (TaTa-ble 2, Fig. 2d). This is somewhat below the 65±20 Tg N yr−1proposed by Gruber (2004) for pelagic denitrification and well beneath es-timates of up to 150 Tg N yr−1(Codispoti et al., 2001). Un-fortunately, while we are able to capture the major features of ETP denitrification (Fig. 2d, Table 2), we evidently un-derestimate Indian Ocean denitrification severely (Table 2). As a result of the high rates of Antarctic bottom water for-mation near the Antarctic shelf, as well as the relatively high resolution simulations that are needed to accurately capture the complex physics, Indian Ocean deep waters contain too much oxygen in PISCES. Therefore, denitrification rates are retarded in a region that has been estimated to consume over 20 Tg N per year (Howell et al., 1997), a factor of 5 greater than we find (Table 2). In addition, our model also does
not include any sedimentary denitrification, which can be be-tween 180 and 300 Tg N yr−1(Codispoti et al., 2001; Gru-ber, 2004).
Overall, our value for global annual pelagic N2 fixation
of 75.7 Tg N (for 2000, Table 1) is very similar (also in terms of spatial distributions, Fig. 2a) to estimates of 58 to 75 Tg N yr−1 that are produced by models that contain a
prognostic N2 fixing PFT (Moore et al., 2006; Moore and
Doney, 2007) and well within the geochemistry-based range of 120±50 Tg N yr−1 (Gruber, 2004). As regards deni-trification, our model results are low relative to those pro-duced by Moore and Doney (2007) (65 Tg N yr−1), but within the range of 45 to 85 Tg N yr−1 proposed by Gru-ber (2004) (especially considering our aforementioned un-derestimation in the Indian Ocean). Reconciling model re-sults with the high end estimates of water column denitrifi-cation of up to 150 Tg N yr−1(Codispoti et al., 2001; Gal-loway et al., 2004) remains a challenge for global ocean-biogeochemistry models.
3.4.2 Changes in N2fixation with dust
N2fixation responds much more dramatically to changes in
de-Table 2. Integrated annual rates (Tg N yr−1)of N2fixation and denitrification, as a function of year and ocean basin. The number in
parenthesis is the percentage change relative to a control run, at the same point in time, which includes the change in atmospheric pCO2, but
assumes pre industrial (i.e. 1860) dust deposition. See Table 1 for the globally integrated rates.
N2Fixation (Tg N yr−1) Denitrification (Tg N yr−1)
Atlantic Pacific Indian Atlantic Pacific Indian
1860 25.2 35.2 21.0 2.0 33.4 4.2
2000 24.2 (-4.1)
31.3 (-11.2)
20.0 (-5.1)
2.1 (+7.9)
29.9 (-10.5)
4.1 (-2.3) 2100 22.2
(-12.1)
26.8 (-23.9)
18.6 (-11.6)
2.2 (+13.1)
28.5 (-14.7)
3.8 (-10.7)
clines by 17% (or 14 Tg N) to approximately 67 Tg N yr−1 by the end of our 240 year simulation (in 2100, Table 1). The majority of this reduction is due to changes in the Pa-cific Ocean basin, wherein N2 fixation declines by almost
25% (Table 2). In contrast, N2fixation declined by slightly
more than 10% in the Atlantic and Indian Oceans. Overall, changes in aeolian Fe input have a far greater impact on N2
fixation (by as much as 25%) than NPP or C export (3 to 5%, Table 1).
N2 fixation reacts both directly and indirectly to the
re-duced aeolian Fe inputs. The largest absolute decline in N2
fixation occurs in the southern subtropical Atlantic (Fig. 3c) and is a result of both reduced aeolian input of Fe (Fig. 1), as well as additional NO3that results from the Fe-mediated
de-cline in ATL-SO NPP (Figs. 3a, 4a). Moreover, the large area of reduced absolute N2fixation in the N-STP gyre (Fig. 3c)
is also a consequence of both the additional NO3 that is
transported from the region of reduced NPP in the EqPac (Figs. 3a, 4a), as well as reduced Fe input (Fig. 1). Indeed, N2fixation in the N-STP gyre will be highly sensitive to any
Fe-mediated changes in DIN utilization in the directly adja-cent HNLC regions such as the EqPac and SAPac (Figs. 3a and 4a), as well as local changes in Fe inputs.
Moore et al. (2006) suggest that annual N2fixation would
decline by almost 40 Tg N under an identical reduction in dust, far greater than our reduction of<10 Tg N (Table 1). This is because Moore et al. (2006) conducted 40 year sim-ulations using the future dust deposition field, wherein the impact of the reduced dust input will be exaggerated, relative to our incremental decline in dust deposition from 1860 to 2100. Indeed, the reduction in annual N2fixation of 10 to
20 Tg N from the first 2 years of Moore et al. (2006) is more in line with our results.
3.4.3 Changes in denitrification with dust
Denitrification also exhibits a strong response to the reduced atmospheric Fe inputs simulated in this study. This is due to the Fe mediated changes in C export, which modify the amount of O2consumed during remineralization and
conse-quentially, the amount of denitrification that occurs. In the Pacific Ocean, the reduction in ETP NPP (Fig. 3a), results in greater subsurface O2concentrations and denitrification
de-clines accordingly (by 24%, Table 2). On the other hand, the increase in low latitude NPP is responsible for the very slight absolute increase in Atlantic Ocean denitrification (Fig. 3a and d, Table 2). The decline in ETP denitrification results in additional subsurface NO3 (Fig. 4d), which will
eventu-ally enter surface waters and will reduce the area over which N2fixation is selected for. While N2fixation can be directly
controlled by the degree of Fe limitation, denitrification re-sponds to the change in export production (and thus O2
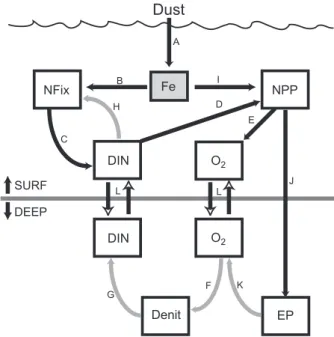
con-sumption) that results from the impact of Fe (or any other resource) on NPP (processes “I”, “J”, “K”, and “F” in Fig. 6). 3.4.4 The interplay between N2fixation and denitrification
At the beginning of our experiments the imbalance between pelagic N2fixation and denitrification amounts to excess of
42.3 Tg N. As mentioned previously, this most likely results from our underestimation of Indian Ocean denitrification and the absence of any benthic DIN consumption. For compar-ison, the recent synthesis of Gruber (2004) includes an im-balance of 65 Tg N between N2fixation and denitrification.
Over the course of our experiment, the degree of imbalance declines by around 9 Tg N (to 33.4 Tg N, Table 1) and results from the rapid response of N2 fixation to the surface water
consequences of the reduction in aeolian Fe input (on both Fe and DIN concentrations).
Denitrification remains a relatively constant fraction of N2
fixation by the end of our simulations (Table 2), in accord with hypotheses of a homeostatic DIN inventory. This is es-pecially so in the Pacific Ocean, where N2fixation and
exper-SURF
DEEP
Dust
NPP
NFix Fe
DIN
DIN
O2
O2
Denit EP
A
I
D
E
J L
L B
H
C
G
F K
Fig. 6.A schematic to illustrate the impact of a change in Fe depo-sition on, and the feedbacks between, NPP, export production (EP), N2fixation (Nfix), and denitrification (Denit). Positive and negative feedbacks are represented by black and gray arrows, respectively. The deposition of dust alters the dissolved Fe concentration (pro-cess(a), which then increases N2fixation(b)and, by consequence,
surface DIN concentrations (assumed here to be NO3+ NH4)(c).
Elevated DIN concentrations can increase NPP(d)and oxygen con-centrations(d). Once transported to the subsurface(l), greater oxy-gen concentrations will retard denitrification(f)and therefore in-crease subsurface DIN(g). When this DIN is mixed into surface waters(l), it will reduce N2fixation(h). Alternatively, additional Fe can also stimulate NPP(i), increasing export production(j), which will also reduce subsurface oxygen via remineralization(k), which will stimulate denitrification(f).
iment (240 years, Table 2). This is probably due to the ge-ographic proximity of regions of N2fixation and
denitrifica-tion in the Pacific, as well as the increased deep-water venti-lation over ETP denitrification sites (Deutsch et al., 2007). In contrast, Moore and Doney (2007) used an alternative exper-imental design (varying nitrogen cycle parameters) to sug-gest N2fixation and denitrification feedbacks were ‘muted’
in the Pacific Ocean. For example, simulated changes in N2 fixation yielded a lesser change in denitrification (and
vice-versa) than was seen in other ocean basins (Moore and Doney, 2007). In our study, N2 fixation and denitrification
are strongly coupled in Pacific (Table 2) and the high rates of denitrification in the ETP are mostly supported by the high rates of NPP (e.g., Fig. 2a), and thus C export, that arise from the local upwelling of nutrients. We find that denitrification reacts to the impact of Fe on ETP NPP, rather than N2fixation
(as noted by Moore and Doney, 2007), but that N2fixation
re-sponds to changes in DIN utilization in the ETP, as well as to
Fe. Longer simulations will be necessary in order to assess the complete impact of any change in subsurface DIN (driven by export production and denitrification) on N2fixation that
will be mediated by ocean circulation (as hypothesized by Deutsch et al., 2007).
The impact of N2fixation and denitrification on DIN
con-centrations are segregated with respect to depth (Fig. 6). Denitrification responds to the subsurface consequences of the reduction in aeolian Fe input on C export and O2
con-sumption (processes “K” and “F” in Fig. 6), by either stimu-lating N2fixation or NPP (processes “B” and “I” in Fig. 6).
Therefore, the degree of deep-water ventilation will control the efficiency with which denitrification can negatively feed-back onto N2 fixation (via DIN concentrations, processes
“G”, “L”, and “C” in Fig. 6). Reduced ventilation will also reduce vertical nutrient supply (process “L” in Fig. 6), as well as reducing subsurface O2concentrations, which may further
reduce vertical DIN supply (via greater consumption during denitrification (processes “F” and “G” in Fig. 6). Neverthe-less, any decline in vertical nutrient supply would reduce sur-face NPP, C export and subsursur-face O2consumption, thereby
resulting in reduced denitrification (Fig. 6). Overall, the inter play between Fe fuelled NPP and N2fixation and the
subse-quent impact on DIN, C export, as well as remineralization and denitrification in subsurface waters becomes much more complex when changes in exogenous nutrient inputs are ac-companied by changes in physical mixing (Fig. 6). Addi-tional field measurements of the temporal changes in the pro-cesses and pools represented in Fig. 6, as well the degree of ocean ventilation, would greatly assist future investigations.
Overall, our results suggest that it is unlikely that Fe can significantly unbalance the oceanic N cycle (Moore and Doney, 2007), especially over long timescales. While the de-cline in aeolian Fe deposition does reduce N2fixation, it is
accompanied by an oxygen mediated decline in the amount of denitrification (Tables 1 and 2). Moreover, besides the di-rect requirement of N2fixation for Fe, it is also important to
consider that Fe will influence the amount of NPP, and thus DIN utilization, that occurs in the HNLC regions (Figs. 4a and 5). In this sense, anything that changes the degree of EqPac DIN utilization (not only Fe) has the potential to feed-back onto both surface N2 fixation and subsurface
denitri-fication (processes “D” and “H”, as well as “D”, “J”, “K”, “F” and “G” in Fig. 6). This suggests that the ocean DIN inventory would be relatively insensitive to any increases in aeolian Fe input that may have occurred during the geologic past (e.g., during the last glaciation, LGM). That said, if in-creased dust deposition was also accompanied by a decline in ETP ocean ventilation (i.e. altering the strength of process “L” in Fig. 6), then the efficiency of the denitrification-N2
3.5 Air-sea CO2exchange
Ocean uptake of atmospheric CO2(FCO2)is 1.9 Pg C yr−1in
2000 (Table 1, Fig. 2b) and compares well with current esti-mates of approximately 2 Pg C yr−1(Le Qu´er´e et al., 2003). The 38% decline in dust deposition between the PI period and present day reduces FCO2by 5.5% (or 0.1 Pg C),
rela-tive to the impact of the 80µatm rise in atmospheric pCO2
(Table 1). However, by 2100 the 470µatm increase in atmo-spheric pCO2is predominantly responsible for the change in
the global ocean C sink (to 6.2 Pg C yr−1)and dust decreases ocean uptake by only 3.4% (or 0.22 Pg C, Table 1). Cumu-latively, the ocean takes up 22.8 Pg less C between 1860 and 2100, despite an 60% reduction in aeolian Fe input (or 4% of the 529.8 Pg of C taken up by the ocean assuming PI dust for 240 years).
As seen for NPP, the change in dust deposition results in a spatial reorganization in FCO2(Fig. 3b). The degree of
up-take of atmospheric CO2in the ATL-SO (Fig. 2b) is retarded
and shifted to lower latitudes (Fig. 3b). Since higher temper-atures and lower wind speeds characterize the tropical south Atlantic, gas exchange is reduced and FCO2 declines more
than NPP (−5.5% and −1.5% for FCO2 and NPP,
respec-tively, between the PI and present, Table 1). This disparity is all but eliminated by 2100, by which time the rise in at-mospheric pCO2 is the principal control on FCO2 and the
reduction in FCO2is only 0.1% greater than for NPP
(Ta-ble 1). The decrease in EqPac FCO2by 2100 is due to an
in-crease in the degree of outgassing (as NPP declines, Fig. 3a) and is partly balanced by increased ocean uptake in the WTP (Figs. 2b and 3b).
Recent studies have suggested a large reduction in the air-sea CO2 flux (Moore et al., 2006) and a dramatic increase
in atmospheric pCO2 concentrations (Parekh et al., 2006)
might result from a marked decline in oceanic dust depo-sition. In contrast, our results indicate that the impact of a massive decline in dust on air-sea CO2 fluxes is much
lower and is, at most, on the order of 3 to 5% (Table 1). Moore et al. (2006) found that the ocean uptake of CO2
de-clined by 0.5 Pg C yr−1 under a future dust scenario, but kept atmospheric pCO2 at PI levels (∼280µatm). Given
that atmospheric pCO2 is projected to increase by as much
as 470µ atm by 2100, it is difficult to compare to the re-sults of our study, which includes the observed and predicted change in atmospheric pCO2 between 1860 and 2100 (see
Methods). Although we did not compute the impact of ocean CO2 fluxes on atmospheric pCO2 (instead this was used as
a model forcing), it is clear that the impact of the reduced dust deposition will be far lower than the increase of up to 180µatm from Parekh et al. (2006) and would be closer to that of 3µ atm from Bopp et al. (2003). In a more recent study, phytoplankton biomass in PISCES was found to be highly insensitive to variability in atmospheric deposition of Fe (Aumont et al., 2008), mostly because of the explicit rep-resentation (Aumont and Bopp, 2006) of the high Fe flux that
arises from continental shelves (Elrod et al., 2004; Tyrrell et al., 2005; Lam et al., 2006; Blain et al., 2007). Coarse resolu-tion ocean-biogeochemistry models are often unable to rep-resent the continental shelves and the absence of any sedi-ment Fe source (Dutkiewicz et al., 2005; Parekh et al., 2006) will obviously increase the sensitivity of such models to any changes in aeolian input.
4 Perspectives
Our study only addresses the impacts of a change in dust de-position and atmospheric pCO2 on ocean biogeochemistry.
In reality, it is highly likely that changes in ocean circula-tion, such as increased surface stratification (e.g., Sarmiento et al., 2004b), will accompany any possible change in dust deposition. Greater stratification will impact the vertical sup-ply of nutrients to surface waters, which might hamper the growth of large PFTs, such as diatoms (Bopp et al., 2005). Changing the degree of ocean ventilation also has the po-tential to change subsurface O2concentrations, which would
impact denitrification rates. Moreover, reduced ventilation might also reduce the efficiency of the denitrification – N2
fixation negative feedback (process “L” in Fig. 6), especially in the ETP. To that end, longer simulations would be required to adequately address the impact of changes in deep nutrient inventories (driven by export production and denitrification) or longer term changes in aeolian Fe deposition (e.g. during the LGM) on surface biogeochemistry.
had high dust loads, but very low solubility (0.44%). On the other hand, anthropogenic aerosols from North America had a 100-fold lower concentration, but a 40-fold higher sol-ubility (Sedwick et al., 2007). Accounting for the variable solubility of dust borne Fe in global models is a necessary next step that may aid in improving modeled dFe distribu-tions. While dust borne Fe may be more soluble in regions that experience low rates of deposition, we do not feel that this would greatly impact our results, since these regions show little change by 2100. In addition, the weak response of NPP and FCO2to a reduction in dust deposition results
from compensatory biogeochemical processes that arise in adjacent ocean regions rather than an underestimation of the direct dust effect. Indeed, we find the local response can be large in those regions that are directly impacted by changes in dust deposition (Figs. 3 and 4).
Unsurprisingly, Moore and Braucher (2007) found a greater effect on export production and N2fixation (18 and
48%, respectively) during a 200 year simulation that assumed an instantaneous elimination of the aeolian Fe source. De-spite the far greater degree of change in aeolian Fe depo-sition, the greater impact of dust on N2 fixation than
car-bon export is in accord with this study (Table 1). However, the steady state role of aeolian Fe in controlling ocean bio-geochemistry requires simulations longer than 200 years in order to adequately represent the contribution of non local processes to the response of NPP, carbon export, N2fixation
and atmospheric CO2. These would include the impact of
changes in NPP on nutrient redistribution by mode waters. Recent research has demonstrated an enhancement of N2
fixation rates under higher CO2concentrations (Hutchins et
al., 2007; Barcelos e Ramos et al., 2007), which might off-set any dust-mediated decline in N2 fixation. As an initial
calculation, we use our modeled spatial increase in CO2(aq)
between 2000 and 2100, alongside a Michaelis-Menten fit to the proportional increase in N2 fixation per unit change in
pCO2from Hutchins et al. (2007), to suggest that global N2
fixation could be enhanced by 22 Tg N (or 30%) by 2100 (relative to 2000); more than compensating for the dust-mediated decline of 8 Tg N (Table 1). However, this up-per bound estimate assumes that N2fixation will simply
in-crease with CO2(aq), while in reality, concentrations of DIN,
Fe, and PO4 also exert a strong control. Therefore, any
CO2enhancement would be unlikely to realize the complete
22 Tg N (or 30%) by 2100. Nevertheless, the CO2effect on
N2fixation merits further investigation, especially as
anthro-pogenic CO2 is accumulating in the poorly ventilated
sub-tropical gyres (Sabine et al., 2004) that are frequented by N2
fixing phytoplankton (e.g., Mahaffey et al., 2005).
The sensitivity of individual global ocean biogeochemistry models to changes in aeolian iron input will be dependent on the model specific importance of atmospheric deposition, rel-ative to other sources of Fe. The significance of aeolian Fe inputs to global ocean biogeochemistry depends on whether a given model also represents continental shelf inputs of Fe
(low sensitivity to dust), or relies solely on dust as an exter-nal source (high sensitivity to dust). Although current global models do not address the observed spatial variability in the solubility of dust-bound Fe, including (or increasing the im-portance of) the continental shelf Fe inputs does permit a more accurate representation of the elevated phytoplankton biomass and Fe concentrations typical of these regions (Au-mont and Bopp, 2006). Notwithstanding, observational esti-mates of sedimentary Fe fluxes, as well as their geographic variability and the bioavailability of the Fe supplied, remain very limited (but see: Elrod et al., 2004; Lam et al., 2006; Blain et al., 2007) and require further investigation. In par-ticular, research should focus on the spatial variability in sed-iment Fe fluxes, as well as the solubility and bioavailability of the Fe supplied.
5 Conclusions
Despite enforcing a climatically realistic dramatic reduction in the ocean deposition of aerosol Fe, we find that global NPP and FCO2only decline by around 3%. This is due to the
spa-tial redistribution of NPP that accompanies a decline in aeo-lian Fe input, as well as the lesser importance of aeoaeo-lian Fe sources relative to continental shelf supply in PISCES. Lo-cally, dust deposition does have a role in sustaining diatom biomass in the ATL-SO and could therefore be important in controlling the relative utilization of NO3and Si(OH)4 and
the associated marine food web. N2fixation declines by 17%
in response to both the reduction in Fe supply, as well as the increased DIN concentrations that result from reduced nutrient utilization in dust impacted HNLC regions. Never-theless, concomitant declines in denitrification stabilize the ocean DIN inventory (especially in the Pacific Ocean) and the excess NO3that arises from reduced bacterial
consump-tion can act as a negative feedback on N2fixation. The
deni-trification – N2fixation feedback is controlled by changes in
nutrients and NPP/carbon export, and its efficiency depends on the degree and timescales of deep-water ventilation above denitrification sites (summarized in Fig. 6). While the en-hancement of N2fixation by elevated CO2concentrations is
not explicitly modeled, we estimate that this process might have the potential to go some of the way towards compen-sating for any dust mediated decline. The change in air-sea CO2exchange between 1860 and 2100 is predominantly
con-trolled by the change in atmospheric pCO2and the decline
in dust deposition reduces cumulative uptake (over the 240 year study period) by only 22.8 Pg C, or 4%. The impact of future changes in dust deposition, as well as other changes in climate, on ocean biogeochemical cycles should utilize a variety of global ocean biogeochemical models in order to minimize model-specific conclusions.
Acknowledgements. We thank N. Mahowald (NCAR) for
B. Schneider (LSCE), as well as peer reviews by one anonymous reviewer and J. K. Moore. Funding was provided by ANR/GOBAC and all simulations were performed at the French National comput-ing center IDRIS. This is LSCE contribution number xx.
Edited by: T. W. Lyons
References
Aumont, O., Maier-Reimer, E., Blain, S., and Monfray, P.: An ecosystem model of the global ocean includ-ing Fe, Si, P co-limitations, Global Biogeochem. Cy., 17, doi.:10.1029/2001GB001745, 2003.
Aumont, O. and Bopp, L.: Globalizing results from ocean in situ iron fertilization studies, Global Biogeochem. Cy., 20, GB2017, doi:10.1029/2005GB002591, 2006.
Aumont, O., Bopp, L., and Schulz, M.: What does temporal vari-ability in aeolian dust deposition contribute to sea-surface iron and chlorophyll distributions?, Geophys. Res. Lett., in press, 2008.
de Baar, H. J. W., Boyd,P. W., Coale, K. H., et al.: Synthe-sis of iron fertilization experiments: From the iron age in the age of enlightenment, J. Geophys. Res., 110, C09S16, doi:10.1029/2004JC002601, 2005.
Baker, A. R. and Jickells, T. D.: Mineral particle size as a con-trol on aerosol iron solubility, Geophys. Res. Lett., 33, L17608, doi:10.1029/2006GL026557, 2006.
Barcelos e Ramos, J., Biswas, J. H., Schulz, K. G. LaRoche, J., and Riebesell, U.: Effect of rising atmospheric carbon dioxide on the marine nitrogen fixer Trichodesmium, Global. Biogeochem. Cy., 21, GB2028, doi:10.1029/2006GB002898, 2007.
Blain, S., Queguiner, B., Armand, L., et al.: Effect of natural iron fertilization on carbon sequestration in the Southern Ocean, Na-ture, 446, 1070-U1, 2007.
Bopp, L., Aumont, O., Cadule, P., Alvain, S., and Gehlen, M.: Re-sponse of diatoms distribution to global warming and potential implications: A global model study, Geophys. Res. Lett., 32, L19606, doi:10.1029/2005GL023653, 2005.
Bopp, L., Kohlfield, K. E., Le Quere, C., and Aumont, O.: Dust impact on marine biota and atmospheric CO2during glacial pe-riods, Paleoceanography, 18, doi:10.1029/2002PA000810, 2003. Boyd, P. W., Watson, A. J., Law, C. S., Abraham, E. R., Trull, T., Murdoch, R., Bakker, D. C. E., Bowie, A. R., Buesseler, K. O., Chang, H., and Charette, M.: A mesoscale phytoplankton bloom in the polar Southern Ocean stimulated by iron fertilization, Na-ture, 407, 695–702, 2000.
Boyd, P. W., Law, C. S., Wong, C. S., et al.: The decline and fate of an iron-induced phytoplankton bloom, Nature, 428, 549–553, 2004.
Capone, D. G., Zehr, J. P., Paerl, H. W., Bergman, B., and Carpen-ter, E.: Trichodesmium, a globally significant marine cyanobac-terium, Science, 276, 1221–1229, 1997.
Coale, K. H., Johnson, K. S., Fitzwater, S. E., et al.: A massive phytoplankton bloom induced by an ecosystem-scale iron fertil-ization experiment in the equatorial Pacific Ocean, Nature, 383, 495–501, 1996.
Codispoti, L., Brandes, J. A., Christensen, J. P., et al.: The oceanic fixed nitrogen and nitrous oxide budgets: Moving targets as we enter the anthropocene?, Sci. Mar., 65, 85–105, 2001.
Codispoti, L. A.: An oceanic fixed nitrogen sink exceeding 400 Tg N a−1vs the concept of homeostasis in the fixed-nitrogen inventory, Biogeosciences, 4, 233–253, 2007,
http://www.biogeosciences.net/4/233/2007/.
Deutsch, C., Sarmiento, J. L., Sigman, D. M., Gruber, N., and Dunne, J. P.: Spatial coupling of nitrogen inputs and losses in the ocean, Nature, 445, (7124), 163–167, 2007.
Duce, R. A., Liss, P. S., Merrill, J. T., et al.: The atmospheric input of trace species to the world ocean, Global Biogeochem. Cy., 5, 293–259, 1991.
Dutkiewicz, S., Follows, M. J., and Parekh, P.: Interac-tions of the iron and phosphorous cycles: A three dimen-sional model study, Global Biogeochem., Cy., 19, GB1021, doi:10.1029/2004GB002342, 2005.
Elrod, V. A., Berelson, W. M., Coale, K. H., and Johnson, K. S.: The flux of iron from continental shelf sediments: A miss-ing source for global budgets, Geophys. Res. Lett., 31, L12307, doi:10.1029/2004GL020216, 2004.
Falkowski, P. G.: Evolution of the nitrogen cycle and its influence on the biological sequestration of CO2in the ocean, Nature, 387,
272–275, 1997.
Falkowski, P. G., Barber, R. T., and Smetacek, V.: Biogeochemical controls and feedbacks on ocean primary production, Science, 281, 200–206, 1998.
Franck, V. M., Brzezinski, M. A., Coale, K. H., and Nelson, D. M.: Iron and silicic acid concentrations regulate Si uptake north and south of the Polar Frontal Zone in the Pacific Sector of the Southern Ocean, Deep Sea Res., Part II, 47, 3315–3338, 2000. Galloway, J. N., Dentener, F. J., Capone, D. G, et al.: Nitrogen
cycles: past, present and future, Biogeochemistry, 70, 153–226, 2004.
Ginoux, P., Chin, M., Tegen, I., et al.: Sources and distribution of dust aerosols with the GOCART model, J. Geophys. Res., 106, 20 225–20 273, 2001.
Gruber, N. and Sarmiento J. L.: Global patterns of nitrogen fixation and denitrification, Global Biogeochem. Cy., 11, 235–266, 1997. Gruber, N.: The dynamics of the marine nitrogen cycle and its in-fluence on atmospheric CO2 variations, in: The Ocean Carbon Cycle, edited by: Follow, M. and Orguz, T., Springer, New York, 97–148, 2004.
Howell, E. A., Doney, S. C., Fine, R. A., and Olsen, D. B.: Geo-chemical estimates of denitrification in the Arabian Sea and the Bay of Bengal during WOCE, Geophys. Res. Lett., 24, 2539– 2552, 1997.
Hutchins, D. A., Fu, F. X., Zhang, Y., et al.: CO2control of
Tri-chodesmium nitrogen fixation, photosynthesis, growth rates and elemental ratios: Implications for past, present and future ocean biogeochemistry, Limnol. Oceanogr., 52, 1293–1304, 2007. Jickells, T. D. and Spokes, L. J.: The Biogeochemistry of Iron in
Seawater, edited by: Turner, D. R. and Hunter, K., Wiley, UK, 85–121, 2001.
Jickells, T. D., An, Z. S., Andersen, K. K., et al.: Global iron con-nections between desert dust, ocean biogeochemistry, and cli-mate, Science, 308, 67–71, 2005.
A., Waychunas, G. A., and Fung, I. Y.: Wintertime phy-toplankton bloom in the subarctic Pacific supported by con-tinental margin iron, Global Biogeochem. Cy., 20, GB1006, doi:10.1029/2005GB002557, 2006.
Le Qu´er´e, C., Aumont, O., Bopp, L., et al.: Two decades of ocean CO2 sink and variability, Tellus B, 55, 649–656, 2003.
Lipschulz, F., Wofsy, S., Ward, B., Codispoti, L., Friedrich, G., and Elkins, J.: Bacterial transformations of inorganic nitrogen in the oxygen deficient waters of the eastern tropical South Pacific, Deep Sea Res., Part I, 37, 1513–1541, 1990.
Madec, G., Delecluse, P., Imbard, M., and L´evy, C.: OPA8.1 Ocean general circulation model reference manual, Notes du pole de model, 11, 91PP., Inst. Pierre-Simon Laplace, Paris, 1990. Mahaffey, C, Michaels, A. F., and Capone, D. G.: The conundrum
of marine n-2 fixation, Am. J. Sci., 305, 546–595, 2005. Mahowald, N. M. and Luo, C.: A less dusty future?, Geophys. Res.
Lett., 30, 1903, doi:10.1029/2003GL017880, 2003.
Mahowald, N. M., Muhs, D. R., Levis, S., et al.: Change in atmo-spheric mineral aerosols in response to climate: last glacial pe-riod, modern and doubled carbon dioxide climates, J. Geophys. Res., 111, D10202, doi:10.1029/2005JD006653, 2006.
Mahowald, N. M.: Anthropocene changes in desert area: Sensitivity to climate model predictions, Geophys. Res. Lett., 34, L18817, doi:10.1029/2007GL030472, 2007.
Martin, J. H.: Glacial-Interglacial CO2Change: the iron
hypothe-sis, Paleoceanography, 5, 1–13, 1990.
Michaels, A. F., Karl, D. M., and Capone, D. G.: Element stoi-chiometry, new production nitrogen fixation, Oceanography, 14, 68–77, 2001.
Middleberg, J. J., Soetaert, K., Herman, P. M. J., and Heip, C. H. R.: Denitrification in marine sediments: A model study, Global Biogeochem. Cy., 10, 661–673, 1996.
Moore, J. K., Doney, S. C., Lindsay, K., Mahowald, N. M., and Michaels, A. F.: N fixation amplifies the ocean biogeochemical response to decadal timescale variations in mineral dust deposi-tion, Tellus B, 58, 560–572, 2006.
Moore, J. K. and Doney, S. C.: Iron availability limits the ocean ni-trogen inventory stabilizing feedback between marine denitrifica-tion and nitrogen fixadenitrifica-tion, Global Biogeochem. Cy., 21, GB2001, doi:10.1029/2006GB002762, 2007.
Moore, J. K. and Braucher, O.: Sedimentary and mineral sources of dissolved iron to the World Ocean, Biogeosciences Discuss., 4, 1279–1327, 2007,
http://www.biogeosciences-discuss.net/4/1279/2007/.
Nakicenovic, N. and Swart, R. (Eds.): Special Report on Emissions Scenarios, A Special Report of Working Group III of the Inter-governmental Panel on Climate Change, Cambridge University Press, Cambridge, United Kingdom and New York, NY, USA, 599 pp., 2000.
Parekh, P., Dutkiewicz, S., Follows, M. J., and Ito, T.: Atmospheric carbon dioxide in a less dusty world, Geophys. Res. Lett., 33, L03610, doi:10.1029/2005GL025098, 2006.
Raven, J. A.: Predictions of Mn and Fe use efficiencies of pho-totrophic growth as a function of light availability for growth and of C assimilation pathway, New. Phytol., 116, 1–18, 1990.
Redfield, A. C.: On the proportions of organic derivations in sea water and their relation to the composition of plankton, James Johnston Memorial Volume, Liverpool, 176–192, 1934. Rueter, J. G., Hutchins, D. A., Smith, R. W., and Unsworth, N. L.:
Iron nutrition of Trichodesmium, in: Marine Pelagic Cyanobac-teria: Trichodesmium and other diazotrophs, edited by: Car-penter, E. J., Kluwer Academic Publishers, Dordecht, 289–306, 1992.
Sabine, C. L., Feely, R. A., Gruber, N., et al.: The oceanic sink for anthropogenic CO2, Science, 305, 367–371, 2004.
Sarmiento, J. L., Gruber, N., Brzezinski, M. A., and Dunne, J. P.: High latitude control of thermocline nutrients and low latitude productivity, Nature, 427, 56–60, 2004a.
Sarmiento, J. L., Slater, R., Barber, R., et al.: Response of ocean ecosystems to climate warming, Global Biogeochem. Cy., 18, GB3003, doi:10.1029/2003GB002134, 2004b.
Sedwick, P. N., Sholkovitz, E. R., and Church, T. M.: Impact of an-thropogenic combustion emissions on the fractional solubility of aerosol iron: Evidence from the Sargasso Sea, Geochem. Geo-phys. Geosyst., 8, Q10Q06, doi:10.1029/2007GC001586, 2007. Soetaert, K., Middleberg, J. J,. Herman, P. M. J, and Buis, K.:
On the coupling of benthic and pelagic biogeochemical models, Earth Sci. Rev., 51, 173–201, 2000.
Sunda, W. G. and Huntsman, S. A.: Interrelated influence of iron, light and cell size on marine phytoplankton growth, Nature, 390, 389–392, 1997.
Tagliabue, A. and Arrigo, K. R.: Processes governing the supply of iron to phytoplankton in stratified seas, J. Geophys. Res., 111, C06019, doi:10.1029/2005JC003363, 2006.
Takeda, S.: Influence of iron availability on nutrient consumption ratio of diatoms in oceanic waters, Nature, 393, 774–777, 1998. Tegen, I., Werner M., Harrison S. P., and Kohlfeld, K. E.: Relative
importance of climate and land use in determining present and future global soil dust emission, Geophys. Res. Lett., 31, L0515, doi:10.1029/2003GL019216, 2004.
Timmermann, R., Goose, H., Madec, G., Fichefet, T., Eth´e, C., and Duli´ere, V.: On the respresentation of high latitude processes in the ORCALIM global coupled sea ice-ocean model, Ocean Modell., 8, 175–201, 2003.
Timmermans, K. R., van der Wagt, B., and de Baar, H. J. W.: Growth rates, half saturation constants, and silicate, nitrate, and phosphate depletion in relation to iron availability of four large, open ocean diatoms from the Southern Ocean, Limnol. Oceanogr., 49, 2141–2151, 2004.
Tyrrell, T., Merico, A., Waniek, J. J.: The relative influences of ni-trogen and phosphorous on oceanic primary production, Nature, 400, 525–531, 1999.
Tyrrell, T. et al.: Effect of seafloor depth on phytoplankton blooms in high-nitrate, low-chlorophyll (HNLC) regions, J. Geophys. Res., 110, G02007, doi:10.1029/2005JG000041, 2005.