www.nat-hazards-earth-syst-sci.net/14/1059/2014/ doi:10.5194/nhess-14-1059-2014
© Author(s) 2014. CC Attribution 3.0 License.
Natural Hazards
and Earth System
Sciences
Detection and thermal description of medicanes from numerical
simulation
M. A. Picornell1, J. Campins1, and A. Jansà2,3
1Agencia Estatal de Meteorología, Palma de Mallorca, Spain 2Universitat de les Illes Balears, Palma de Mallorca, Spain
3Formerly at Agencia Estatal de Meteorología, Palma de Mallorca, Spain
Correspondence to:M. A. Picornell ([email protected])
Received: 6 November 2013 – Published in Nat. Hazards Earth Syst. Sci. Discuss.: 12 December 2013 Revised: 24 February 2014 – Accepted: 15 March 2014 – Published: 7 May 2014
Abstract. Tropical-like cyclones rarely affect the Mediter-ranean region but they can produce strong winds and heavy precipitations. These warm-core cyclones, called MEDI-CANES (MEDIterranean hurriMEDI-CANES), are small in size, develop over the sea and are infrequent. For these reasons, the detection and forecast of medicanes are a difficult task and many efforts have been devoted to identify them.
The goals of this work are to contribute to a proper descrip-tion of these structures and to develop some criteria to iden-tify medicanes from numerical weather prediction (NWP) model outputs. To do that, existing methodologies for de-tecting, characterizating and tracking cyclones have been adapted to small-scale intense cyclonic perturbations. First, a mesocyclone detection and tracking algorithm has been mod-ified to select intense cyclones. Next, the parameters that de-fine the Hart’s cyclone phase diagram are tuned and calcu-lated to examine their thermal structure.
Four well-known medicane events have been described from numerical simulation outputs of the European Centre for Medium-Range Weather Forecast (ECMWF) model. The predicted cyclones and their evolution have been validated against available observational data and numerical analyses from the literature.
1 Introduction
In the Mediterranean region intense and small cyclonic storms develop from time to time (Jansà, 2003). Some of them have features of tropical cyclones: they originate and develop over the sea, present a warm-core structure and in
most of the cases they have a clear eye surrounded by a convective eye-wall cloud pattern. These quasi-tropical cy-clones have been identified as MEDIterranean hurriCANES or MEDICANES, by their common characteristics with hur-ricanes. They are related to severe weather phenomena as strong winds, that sometimes overcome the threshold wind of tropical storm (17 m s−1) and exceptional cases up to the threshold of hurricanes (32 m s−1), and heavy precipitation that can cause damages, especially in maritime navigation or when they make landfall in coastal areas. Heat exchanges, mainly from convective processes and air–sea interaction, play a key role in the formation and maintenance of med-icanes. Medicanes usually develop under deep upper tro-pospheric troughs, in regions of small baroclinity but large air–sea thermodynamic disequilibrium associated with the trough (Emanuel, 2005).
is described in Gili et al. (1997). This event was numerically simulated by Homar et al. (2003). More recently, another well-known medicane occurred on 26 September 2006 and it has been described in several papers (Moscatello et al., 2008; Davolio et al., 2009; Chaboureau et al., 2012, among oth-ers). In the latter work, any possible tropical transition of the cyclone is identified by projecting it into the cyclone phase space and jet crossing is highlighted as a key mechanism for this transformation.
On the other hand, the atmospheric environments that favour the development and maintenance of medicanes have been studied from different points of view. In Fita et al. (2007), an axisymmetric numerical model was used to do that, complemented with sensitivity analyses with a 3-D model. The characteristics of precursor and non-precursor cyclonic environments for medicane development were stud-ied in Campins et al. (2009). An empirical genesis index, GENPDF, was also introduced to estimate or forecast the likelihood of medicane genesis (Romero and Emanuel, 2006; Tous and Romero, 2011, 2013). All these papers support the idea that medicanes usually form in areas with a deep, cut-off, cold-core cyclone at upper levels and with strong con-vection activity. Surface heat and moisture fluxes play a key role in their development.
Remote sensing products in general and satellite pictures in particular are valuable instruments to detect these cy-clones and to observe their tracks, and appropriate numer-ical weather prediction (NWP) models are essential to fore-cast medicanes, as Mayençon (1984) has already pointed out. The rarity of these phenomena, their maritime character and their small size, make the systematic detection and forecast of medicanes a difficult task. For this reason, studies focused to perform a medicane database systematically and to de-velop forecasts capable of warning of these phenomena may prove very helpful.
Recently some criteria have been established by Tous and Romero (2011, 2013) to define a medicane from the Meteosat satellite images. The criteria are based on the structure (the medicane must have a continuous cloud cover and symmet-ric shape around a clearly visible cyclone eye), size (diame-ter less than 300 km) and lifetime (lifetime at least 6 hours). In their work, using historical infrared (IR) Meteosat satel-lite data, lists of medicanes have been created based on the aforementioned criteria. The use of satellite images has been recognised as a useful tool to consistently detect storms and, in this case, medicanes (Tous and Romero, 2011, 2013) but it carries a very laborious task.
Over the last years several methodologies have been de-veloped to follow cyclones from NWP models. One such method for detection and tracking Mediterranean cyclones, including mesocyclones, was developed in the Meteorolog-ical Centre of the Balearic Islands (AEMET) and some cy-clone databases were obtained from different sets of anal-ysis based on NWP systems (Picornell et al., 2001 and Campins et al., 2006). Moreover, Hart (2003) proposes a
phase space where the cyclone evolution is represented. Cy-clone phase diagrams inform about symmetric/frontal and cold/warm character of the cyclone. The cyclone phase di-agrams have been applied to past time and in real time from different numerical models and they are available at http: //moe.met.fsu.edu/cyclonephase. Initially, the diagrams have been used for forecasting extra-tropical transition of tropical cyclones and later the diagrams have been increasingly used for structural forecasting of subtropical cyclones and cold-core to warm-cold-core evolution (Hart and Evans, 2004).
Recently, progress has been made towards the construc-tion of methods to detect medicanes from numerical mod-els systematically. A method for constructing multi-decadal statistics and scenarios of current and possible future medi-cane activities by means a dynamical downscaling approach had been presented by Cavicchia and von Storch (2012). In their work, several climatic model simulations, with a high-resolution regional atmospheric model and for a number of test cases described in literature, has been performed by em-ploying two horizontal resolutions, one “low” with 0.22◦ (25 km) grid and one “high”, with 0.09◦(10 km) in a dou-ble nested configuration. In Miglietta et al. (2013) several Mediterranean tropical-like cyclones are analysed by means of numerical simulations, satellite products and lightning data, in order to achieve a future automatic detection algo-rithm for discriminating tropical-like cyclones from baro-clinic cyclones. Walsh et al. (2014) focus on a subset of all Mediterranean lows, those that have high wind speeds and warm core, referred to as “warm-core lows” and design a storm detection and tracking algorithm to identify them from the regional climate model RegCM3 running at a hor-izontal grid spacing of 25 km. From another point of view, Romero and Emanuel (2013) apply a statistical determinis-tic approach that entails the generation of thousands of syn-thetic storms from the ERA-40 reanalysis and from four dif-ferent global climate models (GCMs), with the aim of as-sessing medicane risk under current and future climate con-ditions. This method produces statistically large populations of events and unprecedented wind risk maps for the Mediter-ranean region.
can also be described by using this methodology. Their de-scription through the phase diagram may allow the identifi-cation of their typology.
This paper is structured as follows. First, in Sect. 2, the aforementioned mesocyclone detection algorithm has been modified in order to select and to characterise intense struc-tures. Furthermore the Hart’s cyclone phase diagram has been adapted and tuned to correctly describe the thermal structure of small intense cyclones in general and medicanes in particular. Next, in Sect. 3, the adapted procedure has been applied to the outputs of numerical simulation runs to de-tect and describe four tropical-like cyclones that affected the Mediterranean region. The predicted cyclones and their evo-lutions have been validated against available observational data and numerical analyses coming from literature. Finally, in Sect. 4, the results are discussed and the main conclusions are outlined.
2 Methodology
2.1 Intense cyclone detection and tracking
The method for detection and tracking Mediterranean cy-clones designed to describe cyclonic perturbations, includ-ing mesocyclones, and their characteristics (Picornell et al., 2001 and Campins et al., 2006) has been used to obtain some cyclone climatologies from different sets of analyses com-ing from NWP systems (with moderate resolutions, around 50 km). Typical sizes of detected cyclones are 200–300 km in radius, smaller than the typical extra-tropical cyclones, but clearly larger than the perturbations (like medicanes) that we want to detect and describe now (less than 150 km of radius). The size of the structures that can be properly represented de-pends on the NWP model resolution. Resolutions of around 25–50 km are probably not enough to correctly describe per-turbations of less than 300 km of diameter (like the medi-canes). In fact, Walsh et al. (2014) consider that the 25 km horizontal resolution may still not capture highest intensities of the warm-core storms and may not be high enough to ef-fectively capture true medicane. In order to check whether a robust operational model, with good physical parametrisa-tion and a greater resoluparametrisa-tion, is able to simulate these small and intense structures, we have selected the European Centre for Medium-Range Weather Forecast (ECMWF) forecasting model outputs, with a horizontal resolution of 15 km.
In the original method, a cyclone is defined as a relative minimum in the mean sea level pressure (MSLP) field, with a mean pressure gradient greater than or equal to 0.5 hPa per 100 km (1p≥0.510−2hPa km−1) at least in six of the eight principal directions around the minimum. To avoid exces-sive noise in some fields (like vorticity, needed for the vor-tex description), a Cressman filter with an influence radius of 200 km was applied to smooth the analysed fields. The cy-clone domain is limited by the zero-vorticity line, around the
minimum pressure position. The 700 hPa level is considered as the steering level for the cyclone tracking.
Some aspects needed to better describe small-scale in-tense cyclonic perturbations have been adapted. First of all, to preserve the main features of the small structures the influ-ence radius in Cressman filter has been reduced from 200 to 50 km. Also a double criterion referred to the pressure gradi-ent is proposed:
– A less demanding criterion to obtain the full lifetime of the cyclone, including both previous and later mo-ments of an intense cyclone,1p≥0.510−2hPa km−1 at least in six of the eight principal directions around the minimum. This pressure gradient threshold is the same as in previous papers.
– A more restrictive threshold value to select in-tense cyclones (including possible medicanes),1p≥
3.210−2hPa km−1 in at least six of the eight direc-tions. This threshold roughly corresponds to a mean geostrophic wind speed of about 32 m s−1, which it-self is equivalent to a gradient wind of 15–17 ms−1for
cyclone radii between 150 and 200 km.
Other criteria for medicanes will be defined in the next section.
2.2 Thermal structure
The cyclone’s life cycle can be analysed within the three-dimensional phase space proposed by Hart (2003), providing substantial insight into the cyclone structural evolution. Each cyclone is characterised by using three fundamental magni-tudes of its phase, defined on a circle around the cyclone cen-tre:
(i) Parameter B, the storm-motion-relative low tropo-sphere thickness asymmetry inside the cyclone (ii) −VTL, low tropospheric thermal wind, which measures
the cold, neutral, or warm-core structure of the cyclone in the low–middle troposphere
(iii) −VTU, upper-tropospheric thermal wind, which gives the measure of the cyclone phase (cold vs. warm-core) for the upper troposphere and helps to distinguish full-troposphere warm-core cyclones (e.g. tropical cy-clones) from shallow warm-core cyclones (warm-seclusion or subtropical cyclones).
Three-dimensional cyclone phase space is presented using two cross sections, the phase diagrams, which facilitate an objective classification of cyclones from the analysis of their life cycle in the phase space.
out their warm-core structure, as pointed out by Chaboureau et al. (2012), who used a radius of 200 km, and Miglietta et al. (2011), who chose a radius of 100 km (but verifying the results were consistent in a range of values), obtaining near-zero values ofB to indicate symmetry of the supposed medicane. Cavicchia (2013), after considering several possi-ble radii, obtained the best results using a radius of 100 km. Miglietta et al. (2013) incorporate a variable radius, as sug-gested in Hart (2003), considering the extension of the warm-core anomaly at 600 hPa. In the present work, after several attempts and in order to use a storm-size-dependent circle of exploration, the mean radius of the warm-core anomaly is used to estimate the three phase parameters. This radius is calculated from the line of zero-temperature Laplacian around the temperature maximum at 700 hPa closest to cy-clonic centre. If no temperature maximum is located, taking into account the results of previous works, a radius of 90 km is used.
Moreover, two layers, 925–700 and 700–400 hPa, slightly lower than those of Hart have been explored. In the Mediter-ranean latitudes the 600–300 hPa layer is probably too high to look for a warm-core induced by latent heat release, com-ing from convection. In fact deep convection top is defined by the tropopause level, which is higher in the tropical and sub-tropical latitudes than in the Mediterranean ones (see Fig. 4.7 in Palmén and Newton, 1969). Furthermore, in the case of medicane at upper levels the meteorological frame is usually dominated by a cut-off low or a deep cold trough (Emanuel, 2005), where the tropopause level is lower than generally. For all these reasons the upper layer of exploration was low-ered to 700–400 hPa; the lower layer would then be 1000– 700 hPa, but 1000 hPa is influenced too much by the terrain and the final election is 925–700 hPa. Therefore
B=(Z700−Z925)|L−(Z700−Z925)|R,
whereRindicates right of current storm motion,Lindicates left of storm motion and the overbar indicates the areal mean over a semicircle of exploration.
In this work, the thermal structure of the selected meso-cyclones is scrutinised by means of the two phase diagrams. The criteria proposed by Hart to define tropical cyclones are imposed to qualify a mesocyclone as a medicane:
– The cyclone is thermally symmetric, withB <10 m.
– A warm-core structure of the cyclone must be present in the low–middle and in the upper troposphere, that is,−VTL>0 and−VTU>0.
2.3 Numerical simulations of test cases
In order to test the suitability of the aforementioned crite-ria to define an intense cyclone and to discriminate mainly between medicanes and other small intense cyclones, previ-ous methodology has been applied to four well-known med-icane events occurred between 1982 and 1996. Two of them
occurred in the western Mediterranean in early Fall and two have been identified in central–eastern Mediterranean in win-ter. Three of them have been selected from the aforemen-tioned satellite-derived database (Tous and Romero, 2013).
The ECMWF T1279L91Cy36r1 forecast model (hereafter ECT1279), which corresponds to a horizontal resolution of 15 km (detailed documentation is available at http://www. ecmwf.int/en/research/modelling-and-prediction), has been run for the selected cases. For each event, four runs have been performed, with initialisation times separated 24 h, starting at 12:00 UTC of the day before the first appearance of the cy-clone, with lead times from 6 to 72 h every 6 h. The analysis comes from the ERA-40 fields, interpolated to the model res-olution. For each event, the best simulation has been selected and the results are presented in the following section.
The predicted cyclones and their evolution have been val-idated against available observational data and numerical analyses from literature. According to this, the four selected cases correspond to tropical-like structures, including com-pact spiral cloud vortexes, although the name medicane is not always used. We must also take into account that, usu-ally, a medicane is clearly identified when it reaches its ma-ture stage, but in most of the cases it is difficult to identify its initial or final stages. This hampers the validation of the nu-merical simulations and prevents finding an exact correspon-dence between the two descriptions. In spite of this, these papers are a good reference to validate our procedure.
3 Results
3.1 January 1982 event
● ●
●
●
● ●
●
●
●
●
● ● ●
●
● ● ●
●● ● ● ● ● ●
● ● ●
● ●
● ● ● ● ● ● ●
● ● ●
● ●●
●
●
●
●
● ●
● ●
● ●
●
σ σσσ σ σ σσσσ σσ
σ σ
σ σ σ
>
>
>
>
>
>
>
>
Medicane track
1982
1983
1995
1996
SPAIN
LIBYA TUNISIA ALGERIA
IT AL
Y
GREECE
Valenc. Gulf
Balearic I.
Sardinia
Sicily
Ionian Sea
Pelopon.
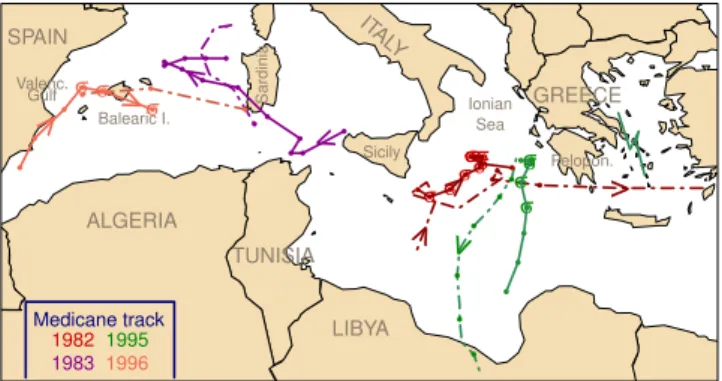
Fig. 1. Medicane tracks in Mediterranean Sea. In red, 1982 event,
in violet, 1983 event, in green 1995 event and in orange 1996 event. Simulated cyclone tracks (solid lines) with symbolσindicates med-icane + observed cyclone tracks transcribed from literature (dot-dash lines)
When this event was simulated by the ECT1279 model, the best forecast of this medicane is from 24 January at 12:00 UTC. During 72 h of simulation, a cyclone is detected and the model is able to reproduce the complicated path and to forecast the abrupt changes of direction after the loops (see Fig. 1). At upper levels a cut-off is located over Tunisia on 26 January at 12:00 UTC, as in Reed et al. (2001). From 25 January at 00:00 UTC to 27 January at 06:00 UTC the mean pressure gradient overcomes the more restrictive threshold value and thereby the cyclone is classified as in-tense. During the first part of the life cycle, when cyclone spins around the first loop, the central pressure decreases to its minimum value (see Fig. 2a), although not to the observed values, while the gradient wind and the vorticity reaches a relative maximum (see Fig. 2a and Fig. 2b). The system is very symmetric and its positions in the phase diagram I are very close each other (see Fig. 3a). Along the second stage of cyclone life the central pressure increases, disagreeing with the pressure evolution described in literature. However, the model itself is able to predict the observed contraction in scale of the system and the radius decreases, reaching a ra-dius of about 150 km 26 January at 12:00 UTC, meanwhile the gradient wind and the vorticity achieve the highest value (see Fig. 2a and b). Along this stage the cyclone is also de-scribed as symmetric and at low level becomes warmer re-garding to the previous stage (see Fig. 3a). The warm core is about 130 km radius (see Fig. 2b), except at the begin-ning, when the cyclone is extensive. As phase diagram II shows (see Fig. 3b), a deep warm-core structure is present throughout all lifetime and the upper thermal wind reaches two differentiated maxima, one in each of the two stages of cyclone life. The cyclone presents characteristics of medi-cane for about 60 h.
In this simulation the system evolves in agreement with the evolution described by Reed et al. (2001). The cyclone is described as intense and symmetric throughout most of
its life and with a deep warm core; therefore, the system is identified as a medicane for much of the simulated path.
3.2 September 1983 event
On 27 September 1983 a sub-synoptic vortex-like distur-bance was formed in the central part of a low of modest in-tensity, between Sicily and Tunisia. After its formation, the vortex moved in a large circle in about 4 days and it was best developed over the sea west of Sardinia and Corsica (see Fig. 1). Finally, it vanished after having made landfall close to its place of origin, as it is described in Rasmunssen and Zick (1987). The major tools for the study were Meteosat images, from IR and visible (VIS) spectrum, and wind data from low and high levels, obtained by tracking cloud ele-ments from these images. As described by the authors, the upper air synoptic situation in the region was dominated by a deep and cold cut-off over the western Mediterranean, cen-tred in northern Tunisia. At 12:00 UTC on 27 September the Meteosat IR image exhibited a large-scale cloud spiral and deep convection. Three hours later, the formation of the sub-synoptic vortex was indicated by strong pressure falls and a low-level secondary centre of positive relative vorticity in the region. On 28 September, VIS image showed the dissolving large-scale cloud spiral, with the sub-synoptic vortex in its centre (see Fig. 5 in Rasmunssen and Zick, 1987). The cy-clonic activity was contracted into the central part of the low and a cloud-free spot, similar to an “eye”, was shown. On 29 September a tight and almost circular mesoscale cloud vortex was observed and around noon the vortex was char-acterised by a warm-core structure. Later the vortex started to weaken, when it moved into a region with decreasing sea surface temperature. During the second landfall at Corsica at 30 September the vortex intensified.
12 17 22
Wind
2418 2506 2518 2606 2618 2706 998
1000 1002 1004 1006
Centr
al Pressure
2418 2506 2518 2606 2618 2706 1 2 3 4 5
Mean Pressure Gr
adient (6 dir)
3.2
2418 2506 2518 2606 2618 2706 100
150 200 250 300
Mean Radius
2418 2506 2518 2606 2618 2706 100
150 200 250 300
Mean Radius
2418 2506 2518 2606 2618 2706 0 2 4 6 8 10 12
Geostrophic V
or
ticity
a) b)
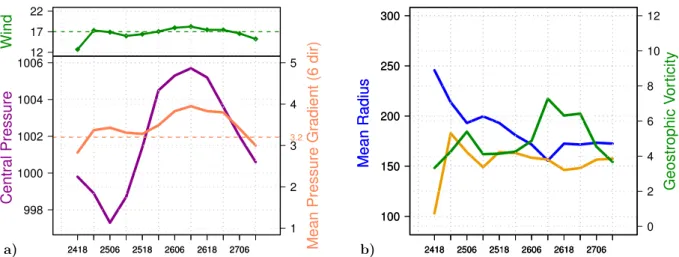
Fig. 2. Evolution over time of(a) gradient wind (m s−1) in green (top) and central pressure (hPa) in violet + mean pressure
gradi-ent (10−2hPa km−1) in orange (bottom)(b)mean radius (km) in blue + mean warm core radius (km) in orange+geostrophic vorticity (10−4s−1); for 1982 event.
● ●
●
●
● ●
●
●
●
●
●
●
−VTL [925−700hPa] Thermal wind
B [925−700hP
a]
σ
σ
σ
σ
σ
σ
σ
σ
σ
σ
Cent. pressure (hPa)
995−1000 995−1000 995−1000 995−1000 1000−1005 1000−1005
1005−1010 1005−1010 1005−1010
1000−1005 1000−1005 1000−1005
Circulation (107s−1m−2)
●
● 2 4 6 8 Medicane
σ
Intense (but not medicane)
φ Start (A): 1982012418 (H + 06)
End (Z): 1982012712 (H + 72)
A
Z
−100 −50 0 50 100
−2 0 2 4 6 8 10 12
Cold Core Warm Core
Symmetr
ic
Asymmetr
ic
(Non frontal)
(Frontal)
Asymmetric Cold Core Asymmetric Warm Core
Symmetric Cold Core Symmetric Warm Core
●
●
●
●
● ●
● ●
●
● ●
●
−VTL [925−700hPa] Thermal wind
−VTU [700−400hP
a] Ther
mal wind
σ
σ
σ
σ σ
σ
σ
σ
σ
σ
Medicaneσ
Intense (but not medicane)
φ
Cent. pressure (hPa)
995 − 1000 995 − 1000 995 − 1000 995 − 1000 1000 − 1005 1000 − 1005
1005 − 1010 1005 − 1010 1005 − 1010
1000 − 1005 1000 − 1005 1000 − 1005
Circulation (107s−1m−2)
●
●
●
2 4 6 8
Start (A): 1982012418 (H + 06) End (Z): 1982012712 (H + 72)
A Z
−100 −50 0 50 100
−60 −40 −20 0 20 40 60
Cold Core Warm Core
Cold Core
W
ar
m Core
Deep Warm Core
Deep Cold Core Shallow Warm Core
a) b)
Fig. 3. Cyclone phase diagrams I(a)and II(b), for January 1982 event. Circle colour refers to central pressure value and circle size is related
to geostrophic circulation value. Symbolσ indicates the presence of medicane.
wind is lower than 13 m s−1(see Fig. 4a). Upper level ther-mal wind values indicate that a cold core is present at that level during the entire simulation, although it weakens from 28 September at 18:00 UTC (see Fig. 5).
According to these results, we can state that both the fore-cast and the methodology are able to detect and track the cyclone, although thermal features are not well represented. Cyclone strength is underestimated during the forecast pe-riod and the model is not able to forecast the warm-core structure (i.e. the cyclone is not well simulated and therefore not classified as medicane).
3.3 January 1995 event
7 12 17
Wind
2712 2800 2812 2900 2912 3000 3012 1006
1008 1010 1012 1014
Centr
al Pressure
2712 2800 2812 2900 2912 3000 3012 1 2 3 4 5
Mean Pressure Gr
adient (6 dir)
3.2
2718 2806 2818 2906 2918 3006 100
150 200 250 300
Mean Radius
2718 2806 2818 2906 2918 3006 100
150 200 250 300
Mean Radius
2718 2806 2818 2906 2918 3006 0 2 4 6 8 10 12
Geostrophic V
or
ticity
a) b)
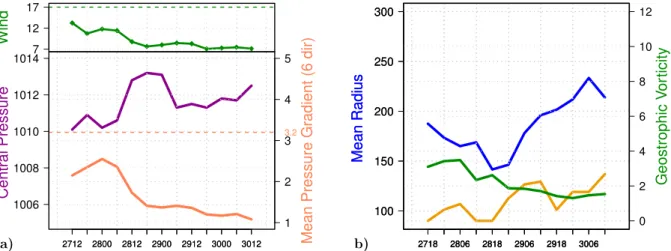
Fig. 4. Evolution over time of (a)gradient wind (m s−1) in green (top) and central pressure (hPa) in violet + Mean pressure
gradi-ent (10−2hPa km−1) in orange (bottom);(b)mean radius (km) in blue + mean warm core radius (km) in orange+geostrophic vorticity (10−4s−1); for 1983 event.
●
●
●
●
● ●
● ● ● ●
●
●
●
−VTL [925−700hPa] Thermal wind
B [925−700hP
a]
Cent. pressure (hPa) 1010−1015 1010−1015 1010−1015 1010−1015 1010−1015 1010−1015 1010−1015 1010−1015 1010−1015 1010−1015 1010−1015 1010−1015 1010−1015
Circulation (107s−1m−2)
●
● 2 4 6 8 Medicane
σ
Intense (but not medicane)
φ Start (A): 1983092712 (H + 00)
End (Z): 1983093012 (H + 72)
A
Z
−60 −40 −20 0 20 40 60 0
5 10 15
Cold Core Warm Core
Symmetr
ic
Asymmetr
ic
(Non frontal)
(Frontal)
Asymmetric Cold Core Asymmetric Warm Core
Symmetric Cold Core Symmetric Warm Core
●
● ●
● ● ●
●● ● ●
● ● ●
−VTL [925−700hPa] Thermal wind
−VTU [700−400hP
a] Ther
mal wind
Medicane
σ
Intense (but not medicane)
φ
Cent. pressure (hPa)
1010 − 1015 1010 − 1015 1010 − 1015 1010 − 1015 1010 − 1015 1010 − 1015 1010 − 1015 1010 − 1015 1010 − 1015 1010 − 1015 1010 − 1015 1010 − 1015 1010 − 1015
Circulation (107s−1m−2)
●
●
●
2 4 6 8
Start (A): 1983092712 (H + 00) End (Z): 1983093012 (H + 72)
A Z
−60 −40 −20 0 20 40 60 −100
−50 0 50 100
Cold Core Warm Core
Cold Core
W
ar
m Core
Deep Warm Core
Deep Cold Core Shallow Warm Core
a) b)
Fig. 5. Cyclone phase diagrams I(a)and II(b), as Fig. 3, for September 1983 event
observed over Sicily at 12:00 UTC on 14 January. A surface low pressure system (called parent low) was evident over the sea west of Greece in MSLP maps, with winds of 22 and 29 m s−1and a pressure of 992.5 hPa reported by ships.
Sensible and latent heat fluxes played a significant role in the deepening of the parent low. Twenty-four hours later, at 12:00 UTC on 15 January, a secondary low was created, it be-came independent of the parent low and it followed a south-ward path. The Meteosat satellite images showed spiral cloud bands around a clearly defined “eye”. By 06:00 UTC on 16 January deep convection clouds were spirally distributed at a radius of 150 km, while lower clouds were evident at a radius of 200 km around the vortex centre. A 23 m s−1
sur-face wind and a relative maximum of air temperature were reported by a ship. The storm dissipated when it reached the northern African coast, on 18 January.
12 17 22
Wind
1418 1506 1518 1606 1000
1005 1010 1015
Centr
al Pressure
1418 1506 1518 1606
1 2 3 4 5 6 7
Mean Pressure Gr
adient (6 dir)
3.2
1418 1506 1518 1606 100
150 200 250 300
Mean Radius
1418 1506 1518 1606 100
150 200 250 300
Mean Radius
1418 1506 1518 1606
0 2 4 6 8 10 12 14
Geostrophic V
or
ticity
a) b)
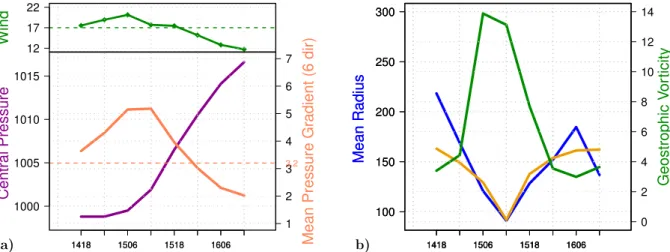
Fig. 6. Evolution over time of(a) gradient wind (m s−1) in green (top) and central pressure (hPa) in violet + mean pressure
gradi-ent (10−2hPa km−1) in orange (bottom);(b)mean radius (km) in blue + mean warm core radius (km) in orange+geostrophic vorticity (10−4s−1); for 1995 event.
●
●
●
●
●
●
●
●
−VTL [925−700hPa] Thermal wind
B [925−700hP
a]
σ
σ
σ
σ
Cent. pressure (hPa)
995−1000 995−1000 995−1000 1000−1005
1005−1010
1010−1015 1010−1015
1015−1020
Circulation (107s−1m−2)
●
● 2 4 6 8 Medicane
σ
Intense (but not medicane)
φ Start (A): 1995011418 (H + 06)
End (Z): 1995011612 (H + 48)
A
Z
−100 −50 0 50 100
−2 0 2 4 6 8 10 12
Cold Core Warm Core
Symmetr
ic
Asymmetr
ic
(Non frontal)
(Frontal)
Asymmetric Cold Core Asymmetric Warm Core
Symmetric Cold Core Symmetric Warm Core
● ●
●
●
●
●
●
●
−VTL [925−700hPa] Thermal wind
−VTU [700−400hP
a] Ther
mal wind
σ
σ
σ
σ Medicane
σ
Intense (but not medicane)
φ
Cent. pressure (hPa)
995 − 1000 995 − 1000 995 − 1000 1000 − 1005
1005 − 1010
1010 − 1015 1010 − 1015
1015 − 1020
Circulation (107s−1m−2)
●
●
●
2 4 6 8
Start (A): 1995011418 (H + 06) End (Z): 1995011612 (H + 48)
A
Z
−100 −50 0 50 100
−60 −40 −20 0 20 40 60
Cold Core Warm Core
Cold Core
W
ar
m Core
Deep Warm Core
Deep Cold Core Shallow Warm Core
a) b)
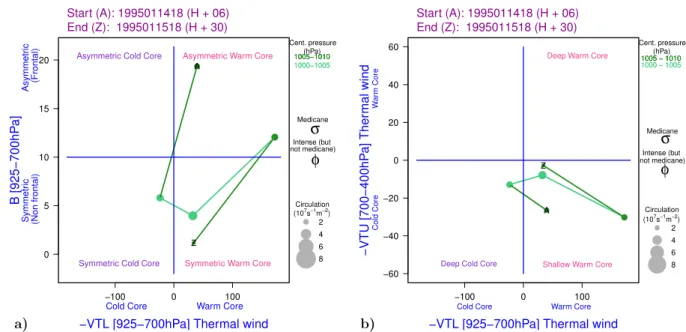
Fig. 7. Cyclone phase diagrams I(a)and II(b), as Fig. 3, for January 1995 medicane.
about 100 km during the most intense period up to around of 140 km. Minimum central pressure value is reached on 14 January at 12:00 UTC, agreeing with observed strong wind but with a higher value than the observed pressure. At 12:00 UTC on 15 January, the medicane is very small, with maximum values of the geostrophic vorticity and of the low level thermal wind (see Fig. 6 and 7). On 16 January the cen-tral pressure continues rising (see Fig. 6a), according with the evolution described in the literature, and the mean pres-sure gradient decreases. As a result the cyclone is identified as a medicane until 16 January, with a lifetime of 24 h. Dur-ing this period, the gradient wind is larger than 17 m s−1(see Fig. 6a). Along the entire simulation, the cyclone follows a
track close to the observed one, travelling towards the Libyan coast.
●
●
●
●
●
−VTL [925−700hPa] Thermal wind
B [925−700hP
a]
Cent. pressure (hPa)
1005−1010
1000−1005 1000−1005
1005−1010 1005−1010
Circulation (107s−1m−2)
●
● 2 4 6 8 Medicane
σ
Intense (but not medicane)
φ Start (A): 1995011418 (H + 06)
End (Z): 1995011518 (H + 30)
A
Z
−100 0 100
0 5 10 15 20
Cold Core Warm Core
Symmetr
ic
Asymmetr
ic
(Non frontal)
(Frontal)
Asymmetric Cold Core Asymmetric Warm Core
Symmetric Cold Core Symmetric Warm Core
●
● ●
●
●
−VTL [925−700hPa] Thermal wind
−VTU [700−400hP
a] Ther
mal wind
Medicane
σ
Intense (but not medicane)
φ
Cent. pressure (hPa)
1005 − 1010
1000 − 1005 1000 − 1005
1005 − 1010 1005 − 1010
Circulation (107s−1m−2)
●
●
●
2 4 6 8
Start (A): 1995011418 (H + 06) End (Z): 1995011518 (H + 30)
A Z
−100 0 100
−60 −40 −20 0 20 40 60
Cold Core Warm Core
Cold Core
W
ar
m Core
Deep Warm Core
Deep Cold Core Shallow Warm Core
a) b)
Fig. 8. Cyclone phase diagrams I(a)and II(b), as Fig. 3, for January 1995 orographic cyclone
12 17 22
Wind
1118 1200 1206 1212 1218 1300 996
998 1000 1002
Centr
al Pressure
1118 1200 1206 1212 1218 1300 1 2 3 4 5 6
Mean Pressure Gr
adient (6 dir)
3.2
1118 1200 1206 1212 1218 1300 100
150 200 250 300
Mean Radius
1118 1200 1206 1212 1218 1300 100
150 200 250 300
Mean Radius
1118 1200 1206 1212 1218 1300 0 2 4 6 8 10 12
Geostrophic V
or
ticity
a) b)
Fig. 9. Evolution over time of (a)gradient wind (m s−1) in green (top) and central pressure (hPa) in violet+mean pressure
gradi-ent (10−2hPa km−1) in orange (bottom);(b)mean radius (km) in blue+mean warm core radius (km) in orange+geostrophic vorticity (10−4s−1); for 1996 event.
As noted by Pytharoulis et al. (2000), the ECMWF T213/L31 version (62 km horizontal resolution), operational in 1995, predicted the translation of the low centre towards the east, but the forecast of the secondary vortex formation failed, because it was too small for this model. The version ECT1279 (15 km horizontal resolution) is capable to simu-late two smaller cyclonic centres, one of them with features of quasi-tropical cyclone. The later version of the model rep-resents an improvement in the description of these structures.
3.4 September 1996 event
On 12 September 1996, a small quasi-tropical cyclone formed in the gulf of Valencia and later affected the Balearic
● ●
●
●● ●
−VTL [925−700hPa] Thermal wind
B [925−700hP
a]
σ
σσ
Cent. pressure (hPa)
1000−1005 1000−1005 1000−1005 1000−1005 1000−1005 1000−1005
Circulation (107s−1m−2)
●
● 2 4 6 8 Medicane
σ
Intense (but not medicane)
φ Start (A): 1996091118 (H + 06)
End (Z): 1996091300 (H + 36)
A Z
−60 −40 −20 0 20 40 60 0
5 10
Cold Core Warm Core
Symmetr
ic
Asymmetr
ic
(Non frontal)
(Frontal)
Asymmetric Cold Core Asymmetric Warm Core
Symmetric Cold Core Symmetric Warm Core
●
●
●
●
●
●
−VTL [925−700hPa] Thermal wind
−VTU [700−400hP
a] Ther
mal wind
σ
σσ
Medicane
σ
Intense (but not medicane)
φ
Cent. pressure (hPa)
1000 − 1005 1000 − 1005 1000 − 1005 1000 − 1005 1000 − 1005 1000 − 1005
Circulation (107s−1m−2)
●
●
●
2 4 6 8
Start (A): 1996091118 (H + 06) End (Z): 1996091300 (H + 36)
A
Z
−60 −40 −20 0 20 40 60 −60
−40 −20 0 20 40 60
Cold Core Warm Core
Cold Core
W
ar
m Core
Deep Warm Core
Deep Cold Core Shallow Warm Core
a) b)
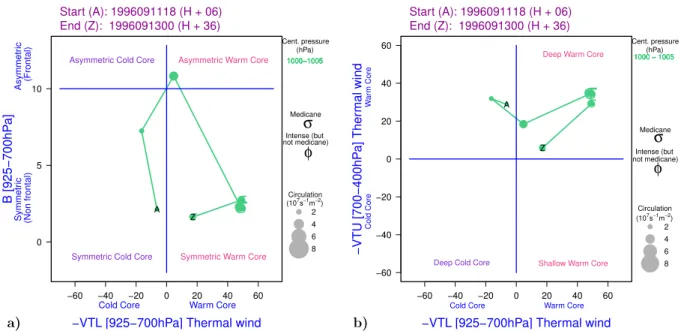
Fig. 10. Cyclone phase diagrams I and II medicane(a, b), as Fig. 3, for September 1996 event
In this case the best simulation started on 11 September at 12:00 UTC, when an extended low pressure centre (300 km of radius) is localised in front of the Algerian coast. Six hours later a secondary centre is detected off-shore Spain, over the sea. During the following hours, the extensive low moves towards north-east, weakening. A secondary low intensifies and six hours later, at 00:00 UTC on 12 September, it is de-tected as an intense and symmetric cyclone but with cold-core structure at low levels. At 06:00 UTC on 12 Septem-ber, the minimum central pressure value is reached although far from the observed value, gradient wind reaches 17 ms−1 (see Fig. 9a), and a deep warm core begins to form, but the small cyclone is slightly asymmetric (see Fig. 10). During the following hours, the vortex moves north-eastwards and becomes symmetric and, according to their position in the phase diagrams, it is classified as a medicane. The gradi-ent wind reaches 18 m s−1, its maximum value (see Fig. 9a).
At 18:00 UTC on 12 September it is located at south-west of Majorca, with a delay of 6 h compared to the observed track (see Fig. 1). At this moment the geostrophic vorticity reaches its maximum value, the medicane is very symmet-ric and small and a pronounced deep warm core is present (see Fig. 10). Six hours later the medicane weakens. Along the whole lifetime the cyclone is small, with a 100–140 km radius (see Fig. 9b).
The cyclone is classified by the procedure as a medicane during 18 h. From the comparison of the forecast cyclone track against the track from observations it can be established that the medicane evolution is delayed 6 hours. The forecast pressure values are higher than the observed ones. In this case the cyclone has been poorly simulated; probably a higher res-olution model would be needed to represent it correctly.
4 Summary and discussion
A method to detect and describe small and intense cyclonic structures, in particular medicanes, from NWP model out-puts is presented. This method has been developed from ex-isting methodologies to identify cyclones and to study their life cycle in the cyclone phase space that have been adapted to the characteristics of the medicanes, in an attempt to con-tribute to the development and complementing methodolo-gies that have been developed in the last years by different authors. Medicanes are small and intense cyclonic structures with strong pressure gradient, related to the presence of very strong winds and a thermal structure characterised by the presence of a warm core, in which development and main-tenance the heat flows from the land–sea interaction and the convective heat release play a key role. The medicanes de-velop mainly on the sea, so in areas where observations are scarce, which can make difficult to track them accurately and sometimes can make unnoticed these phenomena, especially in cases in which land areas are not affected. Therefore, the systematic and automatic detection of these phenomena from the outputs of NWP models is presented as a good choice to obtain climatology of these phenomena and to improve the prediction of severe phenomena accompanying the med-icanes.
cyclone, described in the literature as quasi-tropical cyclone, is forecasted as not being strong enough to be considered a medicane and the model is not able to forecast the deep warm-core structure. In general the pressure value in the cy-clone centre is higher than observed, although the model sim-ulates very well the intensification and variations in the size of these cyclones. Forecast chain runs from ERA-40 anal-yses, with a resolution too low to describe small cyclones, therefore small cyclones can be properly characterised from H+06, when the ECT1279 model has already been able to simulate the deepening of the cyclone.
In order to adapt the method to the characteristics of med-icanes and to establish selection criteria to discriminate dif-ferent typologies of small intense cyclones, the existing pro-cedures have been modified in two main ways: a more re-strictive selection criteria has been introduced to select small intense cyclones and thermal parameters have been calcu-lated by using a storm-size-dependent circle around the clone centre. In summary, three criteria to identify a cy-clone as a medicane, according with their strength and their thermal structure, have been established: the cyclone must be intense, 1p≥3.210−2hPa km−1, thermally symmetric,
B <10 m, and a warm-core structure must be present in the
low–middle and in the upper troposphere, that is,−VTL>0 and−VTU>0. For the 1982 and 1995 events the detected cy-clone is identified as a medicane according to the proposed criteria along much of the simulation. For the 1996 event the cyclone is initially symmetric, but with cold-core structure, and becomes medicane only twelve hours after its formation. In the phase diagrams the systems are classified as symmet-ric deep warm core. Besides, for the 1995 event a weak oro-graphic cyclone has been detected and it has been success-fully differentiated from the medicanes by using the phase diagrams. In all four cases the simulated cyclone tracks are close to the corresponding observed paths, although from the 1996 medicane the evolution is delayed 6 h regarding the ob-servation.
Comparing our results with those obtained in previous studies based on a larger number of cases, three of four cy-clones are developed in two preferred areas of occurrence, the Ionian Sea and the surroundings of the Balearic Islands, identified by Miglietta et al. (2013) and in agreement with Tous and Romero (2013). Another cyclone developed west of Sardinia, a region where other medicanes are also located in the two aforementioned papers. We can summarise that in three of four cases an intense small cyclone is forecasted with appropriate thermal structure, that is, it is symmetric and with a deep warm core. Warm-core radii vary from about 90 km during the most intense period up to around of 180 km. Cy-clone radii range from 90 km, at the time when medicane is reduced, up to 250 km, corresponding to parent lows. These values are slightly higher than that obtained by Tous and Romero (2013) and Miglietta et al. (2013), as it can be seen in Table 1 of both papers. These small differences were
ex-pected because different methods have been used to measure them. Besides, the initial state of the cyclone can include ex-tensive cyclone phase corresponding to the parent low. The total lifetime of the cyclone is generally shorter than that ob-tained by Tous and Romero (2013); however, the time that has characteristics of quasi-tropical cyclone is higher than that obtained by Miglietta et al. (2013). Gradient wind varies from 13–20 m s−1and it reaches its maximum values, larger than 17 m s−1, when the system is classified as medicane.
Thereby, in all three cases a medicane is simulated. The ECT1279 forecast model allows for describing medicanes, at least the larger ones, although with some limitations, and an objective description of medicanes can be obtained by means the automatic procedure.
Although the model used here presents some limitations, the obtained results are acceptable. The model used here is capable of simulating intense storms and, therefore, is ade-quate to validate the adapted procedure and to establish the criteria that define a medicane; however, scarcity of obser-vations over the sea is a major drawback in the forecast of medicanes. The improvement of initials conditions (e.g. by means of remote sensing data) will lead to a better prediction of these phenomena. Besides, improvements can be achieved increasing the model resolution and especially by means of high-resolution convection-permitting models.
The three proposed criteria seem to be useful for identify-ing medicanes. By means of these criteria, we try to discrim-inate mainly between medicanes and other small cyclones. The phase diagrams offer a convenient way to describe and classify the cyclone and, jointly with the tracks, give a fairly complete and detailed description.
Acknowledgements. The authors are grateful to J. A. García-Moya (AEMET, Madrid) who performed the ECMWF simulations. This work has been partially supported by the MEDICANES (CGL200801271) project. We would also like to thank two anonymous reviewers for their valuable comments and suggestions that have improved this paper.
Edited by: E. Richard
Reviewed by: two anonymous referees
References
Campins, J., Jansà, A., and Genovés, A.: Three-dimensional struc-ture of western Mediterranean cyclones, Int. J. Climatol., 26, 323–343, 2006.
Campins, J., Genovés, A., Picornell, M. A., and Jansà, A.: A first analysis of the large-scale cyclonic environments that lead to medicane development, 11th Plinius Conference on Mediter-ranean Storms, Barcelona, Spain, 7–10 September 2009, Plinius, 11–46, 2009.
Cavicchia, L.: A long-term climatology of medicanes, PhD Thesis, Ca’Foscari University of Venice, Venice, 121 pp., 2013. Cavicchia, L. and von Storch, H.: The simulation of medicanes in
a high-resolution regional climate model, Clim. Dyn., 39, 2273– 2290, 2012.
Chaboureau, J.-P., Pantillon, F., Lambert, D., Richard, E., and Claud, C.: Tropical transition of a Mediterranean storm by jet crossing, Q. J. R. Meteorol. Soc., 138, 596–611, 2012.
Davolio, S., Miglietta, M. M., Moscatello, A., Pacifico, F., Buzzi, A., and Rotunno, R.: Numerical forecast and analysis of a tropical-like cyclone in the Ionian Sea, Nat. Hazards Earth Syst. Sci., 9, 551–562, doi:10.5194/nhess-9-551-2009, 2009. Emanuel, K.,: Genesis and maintenance of “Mediterranean
hurri-canes”, Ad. Geo., 2, 217–220, 2005.
Ernst, J. A. and Matson, M.: A Mediterranean tropical storm?, Weather, 38, 332–337, 1983.
Fita, L., Romero, R., Luque, A., Emanuel, K., and Ramis C.: Anal-ysis of the environments of seven Mediterranean tropical-like storms using an axisymmetric, nonhydrostatic, cloud resolving model, Nat. Hazards Earth Syst. Sci., 7, 1–16, 2007,
http://www.nat-hazards-earth-syst-sci.net/7/1/2007/.
Gili, M. A., Jansà, A., Riesco J., and García-Moya, J. A.: Quasi-tropical cyclone on 12th September 1996 in the Balearics, INM-WMO International Symposium on Cyclones and Hazardous Weather in the Mediterranean, Palma de Mallorca, Spain, 14–17 April 1997, 143–150, 1997.
Hart, R. E.: A cyclone phase space derived from thermal wind and thermal asymmetry, Mon. Wea. Rev., 131, 585–616, 2003. Hart, R. E. and Evans, J. L.: Real-time use of cyclone phase
di-agrams to improve structural diagnosis and forecasting, 26th Conference on Hurricanes and Tropical Meteorology, Miami, Florida, 3–7 May 2004, P1–87, 2004.
Homar, V., Romero, R., Stensrud, D. J., Ramis, C., and Alonso, S.: Numerical diagnosis of a small, quasi-tropical cyclone over the western Mediterranean: Dynamical vs. boundary factors, Q. J. R. Meteorol. Soc., 129, 1469–1490, 2003.
Jansà, A.: Saharian Advections in the West Mediterranean Alge-rian Cyclogenesis. Heavy Rain, Gravity Waves, WMO PSMP Report Series no. 26, WMO Workshop on Limited Area
Fine-Mesh Models for the Mediterranean Region, Erice, Italy, 17–20 November 1986, 51–67, 1987.
Jansà, A.: Miniciclons a la Mediterrània, IX Jornades de Meteorolo-gia Eduard Fontserà, Barcelona, Spain, 28–30 November 2003, 75–85, 2003.
Lagouvardos, K., Kotroni, V., Nickovic, S., Jovic, D., Kallos, G., and Tremback, C. J.: Observations and model simulations of a winter sub-synoptic vortex over the central Mediterranean, Met. Apps., 6, 371–383, 1999.
Mayençon, R.: Warm-core cyclones in the Mediterranean, in: Re-port of the Informal Consultation on Mediterranean Cyclones (PSMP Rep. Ser. No.3), Sofia, Bulgaria, 8 November–1 Decem-ber 1983, 145–157, 1984.
Miglietta, M. M., Moscatello, A., Conte, D., Mannarini, G., Laco-rata, G., and Rotunno, R.: Numerical analysis of a Mediterranean “hurricane” over south-eastern Italy: Sensitivity experiments to sea surface temperature, Atmos. Res., 101, 412–426, 2011. Miglietta, M., Laviola, S., Malvaldi, A., Conte, D., Levizzani,
V., and Price, C.: Analysis of tropical-like cyclones over the Mediterranean Sea through a combined modeling and satellite approach, Geophys. Res. Lett., 40, 2400–2405, 2013.
Moscatello, A., Miglietta, M., and Rotunno, R.: Observational anal-ysis of a Mediterranean ’hurricane’ over south-eastern Italy, Weather, 63, 306–311, 2008.
Palmén, E. and Newton, C. H.: Atmospheric circulation systems: their structure and physical interpretation, Vol. 603, New York, Academic Press, 1969.
Picornell, M. A., Jansà, A., Genovés, A., and Campins, J.: Auto-mated database of mesocyclones from the HIRLAM(INM) 0.5 analyses in the Western Mediterranean, Int. J. Climatol., 21, 335– 354, 2001.
Pytharoulis, I., Craig, G., and Ballard, S.: The hurricane-like Mediterranean cyclone of January 1995, Met. Apps , 7, 261–279, 2000.
Rasmunssen, E. and Zick, C.: A subsynoptic vortex over the Mediterranean with some resemblance to polar lows, Tellus A, 39, 408–425, 1987.
Reed, R. J., Kuo, Y. H., Albright, M.D., Gao, K., Guo, Y. R., and Huang, W.: Analysis and modeling of a tropical-like-cyclone in the Mediterranean Sea, Meteorol. Atmos. Phy., 7, 183–202, 2001.
Romero, R. and Emanuel, K.: Space time probability density of Mediterranean hurricane genesis in the light of an empirical tropical index, in: V Asamblea Hispano-Portuguesa de Geode-sia y Geofísica V Assembleia Luso-Espanhola de GeodeGeode-sia e Geofísica : proceedings, Sevilla, Spain, 30 January-3 February 2006, CD-Rom, ISBN 84-8320-373-1, 2006.
Romero, R., and Emanuel, K.: Medicane risk in a changing climate, J. Geophys. Res. Atmos., 118, 5992–6001, 2013.
Tous, M. and Romero, R.: Medicanes: criteris de catalogació i ex-ploració dels ambient meteorològics, Tethys, 8, 53–61, 2011. Tous, M. and Romero, R.: Meteorological environments associated
with medicane development, Int. J. Climatol., 33, 1–14, 2013. Walsh, K., Giorgi, F., and Coppola, E.: Mediterranean warm-core