AMTD
7, 3321–3348, 2014The influence of temperature calibration on the
OC-EC results
J. Pavlovic et al.
Title Page
Abstract Introduction
Conclusions References
Tables Figures
◭ ◮
◭ ◮
Back Close
Full Screen / Esc
Printer-friendly Version Interactive Discussion
Discussion
P
a
per
|
D
iscussion
P
a
per
|
Discussion
P
a
per
|
Discuss
ion
P
a
per
|
Atmos. Meas. Tech. Discuss., 7, 3321–3348, 2014 www.atmos-meas-tech-discuss.net/7/3321/2014/ doi:10.5194/amtd-7-3321-2014
© Author(s) 2014. CC Attribution 3.0 License.
Atmospheric Measurement
Techniques
Open Access
Discussions
This discussion paper is/has been under review for the journal Atmospheric Measurement Techniques (AMT). Please refer to the corresponding final paper in AMT if available.
The influence of temperature calibration
on the OC-EC results from a dual optics
thermal carbon analyzer
J. Pavlovic1, J. S. Kinsey2, and M. D. Hays2
1
Oak Ridge Institute for Science and Education, Oak Ridge, TN 37831, USA
2
US Environmental Protection Agency, Office of Research and Development, National Risk Management Research Laboratory, Research Triangle Park, NC 27711, USA
Received: 25 January 2014 – Accepted: 18 March 2014 – Published: 1 April 2014
Correspondence to: J. S. Kinsey ([email protected])
AMTD
7, 3321–3348, 2014The influence of temperature calibration on the
OC-EC results
J. Pavlovic et al.
Title Page
Abstract Introduction
Conclusions References
Tables Figures
◭ ◮
◭ ◮
Back Close
Full Screen / Esc
Printer-friendly Version Interactive Discussion
Discussion
P
a
per
|
D
iscussion
P
a
per
|
Discussion
P
a
per
|
Discuss
ion
P
a
per
|
Abstract
Thermal-optical analysis (TOA) is a widely used technique that fractionates carbona-ceous aerosol particles into organic and elemental carbon (OC and EC), or carbonate. Thermal sub-fractions of evolved OC and EC are also used for source identification and apportionment; thus, oven temperature accuracy during TOA analysis is essential.
5
Evidence now indicates that the “actual” sample (filter) temperature and the tempera-ture measured by the built-in oven thermocouple (or set-point temperatempera-ture) can differ by as much as 50◦C. This difference can affect the OC-EC split point selection and consequently the OC and EC fraction and sub-fraction concentrations being reported, depending on the sample composition and in-use TOA method and instrument. The
10
present study systematically investigates the influence of an oven temperature calibra-tion procedure for TOA. A dual-optical carbon analyzer that simultaneously measures transmission and reflectance (TOT and TOR) is used, functioning under the conditions of both the NIOSH 5040 and IMPROVE protocols. Application of the oven calibra-tion procedure to our dual optics instrument significantly changed NIOSH 5040 carbon
15
fractions (OC and EC) and the IMPROVE OC fraction. In addition, the well-known OC-EC split difference between NIOSH and IMPROVE methods is even further perturbed following the instrument calibration. Further study is needed to determine if the wide-spread application of this oven temperature calibration procedure will indeed improve accuracy and our ability to compare among carbonaceous aerosol studies that use
20
TOA.
1 Introduction
The Interagency Monitoring of Protected Visual Environment (IMPROVE, outlined by Chow et al., 1993) and National Institute of Occupational Safety and Health Method 5040 (NIOSH, 1996) thermal-optical analysis (TOA) methods have been used widely
25
AMTD
7, 3321–3348, 2014The influence of temperature calibration on the
OC-EC results
J. Pavlovic et al.
Title Page
Abstract Introduction
Conclusions References
Tables Figures
◭ ◮
◭ ◮
Back Close
Full Screen / Esc
Printer-friendly Version Interactive Discussion
Discussion
P
a
per
|
D
iscussion
P
a
per
|
Discussion
P
a
per
|
Discuss
ion
P
a
per
|
(EC) concentrations in ambient and combustion source samples. In addition, diff er-ences in the OC and EC sub-fractions were useful in distinguishing between diesel and gasoline emissions (Watson et al., 1994; Kim and Hopke, 2004, 2005), in char-acterizing different source and combustion profiles (Watson and Chow, 2001; Chow et al., 2011), and in estimating the source contributions to suspended particulate
mat-5
ter (Chow et al., 2004a; Kim and Hopke, 2004, 2005; Lee at al., 2003; Maykut et al., 2003).
NIOSH and IMPROVE carbon fractions have been determined traditionally with in-strumentation developed by Sunset Laboratory (Tigard, OR) and Desert Research In-stitute (DRI, Reno, NV), respectively. Not only are there hardware design and
configu-10
rational differences between these instruments, but the protocols differ operationally in temperature programming and optical monitoring, as described by Chow et al. (2001) whereby different OC and EC values can be obtained for many sample types. In one ex-ample of how protocols differ, the maximum burn-offtemperatures used by the NIOSH method are higher (usually 870◦C for the OC and 890◦C for the EC) than those used
15
in the IMPROVE protocol (usually 550◦C for the OC and 850◦C for the EC). Since the concentrations of OC and EC are fully operationally defined and dependent on temperature, the accuracy in temperature setting is therefore essential for the analysis. In a previous study, Chow et al. (2005) evaluated temperature bias (target sample oven temperature vs. measured temperature) in three thermal-optical instruments (two
20
DRI models and one Sunset instrument) and the effect of the bias on the concentration of the IMPROVE OC and EC fractions. OC and EC sub-fractions were considered for the DRI 2001 model only. A temperature bias of up to 50◦C was observed, but did not influence the OC and EC concentrations measured with the IMPROVE protocol. Limitations of the temperature calibration method for the DRI analyzer include use of
25
AMTD
7, 3321–3348, 2014The influence of temperature calibration on the
OC-EC results
J. Pavlovic et al.
Title Page
Abstract Introduction
Conclusions References
Tables Figures
◭ ◮
◭ ◮
Back Close
Full Screen / Esc
Printer-friendly Version Interactive Discussion
Discussion
P
a
per
|
D
iscussion
P
a
per
|
Discussion
P
a
per
|
Discuss
ion
P
a
per
|
are available not at real operating filter temperatures. More recently, Phuah et al. (2009) confirmed the oven-filter temperature discrepancy on four different Sunset Laboratory instruments and reported statistically insignificant differences for the IMPROVE TC, OC, and EC concentrations after temperature calibration. The calibration method de-veloped in that study involved a simple hardware change by way of a temperature
5
probe introduction that did not harm the instrument. However, further information about the effect of oven calibration for the widely applied NIOSH protocol was not offered in Phuah et al. (2009).
The present study measured and corrected the temperature bias but also evaluated the effect of oven temperature calibration on the OC and EC concentrations and the
10
relevant OC-EC sub-fractions considering both the NIOSH and IMPROVE protocols. This aim is accomplished using a single dual-optics TOA instrument capable of mea-suring reflectance (TOR) and transmittance (TOT) simultaneously and running both NIOSH and IMPROVE protocols. Additional experimental benefits of using the dual op-tics analyzer are presented in Khan et al. (2012). The temperature calibration kit that
15
was used in the present study is now available from the manufacturer (Sunset Labo-ratory; Tigard, OR) together with software. At the time when this study was performed it was not commercially available. Our results suggest the presence of a linear oven vs. filter temperature bias that can be corrected through calibration. Possible causes of the bias are the oven thermocouple position in the dual optics instrument used in the
20
present study, and the non-uniform distribution of heating coils around the filter zone and in the sample oven as suggested by Phuah et al. (2009). In addition, NIOSH (TOT) and IMPROVE (TOT and TOR) results from the same laboratory-generated samples were compared statistically before and after calibration to see how OC and EC and sub-fractions are influenced.
AMTD
7, 3321–3348, 2014The influence of temperature calibration on the
OC-EC results
J. Pavlovic et al.
Title Page
Abstract Introduction
Conclusions References
Tables Figures
◭ ◮
◭ ◮
Back Close
Full Screen / Esc
Printer-friendly Version Interactive Discussion
Discussion
P
a
per
|
D
iscussion
P
a
per
|
Discussion
P
a
per
|
Discuss
ion
P
a
per
|
2 Experimental section
2.1 Test aerosols
Aerosols were produced using a diffusion flame aerosol generator (5201 Mini-CAST burner, Jing, Zollikofen, Switzerland) and collected on 47 mm pre-baked (550◦C for 12 h) quartz fiber filters (Pall Co., Port Washington, NY). The propane-fueled
Mini-5
CAST enables controlled and generally repeatable (±5 %) aerosol output in terms of particle size distribution, the number concentration, and the chemical composition. The morphology of soot particles from the Mini-CAST is comparable to the soot particles from diesel exhaust (Jing, 1999). The aerosols were produced under different Mini-CAST operating conditions (different air/fuel ratios) that result in different percentages
10
of the EC and OC in the final aerosol samples. Lean flame (lower propane/air ratio) re-sults in the formation of aerosol with a higher concentration of the EC compared to OC, while the richer flame (higher propane/air ratio) creates aerosol with a larger amount of OC than EC. Note that this study examinesonly the influence of temperature calibra-tion on the carbon results measured under different TOA protocols in the same sample
15
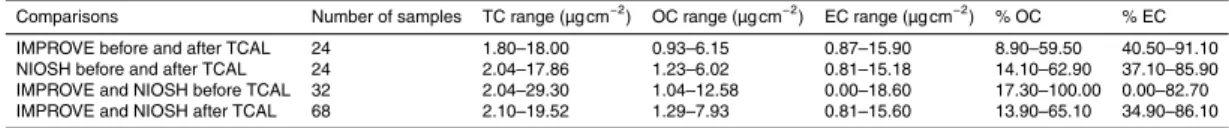
(quartz filter), and not the representativeness of the diffusion flame aerosol to the wide range of source and ambient samples. Response of the system might be different in the presence of highly oxidized species found in ambient samples. However, the use of Mini-CAST and laboratory generated soot allowed a wide range of OC-TC (9–100 % OC) and EC-TC (0–91 % EC) ratios to be evaluated (Table 1) and this range was
com-20
AMTD
7, 3321–3348, 2014The influence of temperature calibration on the
OC-EC results
J. Pavlovic et al.
Title Page
Abstract Introduction
Conclusions References
Tables Figures
◭ ◮
◭ ◮
Back Close
Full Screen / Esc
Printer-friendly Version Interactive Discussion
Discussion
P
a
per
|
D
iscussion
P
a
per
|
Discussion
P
a
per
|
Discuss
ion
P
a
per
|
2.2 Carbon analyzer and temperature protocols
A dual optics carbon analyzer (Sunset Laboratory; Tigard, OR) which measured filter transmittance (TOT) and reflection (TOR) simultaneously was used in this study. Sam-ples were analyzed using two temperature protocols: (1) adjustment modified version of the Birch and Cary (1996) NIOSH protocol (referred to in this paper as the NIOSH
5
5040 protocol), and (2) the IMPROVE protocol as outlined by Chow et al. (1993) and referred to in this paper as the IMPROVE protocol. Details about the residence time and temperature ramp rate (◦C s−1) set-points for the NIOSH 5040 and IMPROVE pro-tocol can be found in Table 2. The residence times at each temperature step within the He and He-O2 phases are fixed for the NIOSH, but vary for the IMPROVE depending
10
on the sample composition. The IMPROVE protocol does not ramp the temperature until the flame ionization detector (FID) signal returns to its baseline.
It must be noted that the original NIOSH 5040 method (NIOSH, 1996) does not spec-ify temperatures for either OC (He phase) or EC (He-O2 phase) step, or the temper-atures required to measure different OC and EC sub-fractions. Birch and Cary (1996)
15
used 820◦C as the maximum temperature for OC and 860◦C as the maximum tem-perature for EC, while two years later Birch (1998) employed a temtem-perature program with maximum temperature for OC at 850◦C and 940◦C for the EC determination. Those later temperatures were adopted in the revised version of the NIOSH 5040 offi -cial method (NIOSH, 1999) but again without defining temperature ramps for OC and
20
EC sub-fractions. In summary, the NIOSH 5040 protocol only outlines the necessary principles for operation without detailing individual temperature parameters. As a re-sult, different variations of the NIOSH temperature program and temperature ramps are available in the literature that make data comparison among studies difficult. The present study used a protocol that is comparable to what other studies have recently
25
AMTD
7, 3321–3348, 2014The influence of temperature calibration on the
OC-EC results
J. Pavlovic et al.
Title Page
Abstract Introduction
Conclusions References
Tables Figures
◭ ◮
◭ ◮
Back Close
Full Screen / Esc
Printer-friendly Version Interactive Discussion
Discussion
P
a
per
|
D
iscussion
P
a
per
|
Discussion
P
a
per
|
Discuss
ion
P
a
per
|
The “old” IMPROVE temperature protocol used in the present study is described in detail by Chow et al. (1993), except that temperature for the last EC sub-fraction (EC3) is modified from original 800◦C to 850◦C. The new IMPROVE protocol termed “IM-PROVE_A protocol” (Chow et al., 2007) differs from the “old” IMPROVE protocol in 20– 40◦C higher temperature steps. The new protocol is the result of a temperature
calibra-5
tion performed on five DRI/OGC analyzers (Chow et al., 2005) that attempts to correct the bias between the oven thermocouple sensors and the actual sample temperatures. The calibration results found that the actual sample temperatures (filter location) were 20–40◦C higher than required by the “old” IMPROVE target (set-point) temperatures due to the new hardware used in new DRI Model 2001 analyzers. Given that the
pur-10
pose of the present study was to perform an independent calibration of the dual-optics carbon analyzer that is different in design than a DRI instrument, the “old” IMPROVE temperature protocol was used in order to independently measure temperature biases for the Sunset dual optical carbon analyzer under the IMPROVE temperature ramps.
2.3 Temperature calibration
15
The temperature calibration kit was provided by the manufacturer of the dual-optics TOA instrument and is designed to satisfy QA/QC requirements, increase the reliability of carbon results, and improve inter-instrument comparisons. The calibration kit con-sisted of a serial temperature data acquisition unit (precision±0.3◦C for temperature range −80–500◦C and ±0.55◦C for the 500–1350◦C range (Model MDSi8, Omega
20
Engineering, Stamford, CT), NIST-traceable thermocouple (type-K), and front oven in-terface hardware. The thermocouple is an Inconel shielded K-type thermocouple certi-fied for high temperatures required by the experiment (Omega Engineering Calibration Report # OM-110802626) with 1/16” sheath diameter. Thermocouple-produced tem-perature data were recorded at a frequency of 1 Hz and with 0.1◦C resolution. For
25
AMTD
7, 3321–3348, 2014The influence of temperature calibration on the
OC-EC results
J. Pavlovic et al.
Title Page
Abstract Introduction
Conclusions References
Tables Figures
◭ ◮
◭ ◮
Back Close
Full Screen / Esc
Printer-friendly Version Interactive Discussion
Discussion
P
a
per
|
D
iscussion
P
a
per
|
Discussion
P
a
per
|
Discuss
ion
P
a
per
|
All temperatures reported here asTFILTER (measured by the calibration thermocou-ple) represent the temperatures measured in the center of the filter, while in practice there will be gradients across the filter. In addition, it should be noted here that the quartz boat with filter media used during the normal instrument operation compared with the calibration thermocouple might experience different heating rates inside the
5
front oven of the instrument, given that the heat capacity of the contents inside the oven is different. However, this study focused on the temperatures recorded only when they reach steady state for the each temperature step. Assumption for this study was that at steady state temperature of the quartz boat with filter inside of the front oven will be the same as the steady state temperature recorded during the calibration with
10
the thermocouple.
The tip of the oven calibration thermocouple was positioned where the center of the quartz filter typically resides during TOA operation which is about 2 cm upstream of the thermocouple used to monitor oven temperature (Fig. S1 – Supplement). This also happens to be where the laser beam (λ=632.8 nm) used to monitor pyrolysis
15
passes through the filter. Oven calibrations were performed using both the NIOSH 5040 and IMPROVE temperature operating conditions. Details about residence time and temperature ramp rate (◦C s−1) set-points for the NIOSH 5040 protocol can be found elsewhere (Khan et al., 2012) and in Table 2. For calibration during the IMPROVE protocol, the residence time at each temperature step was 120 s.
20
Two temperatures were recorded during the oven calibration routine: TOVEN as measured by the built-in oven temperature sensor and TFILTER as measured by the calibration kit. Both temperatures were recorded when the readings for the sample oven (TOVEN) were stable at each setpoint temperature (TSETPOINT) required by the NIOSH 5040 and IMPROVE protocol for each temperature step. Before calibration
25
AMTD
7, 3321–3348, 2014The influence of temperature calibration on the
OC-EC results
J. Pavlovic et al.
Title Page
Abstract Introduction
Conclusions References
Tables Figures
◭ ◮
◭ ◮
Back Close
Full Screen / Esc
Printer-friendly Version Interactive Discussion
Discussion
P
a
per
|
D
iscussion
P
a
per
|
Discussion
P
a
per
|
Discuss
ion
P
a
per
|
TFILTER=TSETPOINT. In other words, coefficient values were adjusted to force the tem-perature at the sample oven thermocouple (TOVEN) to reflect the value required to achieve TSETPOINT at the filter because TOVEN6=TFILTER either before or after the cal-ibration. For each TOA method (NIOSH 5040 and IMPROVE), the oven calibration procedure was performed in triplicate with the calibration unit removed and then
re-5
placed for each trial. This was accomplished before adjustment of the temperature co-efficients. After the coefficients were adjusted in the software, the calibration/checking procedure was performed again in triplicate to measure and recordTFILTERduring each temperature step required by NIOSH 5040 and IMPROVE methods and to be sure that
TFILTER=TSETPOINT.
10
2.4 Sample analysis
For the IMPROVE protocol, both TOT and TOR results were used to evaluate the effect of the oven temperature calibration (TCAL) on the OC-EC fractionation. For NIOSH 5040, only TOT results were considered. The following scenarios for sample analysis were compared in the present study: (a) IMPROVE carbon fractions and sub-fractions
15
before and after TCAL (TOT and TOR); (b) NIOSH carbon fractions and sub-fractions before and after TCAL (TOT); and (c) IMPROVE vs. NIOSH carbon fractions before and after TCAL. A summary of the tests performed is shown in Table 1. For each filter sam-ple (n≥12), four punches (1.5 cm2) were taken and analyzed by TOA. For (a) and (b), two punches each were analyzed before and after the TCAL was performed. For (c),
20
two punches each were analyzed using the IMPROVE and NIOSH protocols. These duplicate sample measurements allowed evaluation of reproducibility and sample ho-mogeneity. Acceptance criteria for duplicate measurements are based on the relative percent difference (RPD) of the duplicate measurements. The acceptance criterion for samples at low filter loadings (≤5 µg cm−2) is≤20 % RPD; at medium filter loadings
25
AMTD
7, 3321–3348, 2014The influence of temperature calibration on the
OC-EC results
J. Pavlovic et al.
Title Page
Abstract Introduction
Conclusions References
Tables Figures
◭ ◮
◭ ◮
Back Close
Full Screen / Esc
Printer-friendly Version Interactive Discussion
Discussion
P
a
per
|
D
iscussion
P
a
per
|
Discussion
P
a
per
|
Discuss
ion
P
a
per
|
and after TCAL. Pairedt tests were performed to determine whether the calibration produced statistically different concentrations for TC, OC, and EC and sub-fractions for both methods, or if significant differences were observed when comparing the NIOSH method with the IMPROVE protocol and their main carbon fractions before and after TCAL. Concentrations were statistically different if the null hypothesis was rejected at
5
P <0.05. Depending on the sign of the average difference (y−x) and if the average ratio (y/x) is greater than or less than 1, one can infer if the calibration produced sig-nificantly higher or lower results than those obtained without temperature calibration. Linear regression results (slope,y intercept, and correlation coefficient,r) were used to evaluate equivalence and comparability of carbon concentrations before and after
10
TCAL and between the IMPROVE and NIOSH methods to gain improved understand-ing of the impact of calibration. Criteria described by the US Environmental Protection Agency (EPA, 1997) for PM2.5 Federal Equivalent Methods (FEM) to meet the equiv-alence requirements when compared with a Federal Reference Method (FRM) were used in this study. Equivalence is achieved when the regression slope is 1±0.05, the
15
regression intercept 0±1 µg cm−2, and r≥0.97. Comparability criteria were adopted as described in detail by Watson and Chow (2002). Comparability is achieved when the slope equals unity within three standard deviations or average of ratios (y/x) equal unity within one standard deviation, the intercept does not differ from zero within three standard deviations, andr >0.90.
20
3 Results and discussion
3.1 Temperature calibration results
Table 2 summarizes temperatures required (TSETPOINT) at each programmed step and the averageTFILTERmeasured by the calibration kit, along with the average temperature deviations (% difference) for the dual optics analyzer tested as part of the current study.
25
AMTD
7, 3321–3348, 2014The influence of temperature calibration on the
OC-EC results
J. Pavlovic et al.
Title Page
Abstract Introduction
Conclusions References
Tables Figures
◭ ◮
◭ ◮
Back Close
Full Screen / Esc
Printer-friendly Version Interactive Discussion
Discussion
P
a
per
|
D
iscussion
P
a
per
|
Discussion
P
a
per
|
Discuss
ion
P
a
per
|
systematically lower thanTSETPOINTprior to calibration. This was presumably due to: (1) the unique location of each thermocouple as shown previously in Fig. S1, and (2) as al-ready indicated due to different allocation of heating coils around the sample boat and in the sample oven. Phuah et al. (2009) attributed the lowerTFILTERtemperatures to the less tightly packed heating coils around the quartz tube where the transmittance laser
5
passes compared to the tightly-packed heating coils in the sample oven. These existing instrument limitations most likely resulted in mean temperature difference or bias (∆T) betweenTSETPOINT and TFILTER measured in this study between 32
◦
C and 75◦C. The
∆T observed is less at low temperatures (≤43◦C for temperatures ≤450◦C) than at high temperatures (≤75◦C for temperatures≤890◦C). The∆T under the NIOSH and
10
IMPROVE protocols varied at theTSETPOINTof 550 ◦
C. Inherent to the NIOSH tempera-ture protocol was a higher∆T (70◦C) at the He-O2introduction step where temperature declines from 870◦C to 550◦C. The high∆T at that particular step is presumably due to the wide temperature gap (870◦C to 550◦C) and short residence time.
Consistent with our findings, Phuah et al. (2009) observed ∆T values of 35–85◦C
15
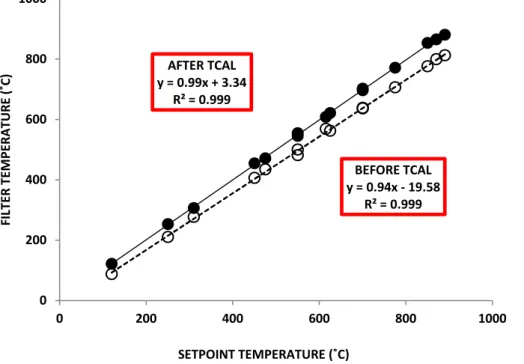
that varied with each Sunset laboratory instrument, while Chow et al. (2005) found that∆T depends on the temperature ramp. Chow et al. (2005) did not observe a lin-ear correlation betweenTFILTER and TSETPOINT, although Phuah et al. (2009) and the present study do indicate such a correlation. Figure 1 shows thatTFILTERandTSETPOINT relationship is linear based on temperature data obtained at nine NIOSH and six
IM-20
PROVE temperatures that precede calibration. Regression analysis shows the slope approaching unity (0.94±0.01) but lower than the values measured on four other Sunset Laboratories instruments by Phuah et al. (2009). A regression correlation (r=1.000; R2=0.999) suggests that the TSETPOINT can be systematically increased untilTFILTER=TSETPOINT and TFILTER meets the TSETPOINT requirements of NIOSH and
25
IMPROVE protocols.
AMTD
7, 3321–3348, 2014The influence of temperature calibration on the
OC-EC results
J. Pavlovic et al.
Title Page
Abstract Introduction
Conclusions References
Tables Figures
◭ ◮
◭ ◮
Back Close
Full Screen / Esc
Printer-friendly Version Interactive Discussion
Discussion
P
a
per
|
D
iscussion
P
a
per
|
Discussion
P
a
per
|
Discuss
ion
P
a
per
|
550◦C−890◦C, ∆T was≤9◦C compared with ∆T ≤75◦C before TCAL. The TFILTER andTSETPOINT linear relationship after calibration is also shown in Fig. 1. A higher re-gression slope (0.99±0.01) and a significantly lower intercept (3.34±3.05) confirm the effectiveness of the temperature calibration.
3.2 Influence of TCAL on measurement of TC, EC, and OC
5
3.2.1 IMPROVE TOR and TOT before and after TCAL
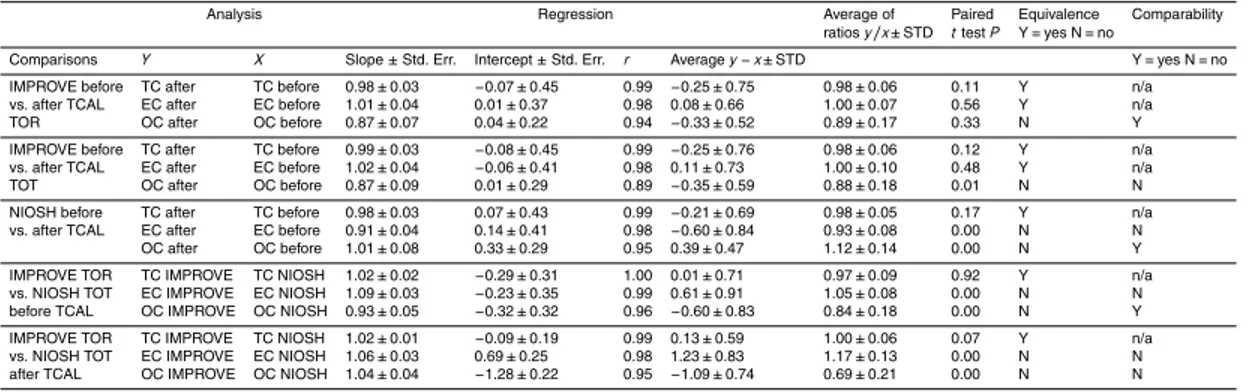
For IMPROVE, TC, OC, and EC fractions were compared before and after oven tem-perature calibration for n=12 filters (24 samples). Results of statistical comparisons are shown in Table 4. Neither the TOR nor TOT pyrolysis monitoring method produced a statistical difference (P >0.05) for TC or EC before and after calibration. The linear
10
regression results show high correlations (r >0.97) and that equivalence was met for TC and EC but not for OC. The insensitivity of IMPROVE TC and EC concentrations to temperature calibration was observed previously using both the Sunset Laboratories (Phuah et al., 2009) and DRI instruments (Chow et al., 2005). However, in this study the IMPROVE OC fraction at higher filter temperatures changed after the TCAL for the
15
TOT method (P <0.05) but not for TOR (P >0.05). The IMPROVE TOT OC values were 12 % lower after TCAL. The reasons for the lower OC when higher temperatures are applied after TCAL are discussed in more detail in Sect. 3.3.1. Use of TOT for pyrolysis monitoring responds to char being produced from organic vapors or liquids adsorbed within the filter whereas TOR monitors only the filter surface (Chow et al.,
20
2004b).
3.2.2 NIOSH TOT before and after TCAL
Table 4 shows that NIOSH-produced OC and EC fractions were significantly diff er-ent after TCAL (P <0.05). The linear regression confirmed equivalence and non-comparability of the EC fraction, and the EC results after calibration were 7 % lower
AMTD
7, 3321–3348, 2014The influence of temperature calibration on the
OC-EC results
J. Pavlovic et al.
Title Page
Abstract Introduction
Conclusions References
Tables Figures
◭ ◮
◭ ◮
Back Close
Full Screen / Esc
Printer-friendly Version Interactive Discussion
Discussion
P
a
per
|
D
iscussion
P
a
per
|
Discussion
P
a
per
|
Discuss
ion
P
a
per
|
than before TCAL on average. The average OC values were 12 % higher and statis-tically different (P =0.00) after the calibration. No statistical difference was found for the TC (P >0.05) after the TCAL with the results being comparable and the calibration resulting in∼2 % lower TC values. To our knowledge, no study has previously ana-lyzed NIOSH-generated TC, OC, and EC concentrations after temperature correction.
5
Results from the present study confirm that NIOSH-based carbon fractions can vary due to∆T. Higher filter temperatures after the calibration also likely affect the OC and EC sub-fractions to be discussed later.
3.2.3 IMPROVE TOR vs. NIOSH TOT before TCAL
Previous work demonstrates that IMPROVE EC is typically higher than NIOSH EC
10
(Chow et al., 2001, 2004b) with the opposite found for OC. For the laboratory-generated aerosol evaluated here, on average the IMPROVE-measured EC concentrations were higher by 5 %, while the IMPROVE OC was 16 % lower compared with NIOSH values (Table 4). The pairedttest results confirm a statistical difference between the two meth-ods for the OC and EC results (P <0.05). According to the linear regression results,
15
the EC is neither equivalent nor comparable, while the OC results satisfied the criteria for comparability but not for the equivalence. These protocols are usually equivalent for TC, and TC differences were insignificant between IMPROVE and NIOSH (P =0.919). In addition, the regression analysis showed equivalence between the TC data with average of ratios at 0.97±0.09 (IMPROVE/NIOSH).
20
3.2.4 IMPROVE TOR vs. NIOSH TOT after TCAL
After calibration, the IMPROVE TOR and NIOSH TOT protocols are determined to be equivalent for TC (Table 4) with an average ratio of 1.00±0.06 (IMPROVE/NIOSH). However, using OC and EC concentrations, the pairedttest shows statistically signifi-cant differences between two protocols (P <0.001), and the regression analysis shows
AMTD
7, 3321–3348, 2014The influence of temperature calibration on the
OC-EC results
J. Pavlovic et al.
Title Page
Abstract Introduction
Conclusions References
Tables Figures
◭ ◮
◭ ◮
Back Close
Full Screen / Esc
Printer-friendly Version Interactive Discussion
Discussion
P
a
per
|
D
iscussion
P
a
per
|
Discussion
P
a
per
|
Discuss
ion
P
a
per
|
non-equivalence and non-comparability. IMPROVE EC is 17 % higher than NIOSH EC and in turn IMPROVE OC is 31 % lower, on average.
3.3 Influence of TCAL on measurement of carbon sub-fractions
Nine carbon sub-fractions (four OC and five EC) for the NIOSH method and seven carbon sub-fractions (four OC and three EC) for the IMPROVE protocol were
com-5
pared before and after TCAL. Temperature ramp details contributing to the carbon sub-fraction features are given in Table 2. Pyrolized organic carbon (PyC) or char, which affects the OC-EC split, is also evaluated before and after TCAL. Paired t tests and mean ratios were computed to determine if the two protocols resulted in statistically different values for carbon sub-fractions and PyC.
10
3.3.1 IMPROVE TOR and TOT before and after TCAL
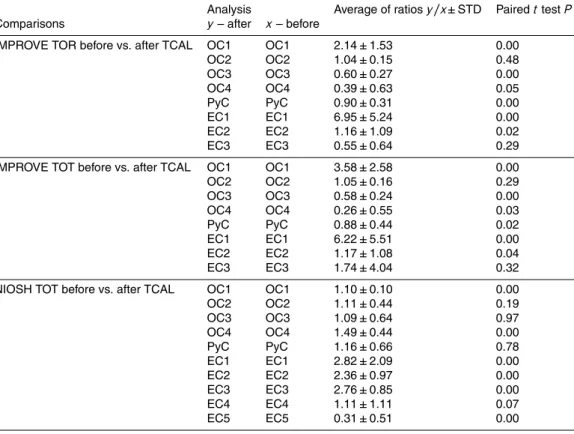
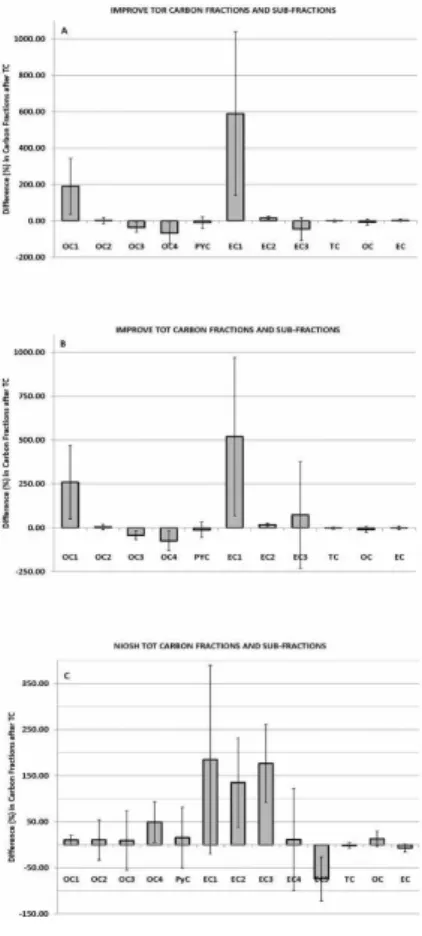
Percent differences in carbon fractions and sub-fractions after TCAL for the IMPROVE protocol are shown in Fig. 2a for the TOR data and Fig. 2b for the TOT data with sta-tistical results given in Table 5. Regardless of the optical correction technique in use, higher filter temperatures significantly increase OC1, EC1, and EC2 mass and reduce
15
OC3 and OC4 carbon mass whereas changes measured in the OC2 and EC3 sub-fractions are insignificant (P >0.05). It appears after TCAL that more carbon evolves sooner (OC1, EC1, and EC2) rather than later (OC3, OC4, and EC3) due to the higher filter temperatures associated with each protocol ramp or step after TCAL. Phuah et al. (2009) did not find any difference in the EC1 after the calibration, but did find
20
significant changes in the OC2, OC3, EC2, and PyC fractions. This may be due to differences in sample composition between the studies; the effect of oven temperature calibration on carbon sub-fractions is likely to be sample specific and not applicable to all aerosol source samples. Moreover, it is likely that calibration results are not trans-ferable across instruments and each carbon analyzer must be calibrated separately.
AMTD
7, 3321–3348, 2014The influence of temperature calibration on the
OC-EC results
J. Pavlovic et al.
Title Page
Abstract Introduction
Conclusions References
Tables Figures
◭ ◮
◭ ◮
Back Close
Full Screen / Esc
Printer-friendly Version Interactive Discussion
Discussion
P
a
per
|
D
iscussion
P
a
per
|
Discussion
P
a
per
|
Discuss
ion
P
a
per
|
Pyrolysis (PyC) significantly changed after calibration (P <0.05) and is 10–12 % lower than before TCAL for both TOR and TOT analysis. Lower PyC values after TCAL are consistent with lower total OC values discussed in Sect. 3.2.1. (∼11 % lower after TCAL) given that OC=OC1+OC2+OC3+OC4+PyC. In addition, lower PyC values after the TCAL, and at higher temperature operating conditions are in agreement with
5
findings from previous studies (Chow et al., 2005; Phuah et al., 2009) that also ob-served higher PyC values (more charring) at lower temperatures before TCAL for the IMPROVE temperature protocol. A likely explanation for such results is that higher tem-peratures to which the sample is exposed after the TCAL caused more OC to evolve at earlier steps (OC1 was higher after TCAL by a factor of 2.1 and 3.6 for TOR and TOT,
10
respectively). Therefore, the less OC (in particular the semivolatile OC that contributes the most to the charring) is exposed to higher temperatures, and less OC will pyrolize at higher temperature steps. In addition, the same effect (lower PyC after TCAL) was found for both TOT and TOR corrected results, indicating that both optical corrections are influenced the same after the TCAL for the IMPROVE temperature protocol,
there-15
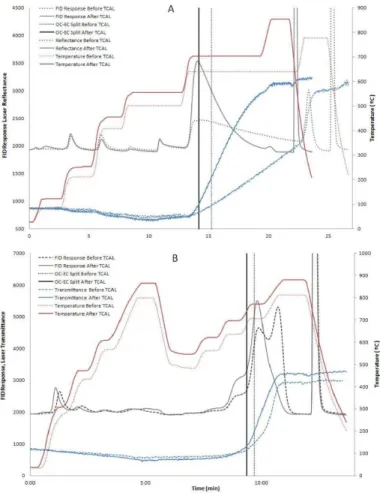
fore eliminating the optical correction as a possible cause for this effect. A characteristic IMPROVE TOR thermogram for the samples analyzed in the present study is shown in Fig. 3a. All samples show a similar He-O2 phase based OC-EC split point, and for all samples the OC-EC split following TCAL occurs earlier. This is consistent with lower PyC and total OC values measured after the TCAL. Although the earlier OC-EC split
20
was observed after TCAL, it did not significantly influence the results for total organic (OC) and elemental carbon (EC) as discussed earlier in Sect. 3.2.1.
3.3.2 NIOSH TOT before and after TCAL
Percent differences in TC, OC, EC, four TOT OC and five EC carbon sub-fractions, and PyC measured by the NIOSH method before and after TCAL can be found in Fig. 2c
25
AMTD
7, 3321–3348, 2014The influence of temperature calibration on the
OC-EC results
J. Pavlovic et al.
Title Page
Abstract Introduction
Conclusions References
Tables Figures
◭ ◮
◭ ◮
Back Close
Full Screen / Esc
Printer-friendly Version Interactive Discussion
Discussion
P
a
per
|
D
iscussion
P
a
per
|
Discussion
P
a
per
|
Discuss
ion
P
a
per
|
temperature EC (EC5) sub-fraction. No significant changes are observed for the middle temperature OC (OC2 and OC3) and EC (EC4) sub-fractions, as well as for the PyC fraction. A significant increase was measured for the high temperature OC4 (∼50 %) indicating that 70◦C difference in temperature after the calibration plays an important role in the measurement of the total organic carbon fraction (12 % higher results after
5
the calibration as stated in the Sect. 3.2.2).
A typical NIOSH TOT thermogram for the samples analyzed in the present study is shown in Fig. 3b. The OC-EC split point was positioned in the He-O2 phase (EC4) both before and after TCAL, and for all samples the OC-EC split occurs earlier after TCAL. However, this “early” OC-EC split did not result in lower OC and PyC values,
10
or in higher EC results after TCAL. On the contrary, NIOSH OC and PyC values were higher by∼12 % and 16 %, respectively and EC values lower by∼7 % after the TCAL. The higher filter temperatures after the TCAL caused more OC and PyC to evolve at earlier temperature steps and therefore the measured laser transmittance reaches its initial value (OC-EC split) earlier than before TCAL. The same effect has been seen
15
in the IMPROVE TOR thermogram (Fig. 3a). Contrary to the IMPROVE TOT and TOR results where PyC was lower (by∼10–12 %) after TCAL, the NIOSH TOT PyC results were higher by∼16 % after TCAL. The higher NIOSH temperature regime in the He phase with the maximum temperature of 870◦C after TCAL compared to 800◦C mea-sured before TCAL furthermore favors PyC formation. In addition, shorter residence
20
time during the NIOSH OC temperature steps cause less complete organic carbon evolution at lower temperatures (OC1 was higher after TCAL only by a factor of 1.1) and, consequently, increase charring formation during the higher temperature steps (Yu et al., 2002).
4 Conclusions
25
AMTD
7, 3321–3348, 2014The influence of temperature calibration on the
OC-EC results
J. Pavlovic et al.
Title Page
Abstract Introduction
Conclusions References
Tables Figures
◭ ◮
◭ ◮
Back Close
Full Screen / Esc
Printer-friendly Version Interactive Discussion
Discussion
P
a
per
|
D
iscussion
P
a
per
|
Discussion
P
a
per
|
Discuss
ion
P
a
per
|
NIOSH protocol). A software-based modification of parameters successfully reduced that variation. Advantage of the present study is that it has been performed with tem-perature calibration kit provided by the instrument manufacturer and if the same device is used to calibrate different instruments it can significantly improve inter-instrument comparison and increase the reliability of carbon results. IMPROVE TOT (OC) and
5
NIOSH TOT carbon fractions (OC and EC) were significantly different after the TCAL whereas the calibration procedure did not significantly influence the IMPROVE TOR EC and OC, and IMPROVE TOT EC carbon fractions. In addition, the calibration in-creased the difference in the OC-EC split known to exist between the NIOSH and IM-PROVE methods. Thermal carbon sub-fractions before and after calibration were
dif-10
ferent for both protocols with many differences being statistically significant. However, differences observed in this study may be instrument-, and sample-specific (although the same results were found for samples with different OC/EC ratios) and not perfectly representative of all combustion and atmospheric aerosols. In addition, given that there are different variations of the NIOSH 5040 temperature protocol, the temperature
bi-15
ases and carbon results measured in the present study might not be the same for each NIOSH 5040 temperature modification. Thus, to improve comparability over more studies and instrument types, oven temperature calibration is a necessary tool. Results from the present study suggest that careful calibration of each individual instrument is required to avoid misinterpretation of future carbonaceous aerosol and air quality data.
20
Supplementary material related to this article is available online at http://www.atmos-meas-tech-discuss.net/7/3321/2014/
amtd-7-3321-2014-supplement.pdf.
Acknowledgements. The authors would like to acknowledge the Oak Ridge Institute for Science and Education for supporting this research under contract with US Environmental Protection 25
AMTD
7, 3321–3348, 2014The influence of temperature calibration on the
OC-EC results
J. Pavlovic et al.
Title Page
Abstract Introduction
Conclusions References
Tables Figures
◭ ◮
◭ ◮
Back Close
Full Screen / Esc
Printer-friendly Version Interactive Discussion
Discussion
P
a
per
|
D
iscussion
P
a
per
|
Discussion
P
a
per
|
Discuss
ion
P
a
per
|
References
Birch, M. E.: Analysis of carbonaceous aerosols: interlaboratory comparison, Analyst, 123, 851–857, 1998.
Birch, M. E. and Cary, R. A.: Elemental carbon-based method for monitoring occupational ex-posures to particulate diesel exhaust, Aerosol Sci. Tech., 25, 221–241, 1996.
5
Chow, J. C., Watson, J. G., Pritchett, L. C., Pierson, W. R., Frazier, C. A., and Purcell, R. G.: The DRI thermal/optical reflectance carbon analysis system: description, evaluation, and applications in us air quality studies, Atmos. Environ., 27, 1185–1201, 1993.
Chow, J. C., Watson, J. G., Crow, D., Lowenthal, D. H., and Merrifield, T.: Comparison of IM-PROVE and NIOSH carbon measurements, Aerosol Sci. Tech., 34, 23–34, 2001.
10
Chow, J. C., Watson, J. G., Kuhns, H. D., Etyemezian, V., Lowenthal, D. H., Crow, D. J., Kohl, S. D., Engelbrecht, J. P., and Green, M. C.: Source profiles for industrial, mobile, and area sources in the big Bend Regional Aerosol Visibility and Observational (BRAVO) study, Chemosphere, 54, 185–208, 2004a.
Chow, J. C., Watson, J. G., Chen, L. W. A., Arnott, W. P., and Moosmuller, H.: Equivalence of 15
elemental carbon by thermal/optical reflectance and transmittance with different temperature protocols, Environ. Sci. Technol., 38, 4414–4422, 2004b.
Chow, J. C., Watson, J. G., Chen, L.-W. A., Paredes-Miranda, G., Chang, M.-C. O., Trimble, D., Fung, K. K., Zhang, H., and Zhen Yu, J.: Refining temperature measures in thermal/optical carbon analysis, Atmos. Chem. Phys., 5, 2961–2972, doi:10.5194/acp-5-2961-2005, 2005. 20
Chow, J. C., Watson, J. G., Chen, L.-W. A., Chang, M. C. O., Robinson, N. F., Trimble, D., and Kohl, S.: The IMPROVE_A temperature protocol for thermal/optical carbon analysis: maintaining consistency with a long-term database, J. Air Waste Manage., 57, 1014–1023, 2007.
Chow, J. C., Watson, J. G., Lowenthal, D. H., Chen, L. W. A., and Motallebi, N.: PM2.5source 25
profiles for black and organic carbon emission inventories, Atmos. Environ., 24, 5407–5414, 2011.
Jing, L.: Standard combustion aerosol generator (SCAG) for calibration purposes, 3rd ETH Workshop “Nanoparticle measurement”, ETH Hönggerberg Zürich, 9–10 August 1999, 1999.
AMTD
7, 3321–3348, 2014The influence of temperature calibration on the
OC-EC results
J. Pavlovic et al.
Title Page
Abstract Introduction
Conclusions References
Tables Figures
◭ ◮
◭ ◮
Back Close
Full Screen / Esc
Printer-friendly Version Interactive Discussion
Discussion
P
a
per
|
D
iscussion
P
a
per
|
Discussion
P
a
per
|
Discuss
ion
P
a
per
|
Khan, B., Hays, M. D., Geron, C., and Jetter, J.: Differences in the OC/EC ratios that charac-terize ambient and source aerosols due to thermal-optical analysis, Aerosol Sci. Tech., 46, 127–137, 2012.
Kim, E. and Hopke, P. K.: Source apportionment of fine particles at Washington, DC, utilizing temperature-resolved carbon fractions, J. Air Waste Manage., 54, 773–785, 2004.
5
Kim, E. and Hopke, P. K.: Improving source apportionment of fine particles in the Eastern United States utilizing temperature-resolved carbon fractions, J. Air Waste Manage., 55, 1456–1463, 2005.
Lee, P. K. H., Brook, J. R., Dabek-Zlotorzynska, E., and Mabury, S. A.: Identification of the major sources contributing to PM2.5 observed in Toronto, Environ. Sci. Technol., 37, 4831– 10
4840, 2003.
Maykut, N. N., Lewtas, J., Kim, E., and Larson, T. V.: Source apportionment of PM2.5 at an urban IMPROVE site in Seattle, Washington, Environ. Sci. Technol., 37, 5135–5142, 2003. NIOSH: Elemental carbon (diesel exhaust), in: NIOSH Manual for Analytical Methods, National
Institute for Occupational Safety and Health, Cincinnati, OH, 1996. 15
NIOSH: Method 5040 Issue 3 (Interim): elemental carbon (diesel exhaust), in: NIOSH Manual for Analytical Methods, National Institute for Occupational Safety and Health, Cincinnati, OH, 1999.
Peterson, M. R. and Richards, M. H.: Thermal-optical transmittance analysis for organic, el-emental, carbonate, total carbon, and OCX2 in PM2.5 by the EPA/NIOSH method, in: Pro-20
ceedings, Symposium on Air Quality Measurement Methods and Technology – 2002, edited by: Winegar, E. D. and Tropp, R. J., Air & Waste Management Association, Pittsburgh, PA, 83-1-83-19, 2002.
Phuah, C. H., Peterson, M. R., Richards, M. H., Turner, J. H., and Dillner, A. M.: A tempera-ture calibration procedure for the sunset laboratory carbon aerosol analysis lab instrument, 25
Aerosol Sci. Tech., 43, 1013–1021, 2009.
Schauer, J. J., Mader, B. T., DeMinter, J. T., Heidemann, G., Bae, M. S., Seinfeld, J. H., Fla-gan, R. C., Cary, R. A., Smith, D., Huebert, B. J., Bertram, T., Howell, S., Kline, J. T., Quinn, P., Bates, T., Turpin, B., Lim, B. J., Yu, J. Z., Yang, H., and Keywood, M. D.: ACE-Asia inter-comparison of a thermal-optical method for the determination of particle-phase organic and 30
AMTD
7, 3321–3348, 2014The influence of temperature calibration on the
OC-EC results
J. Pavlovic et al.
Title Page
Abstract Introduction
Conclusions References
Tables Figures
◭ ◮
◭ ◮
Back Close
Full Screen / Esc
Printer-friendly Version Interactive Discussion
Discussion
P
a
per
|
D
iscussion
P
a
per
|
Discussion
P
a
per
|
Discuss
ion
P
a
per
|
US Environmental Protection Agency (EPA): National Ambient Air Quality Standards for Partic-ulate Matter: Final Rule, Federal Register, 62, 38, 651–38, 701, available at: http://www.gpo. gov/fdsys/pkg/FR-1997-07-18/pdf/97-18577.pdf (las access: 2 August 2013), 1997.
Watson, J. G. and Chow, J. C.: Source characterization of major emission sources in the im-perial and Mexican valleys along the US/Mexico Border, Sci. Total. Environ., 276, 33–47, 5
2001.
Watson, J. G. and Chow, J. C.: Comparison and evaluation of in situ and filter carbon measure-ments at the fresno supersite, J. Geophys. Res., 107, ICC 3-1–ICC 3-15 2002.
Watson, J. G., Chow, J. C., Lowenthal, D. H., Pritchett, L. C., Frazier, C. A., Neuroth, G. R., and Robbins, R.: Differences in the carbon composition of source profiles for diesel- and 10
gasoline-powered vehicles, Atmos. Environ., 28, 2493–2505, 1994.
AMTD
7, 3321–3348, 2014The influence of temperature calibration on the
OC-EC results
J. Pavlovic et al.
Title Page
Abstract Introduction
Conclusions References
Tables Figures
◭ ◮
◭ ◮
Back Close
Full Screen / Esc
Printer-friendly Version Interactive Discussion
Discussion
P
a
per
|
D
iscussion
P
a
per
|
Discussion
P
a
per
|
Discuss
ion
P
a
per
|
Table 1.Summary of laboratory test conditions.
Comparisons Number of samples TC range (µg cm−2
) OC range (µg cm−2
) EC range (µg cm−2
AMTD
7, 3321–3348, 2014The influence of temperature calibration on the
OC-EC results
J. Pavlovic et al.
Title Page
Abstract Introduction
Conclusions References
Tables Figures
◭ ◮
◭ ◮
Back Close
Full Screen / Esc
Printer-friendly Version Interactive Discussion
Discussion
P
a
per
|
D
iscussion
P
a
per
|
Discussion
P
a
per
|
Discuss
ion
P
a
per
|
Table 2.Filter temperatures measured before calibration for NIOSH 5040 and IMPROVE pro-tocol.
NIOSH 5040 IMPROVE
Carbon TSETPOINT TFILTER Ramp Rate Residence ∆T
◦C
TSETPOINT(
◦C)
TFILTER(
◦C) Ramp Rate Residence
∆T◦C
fraction (◦C) (◦C) (◦C s−1
) time (s) (% difference) (◦C s−1
) time (s) (% difference)
OC1 310 278 4 70 32 (10) 120 88 1.25 150 32 (27)
OC2 475 435 8 60 40 (8) 250 211 2.5 150 39 (16)
OC3 615 569 10 60 46 (7) 450 407 3 150 43 (10)
OC4 870 800 8 105 70 (8) 550 501 4 150 49 (9)
EC1 550 482 9 60 68 (12) 550 501 4 150 49 (9)
EC2 625 563 10 60 62 (10) 700 639 5 150 61 (9)
EC3 700 637 12 60 63 (9) 850 777 6 150 73 (9)
EC4 775 707 13 60 68 (9)
AMTD
7, 3321–3348, 2014The influence of temperature calibration on the
OC-EC results
J. Pavlovic et al.
Title Page
Abstract Introduction
Conclusions References
Tables Figures
◭ ◮
◭ ◮
Back Close
Full Screen / Esc
Printer-friendly Version Interactive Discussion
Discussion
P
a
per
|
D
iscussion
P
a
per
|
Discussion
P
a
per
|
Discuss
ion
P
a
per
|
Table 3.Filter temperatures measured after calibration and software adjustments.
NIOSH 5040 IMPROVE
Carbon Fraction TSETPOINT( ◦
C);r∗
TFILTER(
◦
C) ∆T◦
C (% difference) TSETPOINT( ◦
C);r∗
TFILTER(
◦
C) ∆T◦
C (% difference)
OC1 310; 24 307 3 (1.0) 120; 48 122 2 (1.7)
OC2 475; 28 472 3 (0.6) 250; 39 254 4 (1.6)
OC3 615; 40 609 6 (1.0) 450; 42 455 5 (1.1)
OC4 870; 65 866 4 (0.5) 550; 50 555 5 (0.9)
EC1 550; 61 546 4 (0.7) 550; 50 555 5 (0.9)
EC2 625; 54 622 3 (0.5) 700; 61 703 3 (0.4)
EC3 700; 56 697 3 (0.4) 850; 74 854 4 (0.5)
EC4 775; 61 772 3 (0.4)
EC5 890; 71 881 9 (1.0)
∗
AMTD
7, 3321–3348, 2014The influence of temperature calibration on the
OC-EC results
J. Pavlovic et al.
Title Page
Abstract Introduction
Conclusions References
Tables Figures
◭ ◮
◭ ◮
Back Close
Full Screen / Esc
Printer-friendly Version Interactive Discussion
Discussion
P
a
per
|
D
iscussion
P
a
per
|
Discussion
P
a
per
|
Discuss
ion
P
a
per
|
Table 4.Comparability statistics results for NIOSH TOT and IMPROVE TOR and TOT carbon fractions before and after temperature calibration∗.
Analysis Regression Average of Paired Equivalence Comparability
ratiosy/x±STD ttestP Y=yes N=no
Comparisons Y X Slope±Std. Err. Intercept±Std. Err. r Averagey−x±STD Y=yes N=no
IMPROVE before TC after TC before 0.98±0.03 −0.07±0.45 0.99 −0.25±0.75 0.98±0.06 0.11 Y n/a
vs. after TCAL EC after EC before 1.01±0.04 0.01±0.37 0.98 0.08±0.66 1.00±0.07 0.56 Y n/a
TOR OC after OC before 0.87±0.07 0.04±0.22 0.94 −0.33±0.52 0.89±0.17 0.33 N Y
IMPROVE before TC after TC before 0.99±0.03 −0.08±0.45 0.99 −0.25±0.76 0.98±0.06 0.12 Y n/a
vs. after TCAL EC after EC before 1.02±0.04 −0.06±0.41 0.98 0.11±0.73 1.00±0.10 0.48 Y n/a
TOT OC after OC before 0.87±0.09 0.01±0.29 0.89 −0.35±0.59 0.88±0.18 0.01 N N
NIOSH before TC after TC before 0.98±0.03 0.07±0.43 0.99 −0.21±0.69 0.98±0.05 0.17 Y n/a
vs. after TCAL EC after EC before 0.91±0.04 0.14±0.41 0.98 −0.60±0.84 0.93±0.08 0.00 N N
OC after OC before 1.01±0.08 0.33±0.29 0.95 0.39±0.47 1.12±0.14 0.00 N Y
IMPROVE TOR TC IMPROVE TC NIOSH 1.02±0.02 −0.29±0.31 1.00 0.01±0.71 0.97±0.09 0.92 Y n/a
vs. NIOSH TOT EC IMPROVE EC NIOSH 1.09±0.03 −0.23±0.35 0.99 0.61±0.91 1.05±0.08 0.00 N N
before TCAL OC IMPROVE OC NIOSH 0.93±0.05 −0.32±0.32 0.96 −0.60±0.83 0.84±0.18 0.00 N Y
IMPROVE TOR TC IMPROVE TC NIOSH 1.02±0.01 −0.09±0.19 0.99 0.13±0.59 1.00±0.06 0.07 Y n/a
vs. NIOSH TOT EC IMPROVE EC NIOSH 1.06±0.03 0.69±0.25 0.98 1.23±0.83 1.17±0.13 0.00 N N
after TCAL OC IMPROVE OC NIOSH 1.04±0.04 −1.28±0.22 0.95 −1.09±0.74 0.69±0.21 0.00 N N
∗
AMTD
7, 3321–3348, 2014The influence of temperature calibration on the
OC-EC results
J. Pavlovic et al.
Title Page
Abstract Introduction
Conclusions References
Tables Figures
◭ ◮
◭ ◮
Back Close
Full Screen / Esc
Printer-friendly Version Interactive Discussion
Discussion
P
a
per
|
D
iscussion
P
a
per
|
Discussion
P
a
per
|
Discuss
ion
P
a
per
|
Table 5.Average ratios and pairedttest results for NIOSH TOT and IMPROVE TOR and TOT carbon sub-fractions before and after temperature calibration.
Analysis Average of ratiosy/x±STD PairedttestP
Comparisons y– after x– before
IMPROVE TOR before vs. after TCAL OC1 OC1 2.14±1.53 0.00
OC2 OC2 1.04±0.15 0.48
OC3 OC3 0.60±0.27 0.00
OC4 OC4 0.39±0.63 0.05
PyC PyC 0.90±0.31 0.00
EC1 EC1 6.95±5.24 0.00
EC2 EC2 1.16±1.09 0.02
EC3 EC3 0.55±0.64 0.29
IMPROVE TOT before vs. after TCAL OC1 OC1 3.58±2.58 0.00
OC2 OC2 1.05±0.16 0.29
OC3 OC3 0.58±0.24 0.00
OC4 OC4 0.26±0.55 0.03
PyC PyC 0.88±0.44 0.02
EC1 EC1 6.22±5.51 0.00
EC2 EC2 1.17±1.08 0.04
EC3 EC3 1.74±4.04 0.32
NIOSH TOT before vs. after TCAL OC1 OC1 1.10±0.10 0.00
OC2 OC2 1.11±0.44 0.19
OC3 OC3 1.09±0.64 0.97
OC4 OC4 1.49±0.44 0.00
PyC PyC 1.16±0.66 0.78
EC1 EC1 2.82±2.09 0.00
EC2 EC2 2.36±0.97 0.00
EC3 EC3 2.76±0.85 0.00
EC4 EC4 1.11±1.11 0.07
AMTD
7, 3321–3348, 2014The influence of temperature calibration on the
OC-EC results
J. Pavlovic et al.
Title Page
Abstract Introduction
Conclusions References
Tables Figures
◭ ◮
◭ ◮
Back Close
Full Screen / Esc
Printer-friendly Version Interactive Discussion
Discussion
P
a
per
|
D
iscussion
P
a
per
|
Discussion
P
a
per
|
Discuss
ion
P
a
per
|
524
525
Figure 1. Linear regression results before and after temperature calibration 526
527
528
529
530
531
532
533
534
535
536
537
538
539
BEFORE TCAL y = 0.94x - 19.58
R² = 0.999 AFTER TCAL
y = 0.99x + 3.34 R² = 0.999
0 200 400 600 800 1000
0 200 400 600 800 1000
FI
LT
E
R
T
E
M
P
E
R
A
T
U
R
E
(
C
)
SETPOINT TEMPERATURE ( C)
Fig. 1.Linear regression results before and after temperature calibration.
AMTD
7, 3321–3348, 2014The influence of temperature calibration on the
OC-EC results
J. Pavlovic et al.
Title Page
Abstract Introduction
Conclusions References
Tables Figures
◭ ◮
◭ ◮
Back Close
Full Screen / Esc
Printer-friendly Version Interactive Discussion
Discussion
P
a
per
|
D
iscussion
P
a
per
|
Discussion
P
a
per
|
Discuss
ion
P
a
per
|
21 540
Figure 2. Percent difference ((y-x) 100%/x) in carbon fractions and sub-fractions and standard deviation 541
of the results after temperature calibration for the A) IMPROVE TOR; B) IMPROVE TOT; and C) NIOSH 542
TOT temperature protocols 543
AMTD
7, 3321–3348, 2014The influence of temperature calibration on the
OC-EC results
J. Pavlovic et al.
Title Page
Abstract Introduction
Conclusions References
Tables Figures
◭ ◮
◭ ◮
Back Close
Full Screen / Esc
Printer-friendly Version Interactive Discussion
Discussion
P
a
per
|
D
iscussion
P
a
per
|
Discussion
P
a
per
|
Discuss
ion
P
a
per
|
22 544
Figure 3. Typical: A) IMPROVE TOR thermogram and B) NIOSH TOT thermogram for the same sample 545
analyzed before and after TCAL. 546