TCD
7, 3417–3447, 2013Constraining GRACE signal to ice-covered
areas
W. Colgan et al.
Title Page
Abstract Introduction
Conclusions References
Tables Figures
◭ ◮
◭ ◮
Back Close
Full Screen / Esc
Printer-friendly Version Interactive Discussion
Discussion
P
a
per
|
D
iscussion
P
a
per
|
Discussion
P
a
per
|
Discuss
ion
P
a
per
|
The Cryosphere Discuss., 7, 3417–3447, 2013 www.the-cryosphere-discuss.net/7/3417/2013/ doi:10.5194/tcd-7-3417-2013
© Author(s) 2013. CC Attribution 3.0 License.
Geoscientiic Geoscientiic
Geoscientiic Geoscientiic
Open Access
The Cryosphere
Discussions
This discussion paper is/has been under review for the journal The Cryosphere (TC). Please refer to the corresponding final paper in TC if available.
Constraining GRACE-derived
cryosphere-attributed signal to irregularly
shaped ice-covered areas
W. Colgan1,2, S. Luthcke3, W. Abdalati1, and M. Citterio2
1
Cooperative Institute for Research in Environmental Sciences, University of Colorado, Boulder, CO, USA
2
Geological Survey of Denmark and Greenland, Copenhagen, Denmark
3
Goddard Space Flight Center, National Aeronautics and Space Administration, Greenbelt, MD, USA
Received: 18 April 2013 – Accepted: 26 June 2013 – Published: 8 July 2013 Correspondence to: W. Colgan ([email protected])
TCD
7, 3417–3447, 2013Constraining GRACE signal to ice-covered
areas
W. Colgan et al.
Title Page
Abstract Introduction
Conclusions References
Tables Figures
◭ ◮
◭ ◮
Back Close
Full Screen / Esc
Printer-friendly Version Interactive Discussion
Discussion
P
a
per
|
D
iscussion
P
a
per
|
Discussion
P
a
per
|
Discuss
ion
P
a
per
|
Abstract
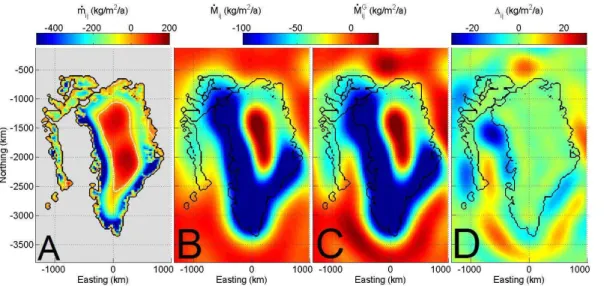
We use a Monte Carlo approach to invert a spherical harmonic representation of cryosphere-attributed mass change in order to infer the most likely underlying mass changes within irregularly shaped ice-covered areas at nominal 26 km resolution. By inverting a spherical harmonic representation through the incorporation of additional 5
fractional ice coverage information, this approach seeks to eliminate signal leakage between non- and ice-covered areas. The spherical harmonic representation suggests a Greenland mass loss of 251±25 Gt yr−1 over the December 2003 to December 2010 period. The inversion suggests 218±20 Gt yr−1was due to the ice sheet proper, and 34±5 Gt yr−1 (or∼14 %) was due to Greenland peripheral glaciers and ice caps 10
(GrPGIC). This mass loss from GrPGIC exceeds that inferred from all ice masses on both Ellesmere and Devon Islands combined. This partition therefore highlights that GRACE-derived “Greenland” mass loss cannot be taken as synonymous with “Green-land ice sheet” mass loss when making comparisons with estimates of ice sheet mass balance derived from techniques that only sample the ice sheet proper.
15
1 Introduction
The Gravity Recovery And Climate Experiment (GRACE) satellite constellation mea-sures anomalies in Earth’s gravity field. Changes in ice sheet mass balance can be quantified through repeated observations of these gravitational anomalies. Unlike an altimetry approach (e.g. Zwally et al., 2011), in which an ice sheet volume change is 20
converted into a mass change, a gravimetry approach does not require the assumption of an effective density of change or the refreezing versus runofffraction of surface abla-tion. Unlike an input-output approach (e.g. Rignot et al., 2008), in which interferometric synthetic aperture radar ice discharge estimates are combined with modelled surface mass balance estimates, a gravimetry approach does not require precise knowledge 25
TCD
7, 3417–3447, 2013Constraining GRACE signal to ice-covered
areas
W. Colgan et al.
Title Page
Abstract Introduction
Conclusions References
Tables Figures
◭ ◮
◭ ◮
Back Close
Full Screen / Esc
Printer-friendly Version Interactive Discussion
Discussion
P
a
per
|
D
iscussion
P
a
per
|
Discussion
P
a
per
|
Discuss
ion
P
a
per
|
et al., 2007). A gravimetry approach to ice sheet mass balance, however, is sensitive to the models used to isolate the cryospheric mass change signal from other signals, such as terrestrial and ocean hydrology, crust and mantle movement, and atmospheric mass changes. Several GRACE studies have documented the increasingly negative mass balance of the Greenland ice sheet, from an initial estimate of−76±26 Gt yr−1 during 5
the May 2002 to July 2004 period (Velicogna and Wahr, 2005) to a more recent esti-mate of−263±30 Gt yr−1during the January 2005 to December 2010 period (Shepherd et al., 2012).
GRACE-derived spherical harmonic solutions of rate of mass change have coarse spatial resolution, and consequently signal leakage from within defined areas 10
(Velicogna and Wahr, 2006). While GRACE-derived mass change estimates have been assessed at basin-scale resolution over the Greenland ice sheet (Luthcke et al., 2006a; Velicogna and Wahr, 2006; Barletta et al., 2012; Sasgen et al., 2012), signal leakage has prevented the development of a GRACE-derived mass change field that is com-pletely constrained to within the irregularly shaped ice-covered areas of Greenland. 15
Deconstructing spherical harmonic solutions, in a non-iterative fashion using separate land and ocean filters, has been demonstrated to reduce land-ocean signal leakage (Guo et al., 2010). The use of local mass concentrations (“mascons”) offers an alterna-tive approach to improve spatial resolution and reduce signal leakage (Luthcke et al., 2006a; Jacob et al., 2012). No interpretation of satellite gravimetry, however, has been 20
capable of reliably partitioning mass change due to Greenland peripheral glaciers and ice caps (GrPGIC) from that due to the Greenland ice sheet (GrIS) proper. It is desir-able to isolate GrPGIC mass change from GrIS mass change, as a historical expecta-tion suggests that smaller peripheral glaciers and ice caps should respond faster than the larger ice sheet to contemporary climate change (Oerlemans, 1989).
TCD
7, 3417–3447, 2013Constraining GRACE signal to ice-covered
areas
W. Colgan et al.
Title Page
Abstract Introduction
Conclusions References
Tables Figures
◭ ◮
◭ ◮
Back Close
Full Screen / Esc
Printer-friendly Version Interactive Discussion
Discussion
P
a
per
|
D
iscussion
P
a
per
|
Discussion
P
a
per
|
Discuss
ion
P
a
per
|
2 Method
We use a Monte Carlo inversion to infer the most likely 26 km resolution rate of mass change field ( ˙m) that, when smoothed with a Gaussian filter of prescribed standard deviation (σ), closely reproduces the spherical harmonic representation of cryosphere-attributed GRACE mascons produced by Luthcke et al. (2013). By constraining the 5
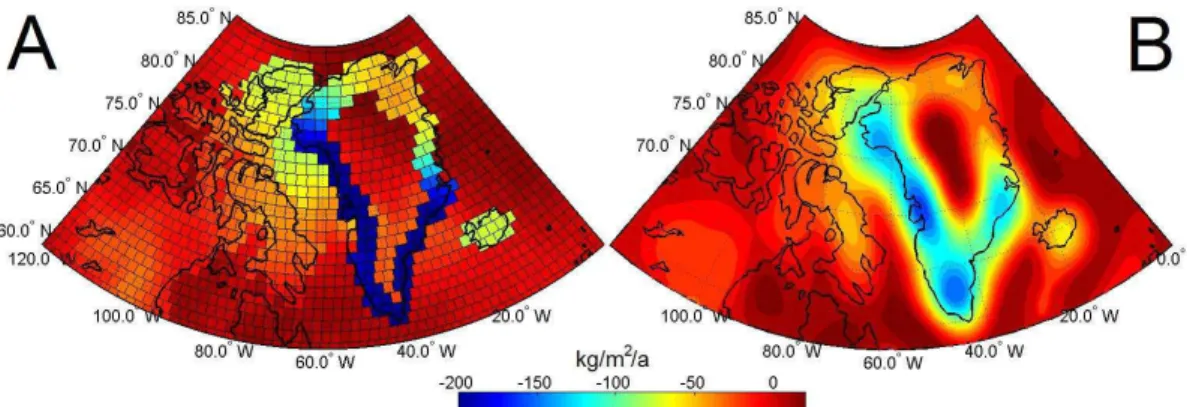
inverted cryosphere-attributed mass changes to ice-containing nodes, this approach seeks to eliminate signal leakage between non- and ice-covered areas. We do not purport to resolve spatial heterogeneity in mass loss at the scale of individual outlet glaciers. The spherical harmonic representation ( ˙MG) is derived by converting time series of cryosphere-attributed mascons into equivalent spherical harmonics (Fig. 1). 10
The rigorous forward modeling required to significantly limit leakage and isolate the cryospheric mass change signal are applied at the original mascon level (Luthcke et al., 2013), not the subsequent spherical harmonic representation used in this study. We employ a spherical harmonic representation of cryospheric mass change as the sharp contrast in mass change values at mascon boundaries is not suitable for a Gaussian 15
inversion. We denote the simulated Gaussian smoothed ˙m field with ˙M, to distinguish it from the GRACE-derived spherical harmonic representation of cryosphere-attributed mass change ( ˙MG). This mass change inversion differs from that of Barletta et al. (2012) by being couched in a Monte Carlo approach, whereby a large population of
˙
MG fields, each perturbed within the associated error field (δM˙i jG), are inverted. Each 20
inversion is performed with an iterative approach, whereby the ˙m field is updated by a randomly perturbed variant of the ˙MG and ˙M difference field each iteration, until convergence within a prescribed tolerance (Animation 1).
The fundamental problem addressed in this work is how to extract robust mass variations over spatially-limited regions from GRACE data (e.g. Simons et al., 2006). 25
TCD
7, 3417–3447, 2013Constraining GRACE signal to ice-covered
areas
W. Colgan et al.
Title Page
Abstract Introduction
Conclusions References
Tables Figures
◭ ◮
◭ ◮
Back Close
Full Screen / Esc
Printer-friendly Version Interactive Discussion
Discussion
P
a
per
|
D
iscussion
P
a
per
|
Discussion
P
a
per
|
Discuss
ion
P
a
per
|
is the GRACE comparison period established by the ice sheet mass balance inter-comparison exercise (IMBIE; Shepherd et al., 2012). These mascons are derived from a NASA GSFC data product in which GRACE level 1 K-band inter-satellite range rate (KBRR) data is reduced via forward modeling into a series of iterated monthly mascons (Luthcke et al., 2013). During this level 1 data reduction, forward modelling removes 5
mass changes associated with terrestrial hydrology, the ocean and atmosphere, as well as glacial isostatic adjustment and ocean tides. Once these rigorous constraints have been applied in mascon space to significantly limit leakage and isolate cryospheric mass change signal, the linear mass change trend and 1σ trend error are calculated for each mascon time series, and then converted into equivalent spherical harmonics 10
of degree and order 60 (Fig. 2). By virtue of this conversion, the spatial distribution of mass change in the resultant spherical harmonic representation is slightly different than that of the original mascons. While this degree-60 spherical harmonic representa-tion of cryosphere-attributed mascons is global, we only utilize the porrepresenta-tion that covers an∼11×106km2 region of interest centered over Greenland and the Canadian High 15
Arctic.
A given Monte Carlo simulation is initialized with spatial fields of both non-smoothed and Gaussian smoothed rate of mass change, ˙mi j and ˙Mi j, respectively, which are initially comprised of arrays of zeros. The difference (∆i j) between the GRACE-derived
spherical harmonic representation of mass change ( ˙Mi jG) and the Gaussian smoothed 20
mass change field of a given iteration ( ˙Mi jk) is then determined:
∆ki j=( ˙Mi jG+δM˙i jGR)−M˙i jk (1)
where δM˙i jGR is a perturbation within the 1σ error associated with ˙Mi jG, k denotes a given iteration andi j are node indices. The perturbation is imposed in each simula-tion by selecting a random scalar (R) from a normal distribution centered on zero, multi-25
sim-TCD
7, 3417–3447, 2013Constraining GRACE signal to ice-covered
areas
W. Colgan et al.
Title Page
Abstract Introduction
Conclusions References
Tables Figures
◭ ◮
◭ ◮
Back Close
Full Screen / Esc
Printer-friendly Version Interactive Discussion
Discussion
P
a
per
|
D
iscussion
P
a
per
|
Discussion
P
a
per
|
Discuss
ion
P
a
per
|
ulations, but is constant throughout the iterations of a given simulation. Perturbing the input spherical harmonic representation by its associated accuracy ensures a robust inversion procedure, whereby the resulting ensemble range is expected to reflect the combined uncertainties associated with both the cryospheric mass change inferred by GRACE and the noise of the Monte Carlo inversion. In comparison, the ensemble range 5
resulting from inverting a single, unperturbed, spherical harmonic numerous times, is expected to only reflect noise resulting from the Monte Carlo inversion.
The difference field is used to inform the ˙mi j field of the subsequent iteration accord-ing to:
˙
mki j+1=m˙i jk + ∆ki jRi jFi j (2)
10
where Ri j is an array of random values between 0 and 1, and Fi j is fractional ice coverage at a given node. In contrast to the scalarR used to perturb the input spheri-cal harmonic representation, the arrayRi j is continually being repopulated by random numbers throughout the iterations of a given simulation (i.e. a singleRi j array is not held constant for the iterations of a given simulation). Local mascon rates of mass 15
change derived from GRACE are known to be sensitive to the a priori imposition of predefined patterns of mass change (Horwath and Dietrich, 2009). This is not an issue with the mascon solution used here, however, as Luthcke et al. (2013) derive mass changes from the rigorous reduction of the KBRR residuals. In the context of inverting the spherical harmonic representation, employing a random number field in each itera-20
tion not only ensures that inferred rates of mass change are not required to be spatially correlated (i.e. subject to a prescribed covariance matrix), but actually enhances the ability to efficiently explore the infinite number of possible solutions (e.g. Colgan et al., 2012).
We interpolate the fractional ice coverage of all glaciers external to Greenland from 25
Land-TCD
7, 3417–3447, 2013Constraining GRACE signal to ice-covered
areas
W. Colgan et al.
Title Page
Abstract Introduction
Conclusions References
Tables Figures
◭ ◮
◭ ◮
Back Close
Full Screen / Esc
Printer-friendly Version Interactive Discussion
Discussion
P
a
per
|
D
iscussion
P
a
per
|
Discussion
P
a
per
|
Discuss
ion
P
a
per
|
sat pixels or 30 m (Fig. 3). We interpolate fractional GrIS and GrPGIC ice coverage from a Greenland glacier inventory that has a polygon accuracy of 10 m (Citterio and Ahlstrøm, 2013). This glacier inventory classifies GrPGIC ice fraction as the ice cover-age associated with glaciers and ice caps demonstrating “no” and “weak” connectivity with the ice sheet proper, while the ice coverage associated with glaciers demonstrat-5
ing “strong” connectivity with the ice sheet proper is classified as GrIS ice fraction (c.f. Rastner et al., 2012). Using fractional ice coverage allows inferred mass changes to be weighted by the ice fraction at each node, rather than restricting inferred mass changes to a binary field of non- and ice-covered nodes.
The corresponding Gaussian smoothed ˙Mi j field is computed by applying a fixed 10
parameter Gaussian filter to the ˙mi j field:
˙
Mi jk+1=m˙ki j+1
1
σ√2π
exp
−di j2
2σ2
(3)
whereσ is the prescribed standard deviation of the isotropic Gaussian filter anddi j is an array of distances between a given node and all nodes within the model domain. While other filters, such as data adaptive cosine windows, conserve more spherical 15
harmonic low-degree energy, thereby potentially allowing a better description of spatial variability, we do not explore alternatives to the conventional Gaussian filter in this study (e.g. Longuevergne et al., 2010).
In the US National Snow and Ice Data Center (NSIDC) polar stereographic projec-tion, the model domain extends from−1625 km in the west to 1300 km in the east, and 20
from−125 km in the north to −3800 km in the south. This places the domain bound-aries at least one Gaussian filter length from all major ice masses in Greenland and the Canadian Arctic Archipelago (Fig. 3). There is an inherent trade-offbetween computa-tional burden and horizontal grid resolution, as the former exponentially increases as the latter linearly decreases. We prescribe a uniform grid spacing of 26 km, which re-25
TCD
7, 3417–3447, 2013Constraining GRACE signal to ice-covered
areas
W. Colgan et al.
Title Page
Abstract Introduction
Conclusions References
Tables Figures
◭ ◮
◭ ◮
Back Close
Full Screen / Esc
Printer-friendly Version Interactive Discussion
Discussion
P
a
per
|
D
iscussion
P
a
per
|
Discussion
P
a
per
|
Discuss
ion
P
a
per
|
along the Northing axis, for a total of 16 046 computational nodes within the model domain. Twenty six km resolution allowsdi j to be stored as a single 3-D array (113 by 142 by 16 046) on the 12 GB of RAM associated with a single processor on the Janus supercomputer. This avoids recalculating the individual 113 by 142di j array associated with each of the 16 046 computational nodes in each iteration.
5
We iterate the ˙mi j field by cycling through Eqs. (1)–(3) until the following condition is satisfied across all GrIS and GrPGIC nodes (Animation 1):
X
i j
m˙
k+1
i j −m˙ k i j
Ai j≤0.1 Gt yr
−1 (4)
where Ai j is node area. We therefore deem the system of equations as converged when the total rate of mass change over all Greenland ice coverage varies by less 10
than 0.1 Gt yr−1 between iterations. This typically takes between 75 to 100 iterations per simulation, depending on prescribed σ value (Fig. 4). We perform 1000 simula-tions in order to compute a robust ensemble mean ˙mi j field. Each simulation takes 181±17 processor seconds on a 2.8 GHz core with 12 GB of RAM on the University of Colorado’s Janus Supercomputer.
15
While grid spacing is a uniform 26 km throughout our domain, the polar stereographic projection inherently introduces increasing distortion away from the central meridian (45◦W) and parallel (70◦N), which influences area calculations. To compensate for area distortion, we calculate the area of each individual node across the domain (Ai j). Thus, while our node area is nominally 262km2, the areas of ice-containing nodes vary 20
between 24.52and 27.52km2over the domain.
As a sensitivity analysis, we invert nominal 26 by 26 km resolution ˙m fields using Gaussian smoothing lengths of σ=150, 200 and 250 km. By employing a spherical harmonic representation that isolates the cryospheric, or terrestrial ice, mass change signal, we assume that the mass change associated with non-ice containing nodes 25
TCD
7, 3417–3447, 2013Constraining GRACE signal to ice-covered
areas
W. Colgan et al.
Title Page
Abstract Introduction
Conclusions References
Tables Figures
◭ ◮
◭ ◮
Back Close
Full Screen / Esc
Printer-friendly Version Interactive Discussion
Discussion
P
a
per
|
D
iscussion
P
a
per
|
Discussion
P
a
per
|
Discuss
ion
P
a
per
|
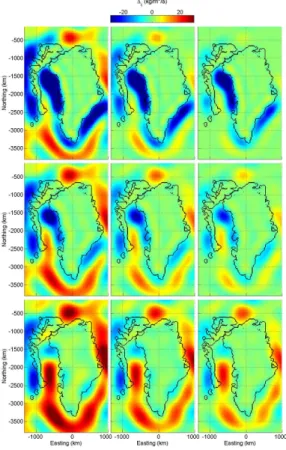
nodes to vary below a prescribed absolute threshold value of 0, 15 or 30 kg m−2yr−1. A threshold of 0 kg m−2yr−1, for example, implies no error in, or perfect isolation of, the cryospheric mass change signal. Our sensitivity analysis therefore consists of nine en-sembles to explore the possible combinations of Gaussian smoothing length and non-ice containing node ˙mi j thresholds (Fig. 5). We find that the root mean squared (RMS) 5
of the difference field between the spherical harmonic representation of GRACE-derived cryosphere-attributed mascons and the inferred ˙M field reaches a minimum whenσ=200, independent of which non-ice containing node ˙mi j threshold is imple-mented (Figs. 6 and 7). We therefore prescribe a Gaussian smoothing length of 200 km in our inversion. Selecting which non-ice containing node ˙mi j threshold to implement 10
is more subjective, however, as RMS error decreases as non-ice containing node ˙mi j threshold increases. RMS error would ultimately go to zero when the ˙mi j values per-mitted at non-ice containing nodes are indistinguishable from those at ice containing nodes. We therefore arbitrarily prescribe an absolute threshold of 15 kg m−2yr−1at non-ice containing nodes. This boundary condition acknowledges a level of uncertainty in 15
the rate of mass change at non-ice containing nodes that is representative of the uncer-tainty typically assessed for GRACE-derived cryosphere-attributed spherical harmonic solutions (Velicogna and Wahr, 2005; Longuevergne et al., 2010), and an order of magnitude less than the ˙mi j values inferred by our Monte Carlo inversion approach at adjacent ice-containing nodes.
20
By constraining inferred mass changes to only occur at ice-containing nodes, our inversion approach allows mass changes to be partitioned amongst discrete groups of nodes within the model domain. This partitioning requires the uncertainty associated with the mass change at a group of nodes to be quantified. Previous glaciological appli-cations of Monte Carlo inversion, such as inferring basal sliding velocity from input data 25
TCD
7, 3417–3447, 2013Constraining GRACE signal to ice-covered
areas
W. Colgan et al.
Title Page
Abstract Introduction
Conclusions References
Tables Figures
◭ ◮
◭ ◮
Back Close
Full Screen / Esc
Printer-friendly Version Interactive Discussion
Discussion
P
a
per
|
D
iscussion
P
a
per
|
Discussion
P
a
per
|
Discuss
ion
P
a
per
|
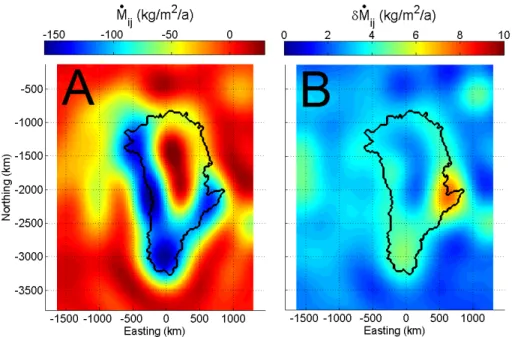
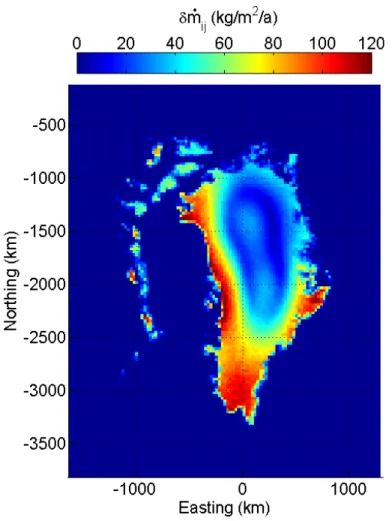
given nodei j(δm˙i j) as one standard deviation of the given node ˙mi j value across the ensemble of simulations (Fig. 8). As values of ensemble meanδm˙i j are spatially cor-related, we do not derive the uncertainty in the mass change of a given area from the point uncertainties within the given area, but rather from the mass change of the given area across the ensemble of inversions. We take uncertainty in the total mass change 5
of a given group of nodes, such as GrIS, GrPGIC, Ellesmere and Devon Islands (ED) or Baffin Island (BA), as one standard deviation of the values of the given group of nodes across the entire ensemble of simulations.
When partitioning mass changes at nodes shared by both GrIS and GrPGIC, we weight attributable mass change by fractional ice coverage of each ice mass. For ex-10
ample, the total rate of mass change for GrIS (P ˙
mGrIS) is calculated as:
X ˙
mGrIS=X
i j
m˙i j
Fi jGrIS
Fi jGrPGIC+Fi jGrIS
Ai j (5)
whereAi j is again an array of node areas (nominally 262km2), and the superscript de-notes whether ice cover is classified as GrPGIC or GrIS. While the contributions of GrIS and GrPGIC at a given node are indistinguishable to the inversion algorithm, in that 15
they contribute to inferred mass change in the same way, Eq. (5) provides a framework for statistically partitioning ice sheet and peripheral glacier mass change at common nodes.
3 Results
The ensemble mean Gaussian-smoothed rate of mass change field closely reproduces 20
TCD
7, 3417–3447, 2013Constraining GRACE signal to ice-covered
areas
W. Colgan et al.
Title Page
Abstract Introduction
Conclusions References
Tables Figures
◭ ◮
◭ ◮
Back Close
Full Screen / Esc
Printer-friendly Version Interactive Discussion
Discussion
P
a
per
|
D
iscussion
P
a
per
|
Discussion
P
a
per
|
Discuss
ion
P
a
per
|
East Greenland around South Greenland to Humbolt Glacier in Northwest Greenland, as well as mass gain focused in North Central Greenland. The difference between the final ˙M field and the input ˙MG field (∆) is<5 % of the absolute magnitude of the
˙
MGfield throughout the vast majority of the inversion domain. The largest discrepancy occurs in North Baffin Bay, where the pattern of the spherical harmonic representation 5
over the ocean infers more mass loss than is permitted by the inversion parameters employed, resulting in a local maximum in absolute discrepancy.
The nominal 26 by 26 km resolution inverted mass change field ( ˙m) infers mass loss around the entire low elevation perimeter of the GrIS, with a broad region of mass gain in the high elevation Central and North Greenland ice sheet interior, similar to the spa-10
tial pattern of mass change presented by Barletta et al. (2012, Fig. 10). This pattern is consistent with independent observations of concurrent high elevation ice sheet thick-ening and low elevation ice sheet thinning (e.g. Zwally et al., 2011). As the inversion is designed to eliminate signal leakage between irregularly shaped non- and ice-covered areas (i.e. redistribute the mass loss underlying a cryosphere-attributed spherical har-15
monic representation across only ice containing nodes), it does not resolve spatial heterogeneity in mass loss between ice containing nodes (i.e. at the scale of individual outlet glaciers). In the Canadian Arctic, all ice containing nodes exhibit mass loss, ex-cept for a small portion of the southeast tip of Baffin Island, where the ensemble mean inversion infers a small area of mass gain. Similar to the local maximum in absolute 20
discrepancy in North Baffin Bay, we interpret this small region of mass gain on Baffin Island as an artifact of the inversion satisfying the spherical harmonic solution over non-ice containing nodes. The Canadian Arctic mass loss is concentrated in numerous discrete ice masses whereFi j →1. The magnitudes of the rate of mass change inferred by the inversion are broadly consistent with independent altimetry-derived estimates of 25
TCD
7, 3417–3447, 2013Constraining GRACE signal to ice-covered
areas
W. Colgan et al.
Title Page
Abstract Introduction
Conclusions References
Tables Figures
◭ ◮
◭ ◮
Back Close
Full Screen / Esc
Printer-friendly Version Interactive Discussion
Discussion
P
a
per
|
D
iscussion
P
a
per
|
Discussion
P
a
per
|
Discuss
ion
P
a
per
|
The Monte Carlo inversion approach infers a total Greenland mass change of −251±25 Gt yr−1over the December 2003 to December 2010 period. We note that the absolute magnitude of this mass change is dependent on the mascon solution under-lying the input spherical harmonic representation, and therefore does not constitute an independent assessment of GrIS mass loss. Our statistical partition based on fractional 5
ice coverage information infers that the GrIS was responsible for−218±20 Gt yr−1 of mass change, while GrPGIC were responsible for −34±5 Gt yr−1 of mass change (Fig. 11). This suggests that peripheral glaciers accounted for ∼14 % of Greenland’s mass change over the study period. Using satellite laser altimetry and a firn compaction model, Bolch et al. (2013) estimated an October 2003 to March 2008 mass loss of 10
28±11 Gt yr−1 from GrPGIC substantially independent from the ice sheet, which had an ice-covered area of∼89×103km2 (c.f. ∼88×103km2 used in this study; Citterio and Ahlstrøm, 2013). When Bolch et al. (2013) also include GrPGIC with “strong con-nectivity” (∼130×103km2), they found a mass loss of 41± 16 Gt yr−1 over the same period. Our inversion attributes a total Canadian High Arctic mass change of−48±8 15
Gt yr−1, comprised of a contribution of−28±4 Gt yr−1 from Ellesmere and Devon Is-lands and −20±4 Gt yr−1 from Baffin Island. The error bars of this Canadian Arctic Archipelago mass loss overlap with those of a recent estimate of 61±7 Gt yr−1over the March 2003 to December 2009 period (Gardner et al., 2011).
4 Discussion
20
Presently, individual studies of GRACE-derived total Greenland rate of mass changes range from −195±30 Gt yr−1 (from August 2003 to July 2009; Pritchard et al., 2011) to−234±29 Gt yr−1(from August 2002 to September 2011; Sasgen et al., 2012). This range in total Greenland mass change inferred by various GRACE studies has been attributed to differences in both temporal sampling period and the treatment of signal 25
TCD
7, 3417–3447, 2013Constraining GRACE signal to ice-covered
areas
W. Colgan et al.
Title Page
Abstract Introduction
Conclusions References
Tables Figures
◭ ◮
◭ ◮
Back Close
Full Screen / Esc
Printer-friendly Version Interactive Discussion
Discussion
P
a
per
|
D
iscussion
P
a
per
|
Discussion
P
a
per
|
Discuss
ion
P
a
per
|
mascon solution we employ agrees within the error bars of other GRACE-derived mass change estimates over the IMBIE period (Shepherd et al., 2012). We note, how-ever, that fully iterated NASA GSFC mascon solutions, including those employed in our present study, have been shown to produce greater mass loss values in comparison to non-iterated NASA GSFC mascon solutions (Luthcke et al., 2013). We therefore ac-5
knowledge that initializing the Monte Carlo inversion with a different spherical harmonic representation of GRACE-derived mascon solutions would yield a different inferred mass loss distribution. Acknowledging this limitation, we contend that our present study demonstrates the utility of combining spherical harmonics with additional information in the form of fractional ice coverage. By explicitly constraining cryosphere-attributed 10
mass changes to irregularly shaped ice-covered areas, we purport to have completely eliminated signal leakage between non- and ice-covered areas.
Global small glaciers and ice caps external to Greenland and Antarctica experienced 148±30 Gt yr−1 of mass loss over the January 2003 to December 2010 period (Ja-cob et al., 2012). Our estimate of GrPG mass change over a nearly identical period 15
is∼23 % of this value (−34±5 Gt yr−1). To project the future sea level rise contribu-tion of peripheral glaciers in Greenland and Antarctica in the 2007 Intergovernmental Panel on Climate Change report “the global [glaciers and ice caps] sea level contri-bution [was] increased by a factor of 1.2 to include [peripheral glaciers] in Greenland and Antarctica” (Meehl et al., 2007). Our results suggest a factor of>1.2 would be re-20
quired to account for GrPGIC alone when using this scaling technique. We regard our GrPGIC contribution as a lower bound, however, due to: (i) the potential underestima-tion of GrPGIC ice extent. The dataset of Greenland ice sheet and peripheral glaciers we employ (Citterio and Ahlstrøm, 2013) does not classify as GrPGIC those glaciers demonstrating “strong” connectivity with the ice sheet proper (e.g., Geikie Peninsula or 25
TCD
7, 3417–3447, 2013Constraining GRACE signal to ice-covered
areas
W. Colgan et al.
Title Page
Abstract Introduction
Conclusions References
Tables Figures
◭ ◮
◭ ◮
Back Close
Full Screen / Esc
Printer-friendly Version Interactive Discussion
Discussion
P
a
per
|
D
iscussion
P
a
per
|
Discussion
P
a
per
|
Discuss
ion
P
a
per
|
500 m between 1994 and 2012 (McGrath et al., 2013), and the historical expectation that smaller glaciers should respond faster to climate forcing than the larger ice sheet (Oerlemans, 1989), we suggest that it would be reasonable to preferentially weight the total mass change inferred at common GrPGIC and GrIS nodes towards GrPGIC mass change. With GrPGIC comprising<5 % of Greenland’s ice-covered area but∼14 % of 5
its total mass loss, the specific contribution of GrPGIC to Greenland total mass loss far exceeds the specific contribution of the GrIS.
The substantial contribution of GrPGIC to Greenland’s total mass loss suggests that GRACE-derived estimates of total Greenland mass loss (i.e. GrIS+GrPGIC) should only be compared with mass loss estimates derived by volumetric or input-output ap-10
proaches that similarly sample both the ice sheet proper and peripheral glaciers. By sampling the GrPGIC in addition to the GrIS, GRACE-derived mass loss estimates can be expected to be biased by ∼35 Gt yr−1 more mass loss than volumetric or input-output methods that only sample the ice sheet proper (c.f. Alley et al., 2007; Pritchard et al., 2010). Addressing this bias is especially pertinent when demonstrating congru-15
ency between input-output derived (i.e. modelled surface mass balance minus ice dis-charge) and GRACE-derived total mass change time-series (e.g. Sasgen et al., 2012; Shepherd et al., 2012). While GRACE implicitly samples the mass changes associated with GrPGIC, whether or not these other methods include GrPGIC is dependent on the ice mask employed, which often varies from study to study (Vernon et al., 2013). Our 20
partition between GrIS and GrPGIC mass loss suggests a first-order correction could be made by multiplying GRACE-derived total Greenland mass loss values by 0.86 to estimate the GrIS contribution. Similarly, multiplying GRACE-derived total Greenland mass loss by 0.14 provides a first-order estimate for the GrPGIC contribution. This par-tition ratio, however, is likely time-variant, and therefore only pertains to the December 25
TCD
7, 3417–3447, 2013Constraining GRACE signal to ice-covered
areas
W. Colgan et al.
Title Page
Abstract Introduction
Conclusions References
Tables Figures
◭ ◮
◭ ◮
Back Close
Full Screen / Esc
Printer-friendly Version Interactive Discussion
Discussion
P
a
per
|
D
iscussion
P
a
per
|
Discussion
P
a
per
|
Discuss
ion
P
a
per
|
5 Summary remarks
Our Monte Carlo inversion analysis closely reproduces a spherical harmonic repre-sentation of cryosphere-attributed mascons derived from GRACE with inferred mass changes constrained to only occur at ice-containing nodes. This approach can be used to invert any given mass change represented in the form of spherical harmonic coeffi -5
cients, as long as accompanying information of the ground level spatial distribution of the process associated with the mass change is available (i.e. groundwater aquifers). The inferred spatial distribution and magnitude of ground level rate of mass change is fully consistent with spherical harmonic coefficients. Unlike other techniques, a Monte Carlo inversion approach does not require an assumption that rates of mass change 10
are constant within or across pre-defined regions, such as drainage systems. While the resultant higher spatial resolution inferred mass change field does not constitute an independent estimate of mass change from the mascons used to derive the input spherical harmonic representation, it does provide information on the most likely spa-tial structure underlying the input spherical harmonic representation. This higher spaspa-tial 15
resolution field offers the potential to compare GRACE-derived estimates of ice sheet mass change with other observational and modeled mass change estimates with more precise spatial resolution than previously possible.
In the context of Greenland, the higher spatial resolution of the inferred underlying field, combined with the robust uncertainty bounds provided by Monte Carlo, allows 20
mass loss to be partitioned between groups of nodes. The inference that Greenland’s peripheral glaciers and ice caps, which comprise <5 % of Greenland’s ice covered area, are contributing to∼14 % of Greenland’s total mass loss, suggests that GRACE-derived estimates of “Greenland” mass loss cannot reasonably be taken as synony-mous with “Greenland ice sheet” mass loss. Comparisons of GRACE-derived mass 25
TCD
7, 3417–3447, 2013Constraining GRACE signal to ice-covered
areas
W. Colgan et al.
Title Page
Abstract Introduction
Conclusions References
Tables Figures
◭ ◮
◭ ◮
Back Close
Full Screen / Esc
Printer-friendly Version Interactive Discussion
Discussion
P
a
per
|
D
iscussion
P
a
per
|
Discussion
P
a
per
|
Discuss
ion
P
a
per
|
loss. The absolute mass loss inferred for Greenland’s peripheral glaciers and ice caps exceeds that inferred for all ice masses on Ellesmere and Devon Islands combined. Given substantial differences in specific contribution, our statistical partition of mass loss between the Greenland ice sheet and peripheral glaciers and ice caps supports the historical expectation that smaller glaciers are expected to respond faster to climate 5
change than the larger ice sheet.
Acknowledgements. This work was supported by NASA award NNX10AR76G. This work uti-lized the Janus supercomputer, which is supported by NSF award CNS-0821794 and the Uni-versity of Colorado Boulder. The Janus supercomputer is a joint effort of the University of Col-orado Boulder, the University of ColCol-orado Denver and the National Center for Atmospheric
10
Research. W.C. thanks Joel Frahm for his assistance working with Janus. We thank Laurent Longuevergne for reviewing an earlier version of this manuscript.
References
Alley, R., Spencer, M., and Anandakrishnan, S.: Ice-sheet mass balance: assessment, attribu-tion and prognosis, Ann. Glaciol., 46, 1–7, 2007.
15
Arendt, A., Bolch, T., Cogley, J. G., Gardner, A., Hagen, J.-O., Hock, R., Kaser, G., Pfeffer, W. T., Moholdt, G., Paul, F., V. Radic, Andreassen, L., Bajracharya, S., Beedle, M., Berthier, E., Bhambri, R., Bliss, A., Brown, I., Burgess, E., Burgess, D., Cawkwell, F., Chinn, T., Copland, L., Davies, B., De Angelis, H., Dolgova, E., Filbert, K., Forester, R., Fountain, A., Frey, H., Giffen, B., Glasser, N., Gurney, S., Hagg, W., Hall, D., Haritashya, U. K., Hartmann, G., Helm,
20
C., Herreid, S., Howat, I., Kapustin, G., Khromova, T., Kienholz, C., Koenig, M., Kohler, J., Kriegel, D., Kutuzov, S., Lavrentiev, I., LeBris, R., Lund, J., Manley, W., Mayer, C., Miles, E., Li, X., Menounos, B., Mercer, A., Moelg, N., Mool, P., Nosenko, G., Negrete, A., Nuth, C., Pettersson, R., and Racoviteanu, A.: Randolph Glacier Inventory version 2.0: a Dataset of Global Glacier Outlines, Global Land Ice Measurements from Space, Digital Media, Boulder,
25
Colorado, USA, 2012.
TCD
7, 3417–3447, 2013Constraining GRACE signal to ice-covered
areas
W. Colgan et al.
Title Page
Abstract Introduction
Conclusions References
Tables Figures
◭ ◮
◭ ◮
Back Close
Full Screen / Esc
Printer-friendly Version Interactive Discussion
Discussion
P
a
per
|
D
iscussion
P
a
per
|
Discussion
P
a
per
|
Discuss
ion
P
a
per
|
Bolch, T., Sørensen, L. S., Simonsen, S., Mölg, N., Machguth, H., Rastner, P., and Paul, F.: Mass loss of Greenland’s glaciers and ice caps 2003–2008 revealed from ICESat laser altimetry data, Geophys. Res. Lett., 40, 875–881, doi:10.1002/grl.50270, 2013.
Chandler, D., Hubbard, A., Hubbard, B., and Nienow, P.: A Monte Carlo error analysis for basal sliding velocity calculations, J. Geophys. Res., 111, F04005, doi:10.1029/2006JF000476,
5
2006.
Chen, J., Wilson, C., and Tapley, B.: Interannual variability of Greenland ice losses from satellite gravimetry, J. Geophys. Res., 116, B07406, doi:10.1029/2010JB007789, 2011.
Citterio, M. and Ahlstrøm, A. P.:Brief communication“The aerophotogrammetric map of Green-land ice masses”, The Cryosphere, 7, 445–449, doi:10.5194/tc-7-445-2013, 2013.
10
Colgan, W., Pfeffer, W. T., Rajaram, H., Abdalati, W., and Balog, J.: Monte Carlo ice flow modeling projects a new stable configuration for Columbia Glacier, Alaska, c. 2020, The Cryosphere, 6, 1395–1409, doi:10.5194/tc-6-1395-2012, 2012.
Gardner, A., Moholdt, G., Wouters, B., Wolken, G., Burgess, D., Sharp, M., Cogley, J., Braun, C., and Labine, C.: Sharply increased mass loss from glaciers and ice caps in the Canadian
15
Arctic Archipelago, Nature, 473, 357–360, doi:10.1038/nature10089, 2011.
Guo, J., Duan, X., and Shuman, C.: Non-isotropic Gaussian smoothing and leakage reduction for determining mass changes over land and ocean using GRACE data, Geophys. J. Int., 181, 290–302, 2010.
Horwath, M. and Dietrich, R.: Signal and error in mass change inferences from GRACE: the
20
case of Antarctica, Geophys. J. Int., 177, 849–864, doi:10.1111/j.1365-246X.2009.04139.x, 2009.
Longuevergne, L., Scanlon, B., and Wilson, C.: GRACE Hydrological estimates for small basins: Evaluating processing approaches on the High Plains Aquifer, USA, Water Resour. Res., 46, W11517, doi:10.1029/2009WR008564, 2010.
25
Luthcke, S., Zwally, H., Abdalati, W., Rowlands, D., Ray, R., Nerem, R., Lemoine, F., Mc-Carthy, J., and Chinn, D.: Recent greenland ice mass loss by drainage system from satellite gravity observations, Science, 314, 1286–1289, 2006a.
Luthcke, S., Rowlands, D., Lemoine, F., Klosko, S., Chinn, D., and McCarthy, J.: Monthly spher-ical harmonic gravity field solutions determined from GRACE inter-satellite range-rate data
30
TCD
7, 3417–3447, 2013Constraining GRACE signal to ice-covered
areas
W. Colgan et al.
Title Page
Abstract Introduction
Conclusions References
Tables Figures
◭ ◮
◭ ◮
Back Close
Full Screen / Esc
Printer-friendly Version Interactive Discussion
Discussion
P
a
per
|
D
iscussion
P
a
per
|
Discussion
P
a
per
|
Discuss
ion
P
a
per
|
Luthcke, S., Sabaka, T., Loomis, B., Arendt, A., McCarthy, J., and Camp, J.: Antarctica, Green-land and Gulf of Alaska Green-land ice evolution from and iterated GRACE global mascon solution, J. Glaciol., in press, 2013.
McGrath, D., Colgan, W., Bayou, N., Muto, A., and Steffen, K.: Recent warming at Sum-mit, Greenland: global context and implications, Geophys. Res. Lett., 40, 2091–2096,
5
doi:10.1002/grl.50456, 2013.
Meehl, G. A., Stocker, T. F., Collins, W. D., Friedlingstein, P., Gaye, A. T., Gregory, J. M., Ki-toh, A., Knutti, R., Murphy, J. M., Noda, A., Raper, S. C. B., Watterson, I. G., Weaver A. J., and Zhao, Z.-C.: Global climate projections, in: Climate Change 2007: The Physical Science Basis, Contribution of Working Group I to the Fourth Assessment Report of the
Intergovern-10
mental Panel on Climate Change, edited by: Solomon, S., Qin, D., Manning, M., Chen, Z., Marquis, M., Averyt, K. B., Tignor, M., and Miller, H. L.: Cambridge University Press, 2007. Muto, A., Scambos, T., Steffen, K., Slater, A., and Clow, G.: Recent surface temperature trends
in the interior of East Antarctica from borehole firn temperature measurements and geophys-ical inverse methods, Geophys. Res. Lett., 38, L15502, doi:10.1029/2011GL048086, 2011.
15
Oerlemans, J: On the response of valley glaciers to climatic change, in: Glacier Fluctuations and Climatic Change, edited by: Oerlemans, J., 353–371, 1989.
Pritchard, H., Lutchke, S., and Fleming, A.: Understanding ice-sheet mass balance: progress in satellite altimetry and gravimetry, J. Glaciol., 56, 1151–1161, 2010.
Rastner, P., Bolch, T., Mölg, N., Machguth, H., Le Bris, R., and Paul, F.: The first complete
20
inventory of the local glaciers and ice caps on Greenland, The Cryosphere, 6, 1483–1495, doi:10.5194/tc-6-1483-2012, 2012.
Rignot, E., Box, J., Burgess, E., and Hanna, E.: Mass balance of the Greenland ice sheet from 1958 to 2007, Geophys. Res. Lett., 35, L20502, doi:10.1029/2008GL035417, 2008.
Sasgen, I., van den Broeke, M., Bamber, J., Rignot, E., Sørensen, L., Wouters, B., Martinec, Z.,
25
Velicogna, I., and Simonsen, S: Timing and origin of recent regional ice-mass loss in Green-land, Earth Planet. Sc. Lett., 334, 293–303, 2012.
Schrama, E. and Wouters, B.: Revisiting Greenland ice sheet mass loss observed by GRACE, J. Geophys. Res., 116, B02407, doi:10.1029/2009JB006847, 2011.
Shepherd, A., Ivins, E., Geruo, A., Barletta, V., Bentley, M., Bettadpur, S., Briggs, K., Bromwich,
30
TCD
7, 3417–3447, 2013Constraining GRACE signal to ice-covered
areas
W. Colgan et al.
Title Page
Abstract Introduction
Conclusions References
Tables Figures
◭ ◮
◭ ◮
Back Close
Full Screen / Esc
Printer-friendly Version Interactive Discussion
Discussion
P
a
per
|
D
iscussion
P
a
per
|
Discussion
P
a
per
|
Discuss
ion
P
a
per
|
Scambos, T., Scheuchl, B., Schrama, E., Smith, B., Sundal, A., van Angelen, J., van de Berg, W., van den Broeke, M., Vaughan, D., Velicogna, I., Wahr, J., Whitehouse, P., Wingham, D., Yi, D., Young, D., and Zwally, H.: A reconciled estimate of ice-sheet mass balance, Science, 338, 1183–119, 2012.
Simons, F., Dahlen, F., and Wieczorek, M.: Spatiospectral concentration on a
5
sphere, Society of Industrial and Applied Mathematics Review, 48, 504–536, doi:10.1137/S0036144504445765, 2006.
Velicogna, I. and Wahr, J.: Greenland mass balance from GRACE, Geophys. Res. Lett., 32, L18505, doi:10.1029/2005GL023955, 2005.
Velicogna, I. and Wahr, J.: Acceleration of Greenland ice mass loss in spring 2004, Nature,
10
443, 329–331, doi:10.1038/nature05168, 2006.
Vernon, C. L., Bamber, J. L., Box, J. E., van den Broeke, M. R., Fettweis, X., Hanna, E., and Huybrechts, P.: Surface mass balance model intercomparison for the Greenland ice sheet, The Cryosphere, 7, 599–614, doi:10.5194/tc-7-599-2013, 2013.
Zwally, H., Li, J., Brenner, A., Beckley, M., Cornejo, H., DiMarzio, J., Giovinetto, M.,
Neu-15
TCD
7, 3417–3447, 2013Constraining GRACE signal to ice-covered
areas
W. Colgan et al.
Title Page
Abstract Introduction
Conclusions References
Tables Figures
◭ ◮
◭ ◮
Back Close
Full Screen / Esc
Printer-friendly Version Interactive Discussion
Discussion
P
a
per
|
D
iscussion
P
a
per
|
Discussion
P
a
per
|
Discuss
ion
P
a
per
|
Fig. 1. (A)Cryosphere-attributed mass change as GRACE mascons (Luthcke et al., 2013).(B)
TCD
7, 3417–3447, 2013Constraining GRACE signal to ice-covered
areas
W. Colgan et al.
Title Page
Abstract Introduction
Conclusions References
Tables Figures
◭ ◮
◭ ◮
Back Close
Full Screen / Esc
Printer-friendly Version Interactive Discussion
Discussion
P
a
per
|
D
iscussion
P
a
per
|
Discussion
P
a
per
|
Discuss
ion
P
a
per
|
Fig. 4.The system of equations in each simulation is deemed converged when the inferred total rate of mass change over all Greenland ice coverage (both GrIS and GrPGIC) varies by less than 0.1 Gt yr−1
TCD
7, 3417–3447, 2013Constraining GRACE signal to ice-covered
areas
W. Colgan et al.
Title Page
Abstract Introduction
Conclusions References
Tables Figures
◭ ◮
◭ ◮
Back Close
Full Screen / Esc
Printer-friendly Version Interactive Discussion
Discussion
P
a
per
|
D
iscussion
P
a
per
|
Discussion
P
a
per
|
Discuss
ion
P
a
per
|
Fig. 5.Ensemble mean inferred rate of mass change field ( ˙m) at ice-containing nodes over nine sensitivity scenarios of various Gaussian smoothing lengths (σ) and non-ice containing node
˙
mi j threshold values. Top row:σ=150 km. Middle row:σ=200 km. Bottom row:σ=250 km. Left column: ˙mi jthreshold=0 kg m−2
yr−1
. Middle column: ˙mi jthreshold=15 kg m−2
yr−1
. Right column: ˙mi j threshold=30 kg m−2
yr−1
. Black contour lines denote irregularly shaped ice-containing nodes within the domain. White contour lines denote 0 kg m−2
yr−1
TCD
7, 3417–3447, 2013Constraining GRACE signal to ice-covered
areas
W. Colgan et al.
Title Page
Abstract Introduction
Conclusions References
Tables Figures
◭ ◮
◭ ◮
Back Close
Full Screen / Esc
Printer-friendly Version Interactive Discussion
Discussion
P
a
per
|
D
iscussion
P
a
per
|
Discussion
P
a
per
|
Discuss
ion
P
a
per
|
Fig. 9. (A)Ensemble mean inferred rate of mass change field ( ˙m) at ice-containing nodes. Grey shading denotes non-ice-containing nodes and the white contour line denotes 0 kg m−2
yr−1
.
TCD
7, 3417–3447, 2013Constraining GRACE signal to ice-covered
areas
W. Colgan et al.
Title Page
Abstract Introduction
Conclusions References
Tables Figures
◭ ◮
◭ ◮
Back Close
Full Screen / Esc
Printer-friendly Version Interactive Discussion
Discussion
P
a
per
|
D
iscussion
P
a
per
|
Discussion
P
a
per
|
Discuss
ion
P
a
per
|
Fig. 10. Inverted rate of mass change constrained to irregularly-shaped ice-covered areas in Greenland and the Canadian High Arctic (Fig. 9a). Color scale saturates at −750 and
TCD
7, 3417–3447, 2013Constraining GRACE signal to ice-covered
areas
W. Colgan et al.
Title Page
Abstract Introduction
Conclusions References
Tables Figures
◭ ◮
◭ ◮
Back Close
Full Screen / Esc
Printer-friendly Version Interactive Discussion
Discussion
P
a
per
|
D
iscussion
P
a
per
|
Discussion
P
a
per
|
Discuss
ion
P
a
per
|
540
541
Animation 1 - A sample Monte Carlo inversion to convergence over 94 iterations. This is 1 of 542
σ
∆
Fig. A1.A sample Monte Carlo inversion to convergence over 94 iterations. This is 1 of the 1000 simulations comprising the ensemble mean presented in Fig. 9. The layout of subplots and color scale limits follow Fig. 9.(A)Inferred rate of mass change field at ice-containing nodes ( ˙m). (B)Gaussian smoothing (σ=200 km) of the inferred rate of mass change field ( ˙M). (C)