ANFIS IN THE CHARACTERIZATION
OF FIBROSIS AND CARCINOMA
USING LUNG CT IMAGES
D. Lakshmi *
Research Scholar, Sathyabama University, Chennai, Tamil Nadu, India.
Roy Santhosham
Professor-Department of Radiology, Sri Ramachandra Medical College.
Consultant Radiologist,
Santosham Chest Hospital, Chennai, Tamil Nadu, India. [email protected]
H. Ranganathan
Principal,
Rajiv Gandhi College of Engineering, Chennai, Tamil Nadu, India.
Abstract
The diagnosis of tuberculosis and lung cancer is difficult, as symptoms of both diseases are similar. Due to high TB prevalence and radiological similarities, a large number of lung cancer patients initially get wrongly treated for tuberculosis based on radiological picture alone. However, treating TB leads to inflammatory fibrosis in some of the patients. In all these cases, the diagnosis is confirmed only with a biopsy which is an invasive technique that is usually performed via Bronchoscopy or CT – guided biopsy. There comes the need of an efficient Computer Aided Diagnosis(CAD) of the fibrosis and adenocarcinoma diseases. The increased chance of characterizing tissues with the help of CAD and the achievable workload reduction for the radiologist demand the usage of these systems in CT screenings as well as daily hospital practice. Generally, the CAD is designed based on the Region of Interest(ROI) given by the radiologist which makes the system semi-automatic. Our work presents a fully automated method of characterization of carcinoma from other lung abnormalities namely fibrosis and suspicious of tuberculosis. A comparison study is also done by evaluating the performance of Adaptive Neuro-Fuzzy Inference System(ANFIS) as a Classifier with three set of features. These feature set include entropy and parameters extracted by Gray Level Co-Occurrence Matrix(GLCM) and Gray Level Run Length Matrix(GLRLM).
Key words: Computer Aided Diagnosis; Image Processing; ANFIS
1. Introduction
[Zhou X et al. (2006)]. Delia Mitrea et al. (2012) experimented that hepto-cellular carcinoma and colonic tumor can be well characterized by gray level co occurrence and edge orientation co occurrence matrix of superior order. These superior order textural features have increased the malignant tumour classification performance. Sieren J C et al. (2010) proposed an automated segmentation approach for highlighting the histological composition of lung tumor. But, this protocol does not provide access to non-cancerous nodule. Jeng et al. (2002) presented a multi-modal thresholding method for simulated data based on the combination of regularization and statistical approaches by modeling the histogram with a mixture of Gaussian density. But, the experiments with real time images reveal the robustness of the above method because their histograms do not form genuine Gaussian mixture densities. So, smoothening the Gaussian function may improve the result. . These days, artificial neural network is also used as a classifier in the diagnosis of lung cancer. Ivan. O. Rosas et al. (2011) demonstrated that his computer program was able to detect varying severity of Interstitial Lung Diseases(ILD), including early or mild disease, and they found correlation between computer scores and pulmonary function tests that was most evident in subjects with moderate to severe ILD. Adrien Depeursinge et al. (2011) have developed a near affine –invariant texture feature set that efficiently characterizes five lung tissue patterns in HRCT imaging with statistically significant improvements when compared to density based features and standard discrete wavelet frames. But, the limitation is that no directional analysis is carried out. In all the above research paper, work has been focussed mostly on the analysis of CT-scan images to detect the type of tumor and other anomalies of the lungs considering region of interest given by the radiologist. However, minimum work has been done in attempting with automatically classify tissue classes based on the CT images. The general practice for determining tissue class is to perform a histopathological analysis on tissue samples obtained by invasive techniques such as a needle biopsy. As time and cost are crucial factors, when it comes to the treatment of lung anomalies, an automated image based classifier could act as a precursor to histopathological analysis, thus creating way to class specific treatment procedures. Henceforth, we attempt to automatically characterize the carcinoma tissues from non-carcinoma tissues without the human intervention using CT images.
2. Subjects and Methods
2.1. Subject selection and data set
Multi-Slice chest Low-Dose CT images from 18 subjects are taken as dataset for our scheme. Each subject was imaged with tube voltage of 120kV, tube current ranging between 120mA – 220mA and slice thickness between 0.3mm – 0.7mm. These images are stored in Digital Imaging and Communications in Medicine(DICOM) format. These 18 subjects include 7 healthy, 2 fibrosis, 8 carcinoma(7 adenocarcinoma and 1 adeno squamous) and 1 showing necrosis- ill defined granulomas suspicious of tuberculosis cases. This class distribution of lung tissue is confirmed by histopathological test which is taken as the reference. The data set is built by taking individual slices of each patient expressed as 512 x 512 matrix with a 8- bit gray-level and is stored in Bit-Map format. The number of slices representing healthy person is 113, fibrosis is 103, carcinoma is 185 and the suspicious of tuberculosis case is 39. In view of characterizing carcinoma, we combine fibrosis and necrosis to be the other cases.
2.2. Proposed method
Fig. 1
2.2.1. Image segmentation
The process involves seven steps. Each of these steps is described in detail.
Step 1: The original image as shown in fig.2a is processed to trace the boundary of the thorax which is here the parent boundary considering connected component analysis. This is shown in fig. 2b.
Step 2: Then the image is filled with actual gray levels inside the parent boundary. The resultant image is obtained with the entire thorax as the region of interest suppressing all other areas as shown in fig. 2c.
Step 3: Now with bone(255) as the reference, the highest three child boundaries are traced. The reason to chose highest three child boundaries is to extract the lung parenchyma clearly as shown in fig. 2d.
Step 4: Then, a temporary image is built using morphological processing which is shown in fig. 2e.
Step 5: The goal of this step is to separate the tissue from air filled region and fat. The histogram of lung CT image clearly shows that air and human tissue can easily be separated by the threshold T1 as shown in fig. 3. The image obtained from step 2 is thresholded with T1 and filled with the actual gray level to obtain tissue areas that are present inside the thorax as shown in fig. 2f
Step 6: Then, using the threshold T2, the human tissue regions inside the lung are extracted from the fat with the information that the probability of availability of fat inside the lung region is almost negligible. Fig. 2g shows the tissue areas inside the lung.
Step 7: Performing AND operation of the images obtained from the above two steps will give the image with only the tissues outside the lung as shown in fig. 2h.
2.2.2 Feature extraction
Gray - Level Spatial Dependence Matrix Parameters:The gray – level spatial dependence matrix approach, introduced by Haralick[Haralick et al (1973)], a well known statistical method for extracting texture based features is used for this study. This method is based on the estimation of second order joint conditional probability function C(i,j/d,θ) where θ = 0,45,90,135 degrees. Each C(i,j/d,θ) is the probability of going from gray level i to gray level j, given that the inter sample space is d and the direction is given by angle θ. This is also known as co-occurrence matrix. The co-occurrence matrix is calculated for carcinomas as well as non-carcinoma tissues. Four features are calculated for each value of θ with d chosen to be 1 from this matrix. Totally, 16 features are extracted for each CT image. The sixteen features include contrast, correlation, homogeneity and energy in all four directions. Entropy is yet another statistical measure of randomness that can be used to characterize the texture of the input image. Statistically, it is used to find the level of equiprobability of gray levels. So, entropy inside and outside the lung were added to the list of features resulting in 18 number of features given as the input to the classifier model.
Long Run Emphasis (LRE), Gray-Level Nonuniformity (GLN), Run Length Nonuniformity (RLN), Run Percentage (RP), Low Gray-Level Run Emphasis (LGRE), High Gray-Level Run Emphasis (HGRE), Short Run Low Level Emphasis (SRLGE), Short Run High Level Emphasis (SRHGE), Long Run Low Gray-Level Emphasis (LRLGE), Long Run High Gray-Gray-Level Emphasis (LRHGE). Therefore, the above 11 run length features are calculated from each run length matrix resulting in 44 features.
Fig.2 a)Original image b) Thorax boundary c) Extraction of entire thorax d) highest three child boundaries e) Temporary image f) Extraction of tissue gray-levels in the entire thorax g) Extraction of only tissue gray-levels in the lung parenchyma h) Extraction of tissue gray-levels
outside the lung parenchyma
Fig. 3
2.2.3. Classifier model ANFIS Classifier
The classifier constructs fuzzy inference system(FIS) using input/output data set whose membership function parameters are adjusted using back propagation algorithm in combination with a least squares type of method. This adjustment allows your fuzzy systems to learn from the data they are modelling. A network-type structure similar to that of a neural network, which maps inputs through input membership functions and associated parameters, and then through output membership functions and associated parameters to outputs, can be used to interpret the input/output map. The parameters associated with the membership functions changes through the learning process. The computation of these parameters is facilitated by a gradient vector. This gradient vector provides a measure of how well the fuzzy inference system is modelling the input/output data for a given set of parameters. When the gradient vector is obtained, any of several optimization routines can be applied in order to adjust the parameters to reduce some error measure. This error measure is usually defined by the sum of the squared difference between actual and desired outputs. The number of training data is 337, out of which 90 represents healthy cases, 147 represents carcinoma cases and 100 represents other cases. The number of testing data includes 23 healthy, 38 carcinoma and 42 other cases. The other cases includes fibrosis and necrosis cases.
2.2.4. Feature selection
Factor Analysis is primarily used for data reduction or structure detection. The purpose of data reduction is to remove redundant variables from the data set, perhaps replacing the entire data file with a smaller number of uncorrelated variables. The principal components method of extraction begins by finding a linear combination of variables that accounts for as much variation in the original variables as possible. It then finds another component that accounts for as much of the remaining variation as possible and is uncorrelated with the previous component, continuing in this way until there are as many components as original variables. Usually, a few components will account for most of the variation, and these components can be used to replace the original variables. This method is most often used to reduce the number of variables in the dataset. The factor analysis of feature set 1 leads to 3 variables, feature set 2 leads to 5 variables and feature set 3 leads to 5 variables. 3. Results
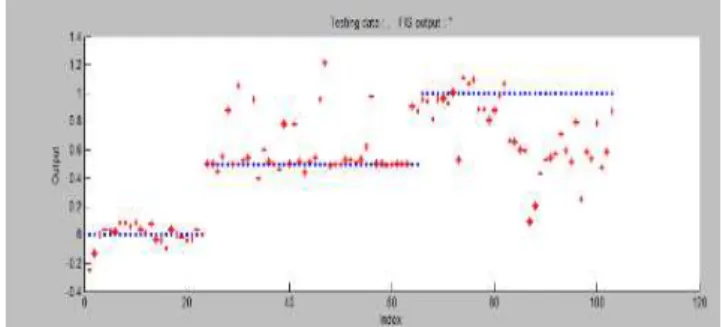
Fig. 4 Performance of ANFIS Classifier with GLCM based feature set and entropy
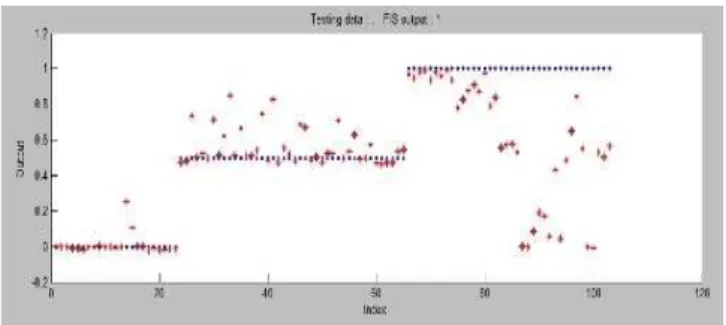
Fig. 4a Performance of ANFIS classifier with GLCM based feature set and entropy after factor analysis
Fig. 5 Performance of ANFIS Classifier with GLRLM based feature set
Fig. 5a Performance of ANFIS Classifier with GLRLM based feature set after factor analysis
Fig. 6a Performance of ANFIS Classifier with GLCM, GLRLM based feature set and entropy after factor analysis
4. Discussion
Any lung discomfort needs to be thoroughly investigated. Depending up on the ailment, timely corrective treatment must be taken. Simple cough and cold may pose symptoms of an advanced lung disease. With deaths due to lung cancer increasing, it becomes important to investigate chronic conditions immediately. For our analysis, a person complaining of cough and mild breathing trouble is considered to be healthy or normal if the CT images of that person do not show any signs of fibrosis or carcinoma. The CT images from such a person can be added to the library for reference. They can become helpful while diagnosing future patients with problems. Ingrid C. Suimer et al. (2003) investigated the performance of CAD in high resolution lung CT using the local ROI with the radiologist performance. Hitherto image processing approaches envisaged the radiologist to mark the ROI in the CT images so that further processing could be made. Such marking of ROI in CT images calls for specific, specialist and professional knowledge. Our method processes the images as a whole and ROI is marked during the diagnosis process. Our choice of normalized 62 features makes it possible for CAD to identify if a particular CT image is that of a healthy person or that of person with fibrosis or carcinoma. Yongjun WU et al. (2010) reported that the accuracy rates of prediction of lung cancer to all the samples according to the BP-ANN and Logistic regression equation were 96.6% and 84.6%. Petkovska et al. (2006) has found that analysis based on contrast enhancement maps of indeterminate nodules imaged with contrast enhanced CT can distinguish benign only 84% from malignant nodules. Sang Ok Park et al. (2009) presented an automated quantification system for various regional patterns of diffuse interstitial lung diseases using HRCT images. The overall accuracy of the system to classify each disease pattern based on the typical ROIs was 89%. We proceeded with the available CT images in training the classifier. We had the benefit of the knowledge if each of the images is that of a healthy person or that of a patient. We have tried different feature set given to ANFIS for characterizing the lung tissues. Fig. 4 – 6 clearly shows that the co-occurrence matrix based parameters, entropy play a vital role in characterizing tissues without the knowledge of region of interest to be given by radiologist.
5. Conclusion
In the current study, the performance of ANFIS classifier in characterizing carcinoma tissues from healthy and non-carcinoma cases was evaluated. It has been shown that the ANFIS classifier shows acceptable performance in characterizing carcinomas tissue from other tissues. The number of essential features was obtained by factor analysis to analysis further improvement in the performance of classifier. Thus, it is clearly shown that before and after factor analysis feature set 1, with careful imaging protocols and the use of automated objective analysis of images without the prior knowledge of region of interest, it is possible to characterize the lung tissues from CT images.
Acknowledgement
This research work was supported by the Santosham Chest Hospital, Chennai. We thank the management and technician of this hospital for giving us their support in sharing their database to carry out this work.
References
[1] Singh, V.K., et al (2009): A common medical error:lung cancer misdiagnosed as sputum negative tuberculosis. Asian Pacific Journal
of Cancer, 335-8, PMID: 19640168.
[2] Veronesi, G.; Bellomi M.; Mulshine J. (2008): Lung Cancer screening with low-dose computed tomography: A non-invasive
diagnostic protocol for baseline lung nodules. Lung Cancer (Amsterdam, Netherland, 61, issue 3: 340-9, PMID: 18308420.
[3] Zhou, X.; Hayashi, T.; Hara, T. (2006): Automatic Segmentation and recognition of anatomical lung structures from high-resolution
chest CT images, Computerized Medical Imaging and Graphics, 30, issue 5: 299 -313, PMID: 16920331.
[4] Delia Mitrea, et al. (2012): Abdominal Tumor Characterization and Recognition Using Superior-Order Cooccurrence Matrices, Based
on Ultrasound Images, Comput Math Methods Med, doi: 10.1155/2012/348135, PMCID: PMC3270540.
[5] Sieren, J. C, et al. (2010): An Automated Segmentation Approach for Highlighting the Histological Complexity of Human Lung
Cancer. Ann Biomed Eng., December 38(12): 3581–3591, PMCID: PMC2996273.
[6] Chang, J.; Fan, K.; Chang, Y. (2002): Multi-modal gray-level histogram modeling and decomposition. Image and Vision Computing.
[7] Rosas, O., et al. (2011): Automated Quantification of High- Resolution CT scan Findings in Individuals at Risk for Pulmonary Fibrosis, CHEST. 140(6): 1590-1597.
[8] Adrien Depeursinge, et al. (2011): Near Affine-Invariant Texture Learning for Lung Tissue Analysis Using Isotropic Wavelet Frames.
IEEE Transactions on Information Technology in Biomedicine.; 6, no.4: 665-675.
[9] Haralick, R. M.; Dinstein, I.; Shanmugam, K. (1973) Textural Features for Image Classification. IEEE Transactions on systems, man
and cybernetics. 3, issue-6: 610-621.
[10] Xiaoou Tang et al. (1998) Texture Information in Run-Length Matrices. IEEE Transactions on Image Processing. 7, no.11: 1602-1609.
[11] Sluimer, C., et al. (2003): Computer Aided Diagnosis in high resolution CT of the lungs,Med. Phys. December; 30 .12.
[12] Yongjun, W. U., et al., (2010): Application of Artificial Neural Networks in the Diagnosis of Lung Cancer by Computed Tomography.
Sixth International Conference on Natural Computation (ICNC), 978-1-4244-5261-2/10.
[13] Petkovska, I., et al. (2006): Pulmonary nodule characterization: A comparison of conventional with quantitative and visual
semi-quantitative analysis using contrast enhancement maps. European Journal of Radiology.;59, issue- 2: 244-252.
[14] Sang Ok Park, et al. (2009): Feasibility of Automated Quantification of Regional Disease Patterns Depicted on High Resolution