www.nat-hazards-earth-syst-sci.net/12/1463/2012/ doi:10.5194/nhess-12-1463-2012
© Author(s) 2012. CC Attribution 3.0 License.
and Earth
System Sciences
Comparable analysis of the distribution functions of runup heights
of the 1896, 1933 and 2011 Japanese Tsunamis in the Sanriku area
B. H. Choi1, B. I. Min2, E. Pelinovsky3, Y. Tsuji4, and K. O. Kim5
1Department of Civil and Environmental Engineering, Sungkyunkwan University, Suwon, Korea
2Nuclear Environment Safety Research Division, Korea Atomic Energy Research Institute, P.O. Box 105, Yuseong, Daejeon, 305-600, Korea
3Department of Nonlinear Geophysical Processes, Institute of Applied Physics, Nizhny Novgorod, Russia 4Earthquake Research Institute, Tokyo University, Tokyo, Japan
5Korea Ocean Research & Development Institute, Ansan, Korea
Correspondence to:E. Pelinovsky (pelinovsky@hydro.appl.sci-nnov.ru)
Received: 7 December 2011 – Revised: 12 March 2012 – Accepted: 22 March 2012 – Published: 16 May 2012
Abstract. Data from a field survey of the 2011 Tohoku-oki tsunami in the Sanriku area of Japan is used to plot the distri-bution function of runup heights along the coast. It is shown that the distribution function can be approximated by a theo-retical log-normal curve. The characteristics of the distribu-tion funcdistribu-tions of the 2011 event are compared with data from two previous catastrophic tsunamis (1896 and 1933) that oc-curred in almost the same region. The number of observa-tions during the last tsunami is very large, which provides an opportunity to revise the conception of the distribution of tsunami wave heights and the relationship between statisti-cal characteristics and the number of observed runup heights suggested by Kajiura (1983) based on a small amount of data on previous tsunamis. The distribution function of the 2011 event demonstrates the sensitivity to the number of measure-ments (many of them cannot be considered independent mea-surements) and can be used to determine the characteristic scale of the coast, which corresponds to the statistical inde-pendence of observed wave heights.
1 Introduction
A very strong earthquake (M=9.0) occurred at 14 h 46 m (JST) on 11 March 2011 in the Pacific Sea. The event occurred east of the Tohoku district and near the northeast part of Honshu Island, Japan. A huge tsunami accompanied the earthquake; as of 14 July 2011, estimated 16 011 people were killed and 5242 people are missing and presumed lost. The total of those numbers is 26 347, which is greater than the number of the victims of the 1896 Meiji Sanriku
earth-quake tsunami (about 21 915). Many groups have conducted field surveys on the Sanriku coast, searched for traces of in-undation limits, and measured the runup heights. First results of study of the 2011 Tohoku-oki earthquake and tsunami are now published (Koketsu et al., 2011; Fujii et al., 2011; Hayashi et al., 2011; Ozaki, 2011; Tsuji et al., 2011).
Many cities in this area have been affected by historic tsunamis. For instance, the town of Taro was hit by the Meiji Sanriku tsunami of 1896, in which 2859 people (about 95 % of the total population) were killed. In 1933, this town was hit again by the Showa Sanriku tsunami, and 911 people were killed. The most recent tsunami entirely destroyed the newly-constructed sea wall, and all of the wooden houses in the new town area were swept away; additionally, approximately 200 people were killed there. In the residential area of the old town, seawater flooded over the old sea wall and destroyed almost all wooden houses; fortunately few people were killed there.
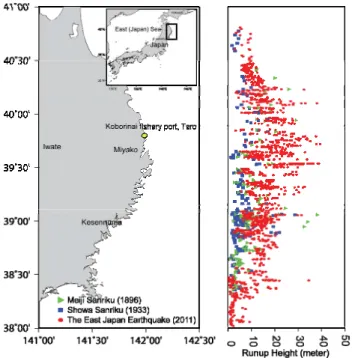
Fig. 1. Observed runup height distributions from the 1896, 1933, and 2011 tsunamis.
7 September 2011. The 2011 Tohoku Earthquake Tsunami Joint Survey Group, 2011).
The historical tsunami records of the Showa San-riku (1933) and Meiji SanSan-riku (1896) tsunamis were col-lected from published sources, and the analysis of these two events were compared with those of the 2011 Tohoku-oki tsunami. Locations of post-tsunami runup surveys in Japan and a spatial distribution of the maximum heights are shown in Fig. 1. The characteristics of the observations are summa-rized in Table 1. At nine points on the 25 km of coast between the town of Yamada and the northern limit of Miyako City, seawater rose up to heights exceeding 30 m.
However, measured maximum tsunami heights should be interpreted carefully because they are sometimes the heights of splash-up and are not representative of runup heights in a specific region. Even in a limited coastal region, the runup heights vary widely due to interactions between wave and coastal topography. As we demonstrate below, the concep-tion of the distribuconcep-tion funcconcep-tion can be useful to check ob-served data.
2 Distribution Functions of the observed runup heights
Numerical and statistical methods can be applied to analyze data and recover possible missing data. It is important to know the contribution of the highest wave height values, in-cluding missing data, to the total distribution of wave heights. Van-Dorn (1965) was the first to apply a statistical approach to analyze observed tsunami runup heights. He found that a
log-normal distribution was the best fit for tsunamis on the coast of the Hawaiian Islands. This distribution (mathemat-ically, a probability density function, pdf) has the following shape:
f (H )= 1
H σ√2πln10exp(−
(logH−a)2
2σ2 ) (1)
whereHis the maximum runup height for each point along the coast, measured in meters. This distribution has two pa-rameters with evident physical characteristics: a =<log H> is the average value of the wave height logarithm, andσ is the standard deviation of the height logarithm.
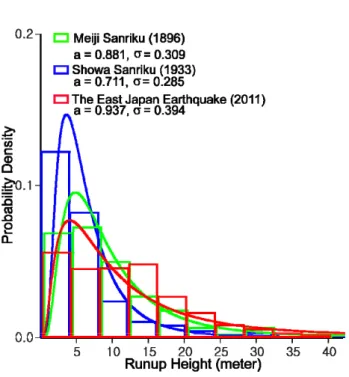
This analysis was continued by Kajiura (1983) with a spe-cial focus on the Japanese coast. He analyzed 6 events: 15-06-1896 Meiji Sanriku, 03-03-1933 Showa Sanriku, 12-21-1946 Nankaido, 05-23-1960 Chile, 06-16-1964 Niigata, and 05-16-1968 Tokashi-oki. Some of these events occurred in 1896 and 1933 in the Sanriku area in the same place as the 2011 event. Histograms of the observed tsunami runups in the total range of about 300 km of the coastal stretch for each event were approximated by the log-normal curve (1), and parameters of the distribution were determined and are given in Table 1. The distribution functions for Meiji San-riku (1896) and Showa SanSan-riku (1933) are reproduced in Fig. 2. We plotted it for different intervals of the runup height from 0.5 m, but only when the interval increases up to 4 m, the correlation with the log-normal curve seems more evi-dent. A similar histogram analysis was performed for the 2011 Tohoku-oki event based on field survey data; the his-togram and log-normal approximation from this analysis are presented in Fig. 2.
Table 1.Characteristics of Sanriku tsunamis.
Magnitude of Max Recorded Mean Standard Number of Earthquake Height, H, m Log H Deviation Log H observed stations
Meiji Sanriku (1896) 8.5 (Mw) 38.2 0.881 0.309 132
Showa Sanriku (1933) 8.4 (Mw) 28.7 0.711 0.285 205
Tohoku-oki Earthquake (2011) 9.0 (Mw) 40.4 0.937 0.394 Over 5000
Fig. 2. Histograms of three tsunamis with interval 4 m of runup height.
runup distributions. This problem can be resolved with the use of integral forms of runup distributions (probability func-tion or cumulative distribufunc-tion), which can be obtained by the integration of probability density function Eq. (1).
The theoretical interpretation of the log-normal distribu-tion of tsunami runup heights is associated with the random topography of the sea bottom (Go, 1997; Choi et al., 2002; Burroughs and Tebbens, 2005; Kaistrenko, 2011). In the simplified ray theory based on the linear shallow-water the-ory, the runup height,H, is taken as proportional to a wave height in the tsunami source (open ocean),Ho:
H=KH0 (2)
whereK is the transformation factor that depends on sea-depth change along a propagation path and is determined by random seafloor topography only within these approxima-tions. Dividing the propagation path over a series of more or less statistically independent segments, the total transfor-mation coefficient is a product of the local coefficients of the
tsunami transformation on each segment. In this case, for-mula Eq. (2) can be rewritten in the logarithm form: logH=logH0+
X
i
logKi (3)
whereicharacterizes the number of random statistically inde-pendent segments along the propagation path andlog Ki can
be considered as independent random variables. The central limit theorem states that the sum of many random indepen-dent variables tends to the Gaussian process, and therefore the wave height is described by the log-normal distribution Eq. (1). It is important to note here that measured data in all points should be statistically independent, but this is difficult to check experimentally. The characteristic correlation scale between different measured values cannot be determined the-oretically; it should be done with an analysis of obtained data. As we show below, the distribution function can help determine this correlation scale.
Another important consideration is how we make the best comparison of distribution functions for different events. The correct scaling should be identified. Choi et al. (2002) sug-gested the use of a complementary cumulative distribution (probability) instead of probability density function (1)
F (H )=√ 1 2πln10σ
∞
Z
H
exp(−(logh−a) 2
2σ2 ) dh
h (4)
Eq. (4) can be written in universal non-parametric form:
F (ζ )=√ 1 2πln10
∞
Z
ζ
exp(−1 2(logθ )
2)dθ
θ (5)
whereζ=(H /H )¯ 1/σ,H¯=10a. In fact, the cumulative dis-tribution, or probability function Eq. (5) was used to analyze the distribution of runup heights in different countries dur-ing the 2004 tsunami in the Indian Ocean (Choi et al., 2006). The characteristics of this tsunami in Indonesia, Thailand, Malaysia, India, Sri Lanka were very different, but the cumu-lative distributions Eq. (5) written in dimensionless variables were very similar to one another (Choi et al., 2006).
Fig. 3. Cumulative distribution (probability) for tsunamis runup heights. The symbols are each tsunami events. The solid lines are log-normal curves.
heights for the eastern coast of Japan as a whole and the the-oretical curve Eq. (4). The distribution of the observed runup heights in 1896 and 1933 was described quite well by the theoretical function Eq. (4), but no such agreement was ob-served for the 2011 Tohoku-oki event. In our opinion, this can be explained by the large number of “dependent” mea-surement values (more than 5000) because the interval be-tween some points was 100 m or less.
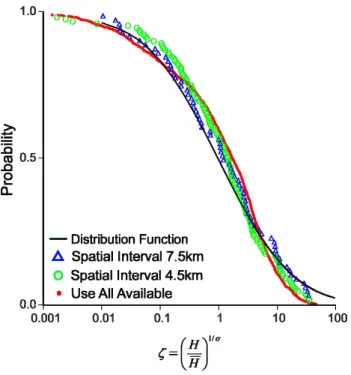
The influence of the spatial correlation scale of observa-tion data is demonstrated in Fig. 4 where the probability function is plotted with different scales of averaging of ob-served runup heights. The spatial scale of 7.5 km provides the best comparison of the theoretical curve with observa-tional data, and therefore this scale can determine the cor-relation length characterizing the independence of different locations of runup measurements.
3 Conclusions
We demonstrate that distribution functions of runup heights of three catastrophic tsunamis (1896, 1933, and 2011) are very well fitted by log-normal curves based on the assump-tion of statistical independence of measured wave heights. In the case of the 2011 event, the number of measurements is too high (more than 5000), and some of the runup values are not independent. If runup heights are averaged with a spatial scale of 7.5 km, the best correlation between theory and observations is obtained and this scale can therefore be considered the characteristic correlation scale.
Fig. 4.Cummulative distribution (probability) of the 2011 Tohoku-oki tsunami in dimensionless form. The dashed line corresponds to the log-normal curve. The circles and triangles represent spatial intervals of 4.5 km and 7.5 km, respectively. The dots indicate the individual observed values (over 2000).
Acknowledgements. EP thanks RFBR grant (11-05-00216). KKO
acknowledges the support by the project for the development of the marine environmental impact prediction system funded by KORDI. The useful comments by Eric Geist, Victor Kaistrenko and Stefano Tinti are acknowledged.
Edited by: S. Tinti
Reviewed by: E. Geist and V. Kaystrenko
References
Burroughs, S. M. and Tebbens, S. F.: Power-law scaling and prob-abilistic forecasting of tsunami runup heights, Pure Appl. Geo-phys., 162, 331–342, 2005.
Choi, B. H., Pelinovsky, E., Riabov, I., and Hong, S. J.: Distribution functions of tsunami wave heights, Nat. Hazards, 25, 1–21, 2002. Choi, B. H., Hong, S. J., and Pelinovsky, E.: Distribu-tion of runup heights of the December 26, 004 tsunami in the Indian Ocean, Geophys. Res. Lett., 33, 13, L13601, doi:10.1029/2006GL025867, 2006.
Fujii Y., Satake K., Sakai S., Shinohara M., and Kanazawa T.: Tsunami source of the 2011 off the Pacific coast of Tohoku Earth-quake, Earth Planets Space, 63, 7, 815–820, 2011.
Earthquake determined from tsunami arrival times at offshore observation stations, Earth Planets Space, 63, 809–813, 2011. Kaistrenko V. M.: Tsunami recurrence versus tsunami height
dis-tribution along the coast, Pure Appl. Geophys., 168, 11, 2065– 2069, 2011.
Kajiura, K.: Some statistics related to observed tsunami heights along the coast of Japan, Tsunamis – Their Science and Engi-neering, Terra Pub., Tokyo, 131–145, 1983.
Koketsu, K., Yokota, Y., Nishimura, N., Yagi, Y., Miyazaki, S., Sa-take, K., Fujii, Y., Miyake, H., Sakai, S., Yamanaka, Y., and Okada, T.: A unified source model for the 2011 Tohoku earth-quake, Earth Planet. Sci. Lett., 310, 480–487, 2011
Ozaki, T.: Outline of the 2011 off the Pacific coast of Tohoku Earth-quake (Mw9.0): Tsunami warnings/advisories and observations, Earth Planets Space, 63, 827–830, 2011.
The 2011 Tohoku Earthquake Tsunami Joint Survey Group.: Na-tionwide Field Survey of the 2011 Off the Pacific Coast of To-hoku Earthquake Tsunami, Journal of Japan Society of Civil En-gineers, Series, 67, 1, 63–66, 2011.
Tsuji, T., Ito, Y., Kido, M., Osada, Y., Fujimoto, H., Ashi, J., Ki-noshita, M., and Matsuoka, T.: Potential tsunamigenic faults of the 2011 off the Pacific coast of Tohoku Earthquake, Earth Plan-ets Space, 63, 831–834, 2011.