Nat. Hazards Earth Syst. Sci., 11, 2335–2340, 2011 www.nat-hazards-earth-syst-sci.net/11/2335/2011/ doi:10.5194/nhess-11-2335-2011
© Author(s) 2011. CC Attribution 3.0 License.
Natural Hazards
and Earth
System Sciences
Time-clustering analysis of the 1978–2008 sub-crustal seismicity of
Vrancea region
L. Telesca1, V. Alcaz2, R. Burtiev2, and I. Sandu2
1Consiglio Nazionale delle Ricerche, Istituto di Metodologie per l’Analisi Ambientale, C. da S. Loja, 85050 Tito (PZ), Italy 2Moldavian Academy of Sciences, Institute of Geology and Seismology, Academiei str. 3, Chisinau, Moldova
Received: 16 May 2011 – Accepted: 16 June 2011 – Published: 26 August 2011
Abstract. The analysis of time-clustering behaviour of the sub-crustal seismicity (depth larger than 60 km) of the Vrancea region has been performed. The time span of the analyzed catalogue is from 1978 to 2008, and only the events with a magnitude ofMw≥3 have been considered. The anal-ysis, carried out on the full and aftershock-depleted cata-logues, was performed using the Allan Factor (AF) that al-lows the identificatiion and quantification of correlated tem-poral structures in temtem-poral point processes. Our results, whose significance was analysed by means of two meth-ods of generation of surrogate series, reveal the presence of time-clustering behaviour in the temporal distribution of seismicity data of the full catalogue. The analysis performed on the aftershock-depleted catalogue indicates that the time-clustering is associated mainly to the aftershocks gener-ated by the two largest events occurred on 30 August 1986 (Mw= 7.1) and 30 May 1990 (Mw= 6.9).
1 Introduction
Among the several aims to which seismological studies are devoted, the time dynamical characterization of seismic se-quences is one of the main goals. In fact, within the general context of seismic hazard analysis, the capability of reliably estimating the probability of future earthquake occurrences is based on the knowledge of the statistical distribution of event occurrence. Even if among the several statistical distri-butions used to model the time seismic occurrences, probably the first and most extensively used was the Poissonian dis-tribution (exponential decreasing function of the interevent
Correspondence to:L. Telesca ([email protected])
times) due to its effectiveness in fittting large events. Some characteristics of Poissonian processes (absence of mem-ory phenomena, independence and uncorrelation of all the events) do not feature most seismic sequences. In fact, Ka-gan and Jackson (1991) showed that earthquakes present cor-relation properties at both short and long time scales. This property, called time-clusterization, was widely observed in several seismic catalogues (Kagan and Jackson, 1991; Bodri, 1993; Telesca et al., 1999, 2000a, b).
The identification and quantification of time-clustering be-haviour in seismicity was revealed by means of time frac-tal methods, which allowed us to describe more deeply the temporal fluctuations of earthquakes. The discrimination be-tween Poissonian and clusterized seismic sequences was per-formed using several earthquake catalogues (Telesca et al., 2001a, b; Telesca and Lovallo, 2009). Space- and depth-variability of time-clustering behaviour was analysed in the seismic catalogues of Italy and Southern California (Telesca et al., 2001c, 2003). The dependence of time-clustering behaviour on the threshold magnitude was investigated in Telesca and Macchiato (2004) and Telesca et al. (2007).
2336 L. Telesca et al.: Time-clustering analysis of the 1978–2008 sub-crustal seismicity of Vrancea region
Fig. 1. Spatial distribution of the sub-crustal earthquakes of the
Vrancea zone for the period 1978–2008.
0.0 2.0x10⁸
4.0x10⁸
6.0x10⁸
8.0x10⁸
1.0x10⁹ 2.5
3.0 3.5 4.0 4.5 5.0 5.5 6.0 6.5 7.0 7.5
May, 30 1990 (Mw=6.9) August 30, 1986 (Mw=7.1)
MW
t (s)
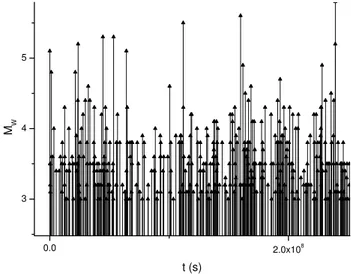
Fig. 2. Temporal distribution of the sub-crustal seismicity of
Vrancea for the period 1978–2008. The two arrows indicate the occurrence of the largest shocks.
In the present study, the time-clustering behavior of the 1978–2008 sub-crustal seismicity of the Vrancea area is per-formed. The paper is structured as follows: the section Study area describes the seismicity of the Vrancea area; the sec-tion Methods and Data analysis presents the Allan Factor method and the results obtained, analyzing the full and the aftershock-depleted catalogues of Vrancea; the section Con-clusions summarizes the main findings of the present study.
0.0 2.0x10⁸
3 4 5
MW
t (s)
Fig. 3.Enlargement of a portion of Fig. 2.
0.0 2.0x10⁸
4.0x10⁸
6.0x10⁸
8.0x10⁸
1.0x10⁹
0 500 1000 1500 2000
2500 whole catalogue
May, 30 1990 (Mw=6.9)
on August 30, 1986 (Mw=7.1)
N(t
)
t (s)
Fig. 4. Cumulative number of earthquakes versus time of
occur-rence for the full catalogue.
2 Study area
L. Telesca et al.: Time-clustering analysis of the 1978–2008 sub-crustal seismicity of Vrancea region 2337
0 1 2 3 4 5 6 7 8 9
-0.2 0.0 0.2 0.4 0.6 0.8 1.0 1.2 1.4 1.6
whole catalogue
α=0.30+0.01
lo
g10
(AF
(
τ
))
log10(τ) (s)
τ
τ
Fig. 5.Allan Factor curve for the full catalogue.
a continental subduction (Bala, 2000; Popa, 2007; Enescu, 2001), by means of two general models: (i) a classic Be-nioff zone, and (ii) a weak slab.
Studies of global seismicity have indicated that the rate of the seismic activity of the Carpathian Arc comprises 1/1500 of the global one (in term of energy) and seismic power approximately 2.5±0.1×10¹⁴J yr (Sandu, 2009) or 3.5×10¹⁴J yr (Radu and Polonic, 1982). Approximately 93 % of the released energy in the Carpathian region is due to the Vrancea area, where 95 % of the seismicity is of the sub-crustal type (h≥60 km).
The spatial distribution of the sub-crustal seismic epi-centers is highly concentrated (Fig. 1), with 89 % of the Vrancea events located within 1◦×1◦ square (Radu and Polonic, 1982) and depth ranging between 60 and 170 km (Riznichenko et al., 1976), with maximum depth around 200 km (Oncescu, 1999). The depth distribution shows a maximum between 130 and 150 km (Radu and Polonic, 1982).
3 Methods and data analysis
We analysed the sub-crustal earthquake sequence occurring in the Vrancea area. We considered all the events that oc-curred between 1978 and 2008 with a depth ofh≥60 km and magnitude ofMw≥3.0. The threshold magnitude of 3.0 was suggested by Oncescu et al. (1999) as the completeness mag-nitude for the considered period. The temporal distribution of the analysed seismicity is shown in Fig. 2; in particular two large events that occurred during the observation period, on 30 August 1986 (Mw= 7.1) and 30 May 1990 (Mw= 6.9). Looking at a portion of the series (Fig. 3), the sequence ap-pears clusterized in time because the events are not homoge-neously distributed on time.
α
τ
τ
0 1 2 3 4 5 6 7 8 9
-0.2 0.0 0.2 0.4 0.6 0.8 1.0 1.2 1.4 1.6
lo
g10
(AF
(
τ
))
log
10(τ) (s)
whole catalogue original 95% Poisson
Fig. 6. Comparison between the AF curve for the full catalogue
(black line) and the 95 % confidence curve (red line) obtained by means of generation of 1000 Poissonian sequences.
0 1 2 3 4 5 6 7 8 9
-0.2 0.0 0.2 0.4 0.6 0.8 1.0 1.2 1.4 1.6
lo
g10
(AF
(
τ
))
log10(τ) (s) whole catalogue
original 95% Shuffled
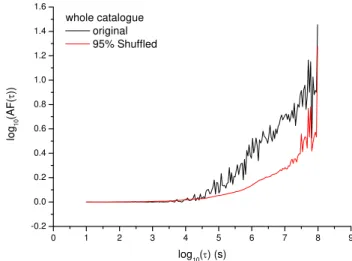
Fig. 7. Comparison between the AF curve for the full catalogue
(black line) and the 95 % confidence curve (red line) obtained by means of generation of 1000 randomly shuffled sequences.
The typical cumulative number of eventsN (t )versus time
tis shown in Fig. 4; the local rate (local slope) is not constant, contrary to a Poisson process; in fact, clearly visible are the two jump-like features associated with the two largest events (indicated by the arrows), superimposed to nonlinear trend.
The Allan Factor (AF) is applied to detect correlations in the sequence of the earthquake counts. Dividing the time axis into equally spaced contiguous windows of du-ration τ, and denoting with Nk (τ ) the number of events
falling into thek-th window, the Allan Factor is defined as AF(τ )=<(Nk+1(τ )−Nk(τ ))2>
2<Nk(τ )> , where<..>indicates
2338 L. Telesca et al.: Time-clustering analysis of the 1978–2008 sub-crustal seismicity of Vrancea region
τ
τ
0.0 2.0x10⁸
4.0x10⁸
6.0x10⁸
8.0x10⁸
1.0x10⁹
0 500 1000 1500 2000 2500
N(t)
t(s) depleted catalogue
Fig. 8. Cumulative number of earthquakes versus time of
occur-rence for the aftershock-depleted catalogue.
0 1 2 3 4 5 6 7 8 9
-0.2 0.0 0.2 0.4 0.6 0.8 1.0 1.2 1.4 1.6
107.3 s
lo
g10
(A
F(
τ
))
log
10(τ) (s)
whole catalogue depleted catalogue
τ
τ
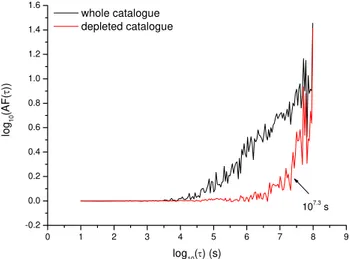
Fig. 9. Comparison between the AF curves for the full and the
aftershock-depleted catalogues.
AF(τ )∝τα(Thurner et al., 1997), and the fractal exponentα
can be estimated by the slope of the line that fits the curve in its linear range; for a hypothetical Poissonian earthquake se-quence, the AF is approximately near unity for all timescales
τ, withα≈0.
Figure 5 shows the AF of the seismic sequence recorded in the investigated area for timescalesτfrom 10 s to about 3 yr; the upper timescale corresponds approximately to the 1/10 of the entire period; higher timescales would lead to mis-leading results for the poorer statistics. The AF plot suggests the presence of time-clustering behavior, because it increases with linear form forτ >105s in bilogarithmic scales. The estimate of the scaling exponent in such a timescale range is∼0.3. The cutoff timescale 105s is the so-called fractal onset time (Thurner et al., 1997) and indicates the lower timescale from which clustering behavior can be detected
τ
τ
0 1 2 3 4 5 6 7 8 9
-0.2 0.0 0.2 0.4 0.6 0.8 1.0 1.2 1.4 1.6
lo
g10
(AF
(
τ
))
log10(τ) (s) depleted catalogue
original 95% Poisson
Fig. 10. Comparison between the AF curve for the
aftershock-depleted catalogue (black line) and the 95 % confidence curve (red line) obtained by means of generation of 1000 Poissonian se-quences.
0 1 2 3 4 5 6 7 8 9
-0.2 0.0 0.2 0.4 0.6 0.8 1.0 1.2 1.4 1.6
lo
g10
(AF
(
τ
))
log
10(τ) (s)
depleted catalogue original 95% Shuffled
Fig. 11. Comparison between the AF curve for the
aftershock-depleted catalogue (black line) and the 95 % confidence curve (red line) obtained by means of generation of 1000 randomly shuffled sequences.
and quantified. The early flatness of up to about 104s indi-cates a Poissonian-like behavior of the sequence for the small timescales. The intermediate timescale region between 104s and 105s can be considered as a “transfer” timescale region between the two opposite behaviors, from Poissonian to clus-terized dynamics.
L. Telesca et al.: Time-clustering analysis of the 1978–2008 sub-crustal seismicity of Vrancea region 2339 timescale was calculated. The final 95 % confidence AF
curve was then given by the set of the 95th percentiles. The AF curve is significantly different from those obtained by the Poisson surrogates forτ >104s, therefore, the scaling be-havior of the seismic cluster is significantly non Poissonian (Fig. 6).
In order to check whether the scaling behavior of the se-quence is due to the shape of the probability density function of the interevent times or to the their orderings, we shuffled the interevent intervals 1000 times, and for each shuffle we calculated the AF curve. The 95 % confidence AF curve for the shuffles was calculated as above (Fig. 7). This curve is lower than the AF curve of the original sequence, and this indicates that the scaling behavior is due to the specific or-dering of the interevent intervals.
In order to check whether the time-clustering behavior of the sequence depends on the aftershock activation that fol-lowed the two largest events that occurred during the obser-vation period producing a sharp increase of seismic activ-ity (Fig. 4), we analysed the aftershock-depleted catalogue. A possible method to eliminate the aftershocks is to use a space-time rectangular or circular window, dependent on the magnitude of the mainshock (Gardner and Knopoff, 1976). This method has been improved by means of a dynamic af-tershock clustering algorithm, which considers the peculiar-ity of each main shock concerning the extent of the after-shocks in space and time (Reasenberg, 1985). The method of Reasenberg is based on a physical basis, which consid-ers each earthquake capable of generating an alteration of the surrounding stress field that may trigger a further seis-mic event, which nucleates in its surroundings a modified stress field. The areal and time extent for which the event can trigger a following event is called interaction zone of the earthquake, whose length scale is proportional to the source dimension, and the temporal scale is determined with a prob-abilistic model based on Omori’s law. Thus, we applied the Reasenberg’s algorithm to remove aftershocks from the in-vestigated catalogue. Figure 8 shows the cumulative number of the earthquakes vs. the occurrence time for the depleted catalogue, which does not present sharp jump-like increases of the seismic activity (Fig. 8). We applied the AF method to this aftershock-depleted catalogue and the results com-pared with those obtained for the whole catalogue (Fig. 9). It is clearly visible that the whole catalogue presents a clus-tering behaviour stronger than that revealed by the depleted catalogue, whose AF curve is approximately flat for almost all the timescales up to about 107.3s, which can be con-sidered as the fractal onset time for the depleted sequence. We checked the significance of our results applying the two methods of generation of surrogate series (Poissonian and shuffled), as we did for the whole catalogue. The 95 % con-fidence AF curves over 1000 Poissonian (Fig. 10) and shuf-fled (Fig. 11) surrogate series is almost overlapping with the AF curve of the original depleted catalogue. This indicates that the depleted catalogue is quasi-Poissonian and that its
scaling behaviour depends mainly on the shape of the proba-bility density function of the interevent times and not on their orderings.
4 Conclusions
The time-clustering behaviour of the 1978–2008 sub-crustal seismicity (depth larger than 60 km) of the Vrancea region was analysed by means of the Allan Factor method, which allows us to detect and quantify time-clustering in a tem-poral point processes. The full catalogue and that depleted by the aftershocks that followed the two largest earthquakes occurring on 30 August 1986 (Mw= 7.1) and 30 May 1990 (Mw= 6.9) revealed that significant time-clustering is mainly due to the aftershock activation than to the background seis-micity. The findings of the present study contribute towards better characterization of the time dynamics of the seismicity of Vrancea.
Acknowledgements. The present study was supported by the CNR/ASM 2011–2012 Project “Characterization of seismicity of Moldova Republic territory. Contribution to seismic hazard assessment”.
Edited by: M. E. Contadakis
Reviewed by: M. Lovallo and A. Kendzera
References
Bala, A.: Contributions to the knowledge of structure and dynamics of the lithosphere, Applications in some areas of Romania, PhD thesis, Bucharest, Institute of Atomic Physics – NIEP, 2000 (in Romanian).
Bodri, B.: A fractal model for seismicity at Izu-Tokai region, Cen-tral Japan, Fractals, 1(3), 539–546, 1993.
Dewey, J. F., Pitman III, W. C., Ryan, W. B. F., and Bonnin, J.: Plate Tectonics and the evolution of the Alpine system: Geological Society of America Bulletin, 84, 3137–3180, 1973.
Enescu, B. D.: Contributions to the knowledge Vrancea area seis-motectonics and the prediction of earthquakes in this area, using seismic data and other geophysical data. PhD thesis, Bucharest University, 2001 (in Romanian).
Gardner, J. K. and Knopoff, L.,: Statistical search for non-random features of the seismicity of strong earthquakes, Phys. Earth Planet. Int., 12, 291–318, 1976.
Kagan, Y. Y. and Jackson, D. D.: Long-term earthquake clustering, Geophys. J. Int., 104, 117–133, 1991.
Larson, R. L. and Pittman III, W. C.: The bedrock geology of the world, New York, W. H. Freeman and Co, 1985.
Oncescu, M. C., Marza, V. I., Rizescu, M., and Popa, M.: The Ro-manian earthquake catalogue between 984–1996, in: Vrancea Earthquakes: Tectonics, Hazard and Risk Mitigation, edited by: Wenzel, F., Lungu, D., and Novak, O., Kluwer Academic Pub-lisher, 43–48, 1999.
2340 L. Telesca et al.: Time-clustering analysis of the 1978–2008 sub-crustal seismicity of Vrancea region
Popa, M.: Contributions to the knowledge of the deep structure of the Vrancea area, Bucharest, Lucman, 191 pp., 2007 (in Roma-nian).
Radu, C. and Polonic, G.: Seismicity Romanian territory with spe-cial reference to the region of Vrancea, Romania earthquake in the March 4, 1977, RSR Academy Publishing House, Bucharest, 75–136, 1982 (in Romanian).
Rebai, S., Philip, H., and Tabouda, A.: Modern tectonic stress field in the Mediteranean region: Evidence for variation in stress di-rections at different scales, Geophys. J. Int., 110, 106–140, 1992. Riznichenko, I. V., Drumea, A. V., and Stepanenko, N. Y.,: Seismic-ity and shakeabilSeismic-ity of Carpatho-Balkan region, Chisinau, Shti-intsa, 117 pp., 1976 (in Russian).
Sandu, I.: Regional seismicity (Vrancea) in the Global seismicity Context. Bulletin of the Institute of Geology and Seismology of the ASM, Chisinau, Elena, 2, 5–12, 2009, (in Romanian). Sandulescu, M.: Geotectonics of Romania, Technical Publishing
House, Bucharest, 335 pp., 1984 (in Romanian).
Spencer, E. W.: Introduction to the structure of the Earth, 3rd Edn., ISBN 0070601984, NY, USA, 431–468, 1988.
Telesca, L. and Lovallo, M.: Non-uniform scaling features in cen-tral Italy seismicity: a non-linear approach in investigating seis-mic patterns and detection of possible earthquake precursors, Geophys. Res. Lett., 36, L01308, doi:10.1029/2008GL036247, 2009.
Telesca, L. and Macchiato, M.: Time-scaling properties of the Umbria-Marche 1997–1998 seismic crisis, investigated by the Detrended Fluctuation Analysis, Chaos Solitons and Fractals, 19, 377–385, 2004.
Telesca, L., Cuomo, V., Lanfredi, M., Lapenna, V., and Macchi-ato, M.: Investigating Clustering Structures in Time-Occurrence Sequences of Seismic Events Observed in the Irpinia- Basilicata Region (Southern Italy), Fractals, 7(3), 221–234, 1999. Telesca, L., Cuomo, V., Lapenna, V., and Vallianatos, F.:
Self-similarity properties of seismicity in the Southern Aegean area, Tectonophysics, 321, 179–188, 2000a.
Telesca, L., Cuomo, V., Lapenna, V, and Macchiato, M.: Analysis of the time-scaling behaviour in the sequence of the aftershocks of the Bovec (Slovenia) April 12, 1998 earthquake, Phys. Earth Planet. Int., 120, 315–326, 2000b.
Telesca, L., Cuomo, V., Lapenna, V., and Macchiato, M.: Statis-tical analysis of fractal properties of point processes modelling seismic sequences, Phys. Earth Planet. Int., 125, 65–83, 2001a. Telesca, L., Cuomo, V., Lapenna, V., and Macchiato, M.:
Intermittent-type temporal fluctuations in seismicity of the Ir-pinia (southern Italy) region, Geophys. Res. Lett., 28, 3765– 3768, 2001b.
Telesca, L., Cuomo, V., Lapenna, V., and Macchiato, M.: Depth-dependent time-clustering behavior in seismicity of southern California, Geophys. Res. Lett., 28, 4323–4326, 2001c. Telesca, L., Lapenna, V., and Macchiato, M.: Spatial variability of
time-correlated behaviour in Italian seismicity, Earth Planet. Sci. Lett., 212, 279–290, 2003.
Telesca, L., Lovallo, M., Lapenna, V., and Macchiato, M.: Long-range correlations in 2-dimensional spatio-temporal seismic fluc-tuations, Physica A, 377, 279–284, 2007.