www.ann-geophys.net/26/2303/2008/ © European Geosciences Union 2008
Annales
Geophysicae
The EISCAT meteor code
G. Wannberg1, A. Westman2, J. Kero1, C. Szasz1, and A. Pellinen-Wannberg3 1Swedish Institute of Space Physics, P.O. Box 812, 981 28 Kiruna, Sweden 2EISCAT Scientific Association, P.O. Box 812, 981 28 Kiruna, Sweden
3Ume˚a University and Swedish Institute of Space Physics, P.O. Box 812, 981 28 Kiruna, Sweden
Received: 20 December 2007 – Revised: 13 May 2008 – Accepted: 10 June 2008 – Published: 5 August 2008
Abstract. The EISCAT UHF system has the unique capa-bility to determine meteor vector velocities from the head echo Doppler shifts measured at the three sites. Since even meteors spending a very short time in the common volume produce analysable events, the technique lends itself ideally to mapping the orbits of meteors arriving from arbitrary di-rections over most of the upper hemisphere.
A radar mode optimised for this application was devel-oped in 2001/2002. A specially selected low-sidelobe 32-bit pseudo-random binary sequence is used to binary phase shift key (BPSK) the transmitted carrier. The baud-length is 2.4µs and the receiver bandwidth is 1.6 MHz to accom-modate both the resulting modulation bandwidth and the tar-get Doppler shift. Sampling is at 0.6µs, corresponding to 90-m range resolution. Target range and Doppler velocity are extracted from the raw data in a multi-step matched-filter procedure. For strong (SNR>5) events the Doppler velocity standard deviation is 100–150 m/s. The effective range res-olution is about 30 m, allowing very accurate time-of-flight velocity estimates. On average, Doppler and time-of-flight (TOF) velocities agree to within about one part in 103. Two or more targets simultaneously present in the beam can be resolved down to a range separation<300 m as long as their Doppler shifts differ by more than a few km/s.
Keywords. Electromagnetics (Plasmas; Signal processing and adaptive antennas) – Ionosphere (Instruments and tech-niques)
1 The first ten years of EISCAT meteor observations
Meteor head echoes were first detected at EISCAT during the Geminid meteor shower in December 1990, when transient, multiply-peaked radar echoes from altitudes around 100 km
Correspondence to:G. Wannberg
were seen in power profile data from a high-resolution UHF experiment using a (13×3µs) Barker coded binary phase-shift keying (BPSK) for pulse compression and very wide post-detection filter bandwidths. Nobody at EISCAT had seen anything like these echoes before, and experienced users suggested that they were artefacts caused by an equip-ment malfunction. However, when it was demonstrated by computer simulations that the observed echo shapes could be replicated by passing strongly Doppler-shifted signals through a matched filter set for zero Doppler, the events were accepted as genuine and echoes off meteor heads suggested as the most plausible explanation (Pellinen-Wannberg and Wannberg, 1994).
A comprehensive analysis of the EISCAT receiver system and its response to Doppler shifted Barker-coded echoes was now performed and a time-slicing correlator code and tech-niques for inverting the observed power domain ambiguity functions into target velocities were developed by Wannberg et al. (1996). From 1993 to 1999, a radar mode based on this work but employing a (13×2µs) Barker coded pulse was used to accumulate a database that eventually yielded the first tristatic high-power large aperture (HPLA) radar meteor vec-tor velocities and ephemerides (Janches et al., 2002a, b).
Table 1. Geometry of the EISCAT UHF 2002 meteor velocity mode. The common observation volume is located at (68.876 N, 21.880 E) at 96.0 km altitude.
Site Distance to Elevation Scattering kvector
common angle angle angle relative
volume tokT
(km) (degrees) (degrees) (degrees)
Tromsø 163.6 35.3 180.0 0.0
Kiruna 160.4 36.0 104.4 37.8
Sodankyl¨a 278.5 18.9 57.8 61.1
signal processing and raw data recording systems in 2001 that phase-coherent pulse-by-pulse analysis could finally be applied. At that point, the development of an optimised radar mode, making full use of the capabilities of the new hard-ware, was started.
2 The new post-2001 meteor mode
2.1 Pointing geometry
In the UHF frequency range, scattering of EM waves off a compact ball of plasma, e.g. the plasma cloud accompanying a meteoroid interacting with the atmosphere, is essentially elastic. When such a target scatters an incident wave with frequencyf0and wave vectork0into a secondary wave with frequencyf1and wave vectork1, it contributes a wave vector
k=(k1−k0) (1)
in order for momentum to be conserved. If the target is mov-ing with velocityv, the scattered wave is Doppler-shifted by
an amountfD proportional to the component ofv alongk, such that to first order
v·k=fD/|k| (2)
When the EISCAT UHF system is used for tristatic meteor head echo observations, the Doppler shift of the scattered sig-nal received at Tromsø is therefore proportiosig-nal to the com-ponent of target velocity along the Tromsø antenna line-of-sight (i.e. the classical monostatic backscatter case), while the Doppler shifts simultaneously observed at Kiruna and Sodankyl¨a are proportional to the velocity components di-rected along the bisectors of the Kiruna and Tromsø-Sodankyl¨a scattering angles, respectively. Similarly, changes in target range observed at the three sites reflect the compo-nents of target motion along the respective scattering vectors and can be used to estimate the three velocity components by the time-of-flight method. As the scattering geometry is defined by the radar system configuration and the antenna pointing, and therefore known, it is then straightforward to
construct the full target vector velocity at the scattering loca-tion.
Unfortunately, the UHF system geometry is far from ideal for high-precision vector velocity measurements when the system is used in the “conventional” manner, i.e. with the Tromsø beam directed either tangential to the magnetic field or vertically (the latter being almost mandatory for experi-ments attempting to observe plasma processes in the D and E regions). Since the Sodankyl¨a station is located more or less southeast of Tromsø, and the Kiruna station due south, the velocity components derived in Kiruna and in Sodankyl¨a in this configuration end up being strongly linearly dependent (Janches et al., 2002a).
However, since the primary application foreseen for the new experiment – a meteor sky survey – does not demand background ionospheric data, it was decided to select a point-ing geometry minimispoint-ing the linear dependence of the mea-sured velocity components. By fixing the beam intersection point at (68.876◦N, 21.880◦E, altitude 96.0 km), almost in the Tromsø – Sodankyl¨a plane and chosen such that the dis-tances to the Tromsø and Kiruna receivers are close to equal, the three scatteringk-vectors are spread nearly as far apart as
possible within the restrictions set by the system geometry. At the same time, the size of the common volume (and thus indirectly the event rate) is increased by almost a factor of two relative to the earlier, vertical-above-Tromsø geometry. The Sodankyl¨a beam elevation is increased to 18.9 degrees, so essentially eliminating ground noise pickup.
Details of the meteor mode geometry can be found in Ta-ble 1. With minor modifications, this geometry has been used for all UHF meteor observations after 2001, see reported re-sults in Kero et al. (2008a, b, c), Szasz et al. (2007) and Szasz et al. (2008).
2.2 The radar code
One of the most serious shortcomings of the power-domain meteor radar code was its inability to provide unambiguous velocity estimates all the way up to the maximum apparent solar system escape velocity, 72 km s−1– the Barker power-domain response wraps around at about 36 km s−1and so ad-ditional assumptions had to be invoked whenever it was un-clear if a particular event was below or above the wraparound velocity (Wannberg et al., 1996). To rectify this and at the same time make sure that the new experiment would be able to resolve even the fastest (possibly interstellar) meteors, it would have to be designed to provide unambiguous Doppler velocity estimates up to and exceeding 100 km s−1, paired with a line-of-sight velocity resolution better than 150 m s−1 over the whole velocity range.
repetition rate as high as possible to permit reliable com-parative time-of-flight velocity measurements to be made (Pellinen-Wannberg et al., 1998). But at the same time, this would need to be reconciled with the requirement that the ex-periment should deliver the best possible rate of statistics and maximum ionospheric clutter suppression, as well as with the additional restriction that the experiment should provide mono-static range coverage over at least 120 to 155 km to match the optimised 3-static UHF geometry described above. The above considerations were now translated into some basic design criteria:
– The receiver bandwidth should be at least 1.5 MHz to accommodate both the modulation bandwidth and the target Doppler shift,
– Accordingly, the complex-valued receiver output volt-age should be sampled at 1.5 Msamples s−1or faster, – The sampled data should be recorded on a
pulse-by-pulse basis to enable subsequent amplitude-domain pro-cessing,
– Frequency hopping on alternate pulses should be em-ployed to minimise ionospheric F region clutter, and – The pulse repetition rate should fall in the
(400. . . 800) Hz range, corresponding to a radar cycle length of (1.25. . . 2.5) ms.
At this point it became apparent that the restrictions on the radar cycle length, combined with the maximum allow-able RF duty cycle of the transmitter, 10%, would limit the longest permissible transmission to something in the order of 125µs. This meant that the desired 150 m s−1velocity res-olution could not be achieved on a single radar cycle basis, as this would require the target to be illuminated for a mil-lisecond or more, thus overlapping part or the entire desired reception time window. Instead, accurate velocity estimates would have to be derived from fitting a time-dependent poly-nomial (target range, velocity, deceleration) model to a se-ries of data observed on successive radar pulses, and it was decided to design and validate a data reduction scheme opti-mised to the radar waveform in parallel to the design of the actual experiment.
At the time, reliable observational data on the spatial and temporal development of the plasma behind a meteoroid was still scarce, mainly because the spatial resolution and dy-namic range of previous experiments had been much too poor to resolve the head echo and a possible simultaneous, much weaker return from the plasma tail. To improve on this situation, it was decided that the new meteor mode should employ a modulating waveform with a baud-length in the order of 2µs, the shortest pulse compatible with both the UHF and the VHF transmitter characteristics (the instanta-neous power bandwidth of the VHF klystrons is too narrow to replicate 1µs pulses, which are stretched and rounded
such that the effective output pulse length becomes more like 1.5µs). Its range ambiguities should be suppressed by more than−30 dBmax within ±1 km from the desired range re-sponse, and by at least−15 dBmax elsewhere. With such a code, it should be possible to resolve returns from slipping plasma separated from the head echo by as little as a single baud-length.
In the EISCAT transmitter system, the transmitted wave-form is generated by applying binary (0/π )phase modula-tion (also known as BPSK) to the carrier frequency. The waveform is therefore conveniently defined in terms of bi-nary (0,1) sequences of arbitrary length. In the present case, either a 64-bit sequence or two 32-bit sequences could be used to generate the maximum permissible RF pulse length, assuming a baud-length of 2µs.
Since the normalised side-lobe level of the autocorrela-tion of an n-bit pseudo-random sequence is something be-tweenn−1 andn−2 (Cook et al., 1975), there was a good chance that there existed a 32-bit sequence that would meet the−30 dBmax close-in range ambiguity requirement. Mak-ing use of the fact that mirror symmetry exists between a [0, xn] code and a [1,xn−1] code – their autocorrelation functions are identical – a Matlab algorithm was designed to find those binary sequences from 1 to 231meeting the condition [rxx(k, i)]2<10−3[rxx(k,0)]2, i=1. . .3 (3a) whererxx(k, i)is the autocorrelation of codekat an offset ofibauds from the origin. For eachk=κ representing a se-quence meeting Eq. (3a), the total sidelobe powerPS(κ)is computed and compared to the previous best value:
PS(κ)=26[rxx(κ, i)]2, i=1, . . ..,31, (3b) if
PS(κ)<infk=(1...κ−1){PS}then inf{PS}=PS(κ)andκopt=κ (3c) At any given point in the search,κoptthus represents the best code found so far.
Having tested only about 10% of all 32-digit permutations, the algorithm came up with the sequence
00000001010010101110001100100110 (4)
Fig. 1. Normalised logarithmic range ambiguity (autocorrelation) of the 32-bit sequence (4) defining the transmitted waveform, as-suming a 2.4µs baud-length. The central peak is surrounded by a region out to plus and minus three bit intervals (indicated by the arrows) where the response is down by more than−30 dB.
A schematic representation of the basic radar cycle de-signed on the basis of the above deliberations is given in Fig. 3. Two RF pulses are transmitted. The first of these is normally received at all three sites. Sequence (3) is BPSK modulated onto the transmitter carrier using a 2.4µs baud-length, for a total pulse length of 76.8µs. The transmission is frequency-hopped between two different carrier frequencies F5 and F9 (927.5 MHz and 928.7 MHz) on alternate pulses to place the first ambiguous range well above the F region peak at more than 600 km altitude, so minimising contamination of the mono-static data by incoherent returns from the iono-spheric F-region. To improve the utilisation of the available klystron beam power, the waveform is then repeated on F12 (929.6 MHz) for the benefit of the remote receivers. In this way, an RF duty cycle approaching 10% can be maintained.
Unfortunately, the radio-frequency interference situation at Sodankyl¨a sometimes forces the insertion of a 1.5 MHz wide (929.0–930.5) front-end filter into the signal path to protect the receiver from being overloaded by the strong car-riers from GSM mobile telephone base stations operating just above 935 MHz, thus effectively ruling out the possibility of receiving the F5/F9 transmissions there.
The scattered signals are received at all three UHF sites. The receiver−3 dB bandwidth is set to 1.6 MHz to accom-modate the combined effect of modulation bandwidth and target Doppler shift. The sampling interval is 0.6µs, corre-sponding to a sampling frequency of 1.6667 MHz and 90-m range resolution.
This radar mode has a unity-SNR RCS sensitivity of −78.5 dB m2at UHF and 100-km range, which represents a dramatic performance improvement of almost 20 dB relative
−10 −0.8 −0.6 −0.4 −0.2 0 0.2 0.4 0.6 0.8 1 100
200 300 400 500 600 700 800 900
Frequency MHz
Relative power
Power−frequency spectrum of meteor code
Fig. 2.Power frequency spectrum (PFS) of sequence (4) assuming
a 2.4µs baud-length.
to the pre-2001 power-domain code. It can also be used on the VHF system; its sensitivity is then−83.5 dB m2. The ba-sic experiment exists in several versions, which differ mainly in the length of the radar cycle. Except for in the very first runs, this is always chosen to be an integer multiple of the baud-length.
3 Data reduction
Fig. 3.Schematic representation of a basic monostatic radar cycle. Time is in units of microseconds. The transmission intended for reception at all sites alters between EISCAT frequencies F5 and F9, the transmission for the remote receivers occurs at F12. BG and CAL denote sampling intervals dedicated to background estimation and system calibration.
−2 −1.5 −1 −0.5 0 0.5 1 1.5 2 0
0.1 0.2 0.3 0.4 0.5 0.6 0.7 0.8 0.9 1
Frequency offset MHz
Relative power
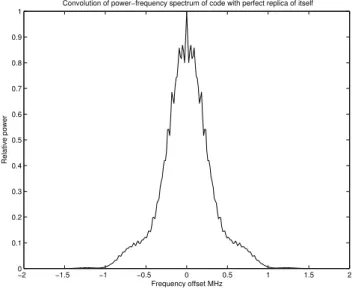
Convolution of power−frequency spectrum of code with perfect replica of itself
Fig. 4a. Convolution of the theoretical PFS of sequence (4) with
an infinite-SNR radar echo from a hard target (e.g. a meteor head echo).
causes this convolution to be multi-peaked, such that its max-imum cannot be used as a reliable estimate of Doppler shift (Fig. 4a and b). Instead, the frequency of its centre of gravity is taken as the first Doppler estimate.
Finally, the range and Doppler estimates are input to a time-domain fine-tuning procedure. A model of the received signal is constructed by generating a complex sinusoid at the estimated Doppler frequency and BPSK-modulating it by a range-shifted replica of the pseudo-random code. The raw data vector is cross-correlated with the model and the pulse compression ratio computed from the correlation function. A robust gradient-search routine then varies range and Doppler in small steps until the compression ratio maximises and their values at maximum are taken as the best estimates. When ap-plied to strong (SNR>5) events, the best compression ratio typically exceeds 80%. A detailed description how the fit-ting procedure is performed in practice is given in Kero et al. (2008c).
−2 −1.5 −1 −0.5 0 0.5 1 1.5 2 0
0.1 0.2 0.3 0.4 0.5 0.6 0.7 0.8 0.9 1
Frequency offset MHz
Relative power
Convolution of code power−frequency spectrum with noise−corrupted replica of itself (unity SNR)
Fig. 4b.Convolution of the theoretical PFS of sequence (4) with a
unity-SNR radar echo from a hard target (e.g. a meteor head echo). Note that even at this very high SNR the noise-induced variance of the signal can generate spurious peaks in the convolution; the data reduction routine therefore uses the centre of gravity of the convolution as the first estimate of the Doppler shift.
4 A case study – a dual target event observed with the VHF system
−80 −60 −40 −20 0 20 40 60 80 0.05
0.1 0.15 0.2 0.25 0.3 0.35 0.4 0.45
V
doppler (km/s)
Comp
Fig. 5.Pulse compression ratio as function of the Doppler velocity
for a dual target VHF event. Two unrelated targets, so close to each other in range that they are both almost fully illuminated, are well resolved in the Doppler domain. Each of the two Doppler peaks is compressed to about 41%, indicating that at this particular range, the two targets contribute about equally to the echo and therefore must have very similar radar cross sections.
0.05 0.1 0.15 0.2 0.25 0.3 0.35 0.4 0.45 0.5
Vdoppler (km/s)
First sample of decoded subset in data dump
Compression
−80 −60 −40 −20 0 20 40 60 80 50
100 150 200 250 300 350 400 450 500
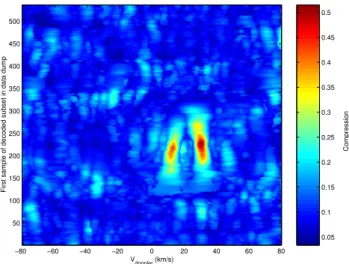
Fig. 6. A full range-Doppler decoding of the same sample vector
shows that the two targets are actually separated in range by about 670 m, i.e. slightly less than two code bits.
of the same sample vector (Fig. 6) shows that at this point in time the two targets are actually separated in range by about 670 m, i.e. slightly less than two code bits.
This was a quite extended event, lasting for nearly 0.12 s. Both targets could be uniquely resolved both in range and in Doppler in more than 50 radar cycles. As shown in Fig. 7, they are clearly not associated with one another as their ve-locities differ by a factor of more than two and their trajec-tories actually cross each other at about 0.05 s. Note that the
0 0.02 0.04 0.06 0.08 0.1 0.12 0.14 198
199 200 201 202
Time (s)
Range (km)
0 0.02 0.04 0.06 0.08 0.1 0.12 0.14 5
10 15 20 25 30 35
Time (s)
Vdoppler
(km/s)
Fig. 7. The snapshots presented in Figs. 5 and 6 are taken from
this extended event, which lasted for almost 0.12 s. Both targets are clearly distinguishable in more than 50 radar cycles. Linear least-squares fits of their positions and line-of-sight velocities clearly show that in this particular case the two targets are completely un-related, even though they appear at the same range at approx. 55 ms into the event. At that point it is still possible to resolve them down to a separation distance of about 200 m.
two targets can still be clearly resolved when less than 200 m apart, corresponding to about one-half of a baud-length!
5 Results and conclusions
−60 −40 −20 0 20 40 60 80 −60
−40 −20 0 20 40 60 80
Line−of−sight velocity (km/s)
Doppler velocity (km/s)
Tromsø Kiruna Sodankylä
Fig. 8. Doppler velocity vs. tiof-flight velocity for 410
me-teor events for which the two estimates differ by less than 5 km s−1. Linear LMS fits to the data sets from the three stations yield the fol-lowing:
Tromsø:vD=1.0001vTOF–0.0155 Kiruna:vD=0.9998vTOF–0.0180 Sodankyl¨a:vD=0.9987vTOF–0.0086.
meteoroids passing through one or more of the beams very rapidly can be determined reliably.
The EISCAT meteor mode as described, including radar code, observation geometry and data reduction procedure, is currently the de facto standard for all meteor work performed with the EISCAT mainland systems.
Acknowledgements. We gratefully acknowledge the assistance pro-vided by the EISCAT staff during the experiments. EISCAT is an in-ternational research association supported by research organisations in China (CRIPR), Finland (SA), Germany (DFG), Japan (NIPR and STEL), Norway (NFR), Sweden (VR) and the United Kingdom (STFC). Two of the authors (J. Kero and C. Szasz) are financed by the Swedish National Graduate School of Space Technology.
Topical Editor K. Kauristie thanks J. Vierinen and another anonymous referee for their help in evaluating this paper.
References
Cook, C. E., Bernfeld, M., and Palmieri, C. A.: Matched Filter-ing, Pulse Compression and Waveform Design, in: Radars, vol. 3, Pulse Compression, edited by: Barton, D. K., Raytheon, Bed-ford, Mass., 1975.
Janches, D., Pellinen-Wannberg, A., Wannberg, G., Westman, A., H¨aggstr¨om, I., and Meisel, D. D.: Tristatic observation of mete-ors using the 930 MHz EISCAT radar system, J. Geophys. Res., 107(A11), 1389, doi:10.1029/2001JA009205, 2002a.
Janches, D., Pellinen-Wannberg, A., Wannberg, G., Meisel, D. D., Westman, A., and H¨aggstr¨om, I.: The tristatic 930 MHz EISCAT radar system: a unique tool for meteor/dust studies, URSI GA Proceedings, 2002b.
Kero, J., Szasz, C., Pellinen-Wannberg, A., Wannberg, G., West-man, A., and Meisel, D. D.: Three-dimensional radar observa-tion of a submillimeter meteoroid fragmentaobserva-tion, Geophys. Res. Lett., 35, L04101, doi:10.1029/2007GL032733, 2008a. Kero, J., Szasz, C., Wannberg, G., Pellinen-Wannberg, A., and
Westman, A.: On the meteoric head echo radar cross sec-tion angular dependence, Geophys. Res. Lett., 35, L07101, doi:10.1029/2008GL033402, 2008b.
Kero, J., Szasz, C., Pellinen-Wannberg, A., Wannberg, G., West-man, A., and Meisel, D. D.: Determination of meteoroid phys-ical properties from tristatic radar observations, Ann. Geophys., 26, 2217–2228, 2008c,
http://www.ann-geophys.net/26/2217/2008/.
Pellinen-Wannberg, A. and Wannberg, G.: Meteor observations with the European incoherent scatter UHF radar, J. Geophys. Res., 99, 11 379–11 390, 1994.
Pellinen-Wannberg, A., Westman, A., Wannberg, G., and Kaila, K.: Meteor fluxes and visual magnitudes from EISCAT radar event rates: A comparison with cross section based magnitude esti-mates and optical data, Ann. Geophys., 16, 1475–1485, 1998, http://www.ann-geophys.net/16/1475/1998/.
Szasz, C., Kero, J., Meisel, D. D., Pellinen-Wannberg, A., Wannberg, G., and Westman, A.: Estimated visual magnitudes of the EISCAT UHF meteors, Earth, Moon, and Planets, 95, 101– 107, doi:10.1007/s11038-007-9206-y, 2007.
Szasz, C., Kero, J., Meisel, D. D., Pellinen-Wannberg, A., Wannberg, G., and Westman, A.: Orbit characteristics of the tristatic EISCAT UHF meteors, Monthly Notices of the Royal Astronomical Society, MN-08-0446-MJ.R1, 2008.