Rotor Faults Detection in Induction Motor by Wavelet Analysis
NEELAM MEHALA*, RATNA DAHIYA**
*Lecturer, Department of Electronics and Communication Engineering YMCA University of Science and Technology, Faridabad (Haryana)
e-mail address: [email protected]
Mobile no. 09958138139
**Associate Professor, Department of Electrical Engineering, National Institute of Technology, Kururkshetra (Haryana)
e-mail: [email protected]. ABSTRACT
Motor current signature analysis has been successfully used for fault diagnosis in induction motors. However, this method does not always achieve good results when the speed or the load torque is not constant, because this cause variation on the motor slip and fast Fourier transform problems appear due to non-stationary signal. This paper experimentally describes the effects of rotor broken bar fault in the stator current of induction motor operating under non-constant load conditions. To achieve this, broken rotor bar fault is replicated in a laboratory and its effect on the motor current has been studied. To diagnose the broken rotor bar fault, a new approach based on wavelet transform is applied by using ‘Labview 8.2 software’ of National Instrument (NI). The diagnosis procedure was performed by using the virtual instruments. The theoretical basis of proposed method is proved by laboratory tests.
Keywords: Fault diagnosis, broken rotor bar fault, Wavelet Transform, Multi-resolution analysis
1. Introduction
In recent years, marked improvement has been achieved in the design and manufacture of stator windings [1]. Motors driven by solid-state inverters undergo severe voltage stresses due to rapid switch-on and switch-off of semiconductor switches. Also, induction motors are required to operate in highly corrosive and dusty environments. Requirements such as these have required the development of vastly improved insulation material and treatment processes. However, cage rotor design and manufacturing have undergone little change. As a result, rotor failures now account for a large percentage of total induction motor failures [1], [2]. Cage rotors are basically of two types: cast and fabricated. Previously, cast rotors were only used in small machines. However, with the advent of cast ducted rotors, casting technology can be used even for rotors of machines in the range of 3000 kW. Fabricated rotors are generally found in larger or special-application machines. Cast rotors, although more rugged than the fabricated type, can almost never be repaired once faults like cracked or broken rotor bars develop in them. The reasons for rotor bar and end-ring breakage are many. They can be caused by thermal stresses due to thermal overload and unbalance, hot spots or excessive losses, sparking (mainly fabricated rotors), magnetic stresses caused by electromagnetic forces, unbalanced magnetic pull, electromagnetic noise and vibration, residual stresses due to manufacturing problems, dynamic stresses arising from shaft torques, centrifugal forces and cyclic stresses, environmental stresses caused, for example, by contamination and abrasion of rotor material due to chemicals or moisture, mechanical stresses due to loose laminations, fatigued parts, bearing failure, etc.
resulting from the DWT analysis. This allows a good interpretation of the phenomenon because the variation of these signals reflects clearly the evolution of the harmonics associated with broken rotor bars during the transient. Wavelet theory has proved to be a powerful tool for the analysis of transient processes [13]–[15]. DWT decomposes the current into a set of signals. Each one of these signals contains the information of the original signal within a certain frequency band. When a broken bar is present in the machine, a characteristic harmonic with a particular frequency variation appears during the startup process. The evolution of this harmonic is reflected clearly in the low-frequency wavelet signals resulting from the analysis, a fact that allows the detection of this kind of fault in the machine because this particular variation does not appear in the same machine operating under healthy conditions.
An important advantage of this method is that it gives a correct diagnosis in some cases in which the FFT does not provide so accurate results, such as the case of voltage fluctuations or oscillating torque loads. In these situations, the steady-state analysis is difficult because some frequency values close to those used for broken bar detection appear in the healthy machine, a fact that can lead to confusion or wrong diagnosis.
In this paper, the method for diagnosis of broken rotor bar is described and applied to industrial induction motor. The experiment has been conducted for broken bar fault of induction motor under non-constant load conditions. For testing purpose, the bar breakage are forced in the laboratory to compare machine behavior in healthy and faulty condition.
2. Wavelet Transform for Multiresolution Analysis
Wavelets are functions that can be used to decompose signals, similar to how to use complex sinusoids in the Fourier transform to decompose signals. The wavelet transform computes the inner products of the analyzed signal and a family of wavelets. In contrast with sinusoids, wavelets are localized in both the time and frequency domains, so wavelet signal processing is suitable for those signals, whose spectral content changes over time. The adaptive time-frequency resolution of wavelet signal processing enables us to perform multiresolution analysis. The properties of wavelets and the flexibility to select wavelets make wavelet signal processing a beneficial tool for feature extraction applications [16, 19].
Just as the Fourier transform decomposes a signal into a family of complex sinusoids, the wavelet transform decomposes a signal into a family of wavelets. Unlike sinusoids, which are symmetric, smooth, and regular, wavelets can be symmetric or asymmetric, sharp or smooth, regular or irregular. The family of wavelets contains the dilated and translated versions of a prototype function. Traditionally, the prototype function is called a mother wavelet. The scale and shift of wavelets determine how the mother wavelet dilates and translates along the time or space axis. For different types of signals, different types of wavelets can be selected that best match the features of the signal we want to analyze. Therefore, reliable results can be generated by using wavelet signal processing.
Wavelet signal processing is different from other signal processing methods because of the unique properties of wavelets. For example, wavelets are irregular in shape and finite in length. Wavelet signal processing can represent signals sparsely, capture the transient features of signals, and enable signal analysis at multiple resolutions. Wavelets are localized in both the time and frequency domains because wavelets have limited time duration and frequency bandwidth. The wavelet transform can represent a signal with a few coefficients because of the localization property of wavelets.
Figure 1: Two channel perfect Reconstruct filter banks [112]
The signal X[z] first is filtered by a filter bank consisting of G0(z) and G1(z). The outputs of G0(z) and G1(z) then
are down sampled by a factor of 2. After some processing, the modified signals are upsampled by a factor of 2 and filtered by another filter bank consisting of H0(z) and H1(z).
Figure 2: Discrete Wavelet Transform [21]
If no processing takes place between the two filter banks, the sum of outputs of H0 (z) and H1(z) is
identical to the original signal X(z), except for the time delay. This system is a two-channel PR filter bank, where G0 (z) and G1(z) form an analysis filter bank, and H0(z) and H1(z) form a synthesis filter bank.
Traditionally, G0(z) and H0(z) are low pass filters, and G1(z) and H1(z) are highpass filters. The subscripts 0 and
1 represent low pass and high pass filters, respectively. The operation ↓2 denotes a decimation of the signal by a factor of two. Applying decimation factors to the signal ensures that the number of output samples of the two low pass filters equal the number of original input samples X(z). Therefore, no redundant information is added during the decomposition. We can use the two-channel PR filter bank system and consecutively decompose the outputs of low pass filters, as shown in Figure 1.
Signal
1
( )
G z
0
( )
G z
0
( )
G z
1
( )
G z
0
( )
G z
2
↓
2
↓
2
↓
2
↓
2
↓
1
( )
G z
2
↓
1A
1D
2D
2A
A
L−1L
D
L
A
1( )
G Z
1
( )
G Z
2
↓
2
↓
Processing
2
↑
2
↑
1
( )
H Z
0
( )
H Z
+
Re
constructed
signal
Low pass filters remove high-frequency fluctuations from the signal and preserve slow trends. The outputs of low pass filters provide an approximation of the signal. High pass filters remove the slow trends from the signal and preserve high-frequency fluctuations. The outputs of high pass filters provide detail information about the signal. The outputs of low pass filters and high pass filters define the approximation coefficients and detail coefficients, respectively. Symbols A and D in Figure 2 represent the approximation and detail information, respectively.
Detail coefficients can be called wavelet coefficients because detail coefficients approximate the inner products of the signal and wavelets. This manual alternately uses the terms wavelet coefficients and detail coefficients, depending on the context. The Wavelet Analysis Tools use the subscripts 0 and 1 to describe the decomposition path, where 0 indicates low pass filtering and 1 indicates high pass filtering. For example, D2 in Figure 2 denotes the output of two cascaded filtering operations—low pass filtering followed by high pass filtering. Therefore, you can describe this decomposition path with the sequence 01. Similarly, DL denotes the output of the filtering operations 000...1 in which the total number of 0 is L–1. The impulse response of 000...1 converges asymptotically to the mother wavelet and the impulse response of 000...0 converges to the scaling function in the wavelet transform [16,17,18].
Signals usually contain both low-frequency components and high-frequency components. Low-frequency components vary slowly with time and require fine Low-frequency resolution but coarse time resolution. High frequency components vary quickly with time and require fine time resolution but coarse frequency resolution. Multiresolution analysis (MRA) method is used to analyze a signal that contains both low and high frequency components.
The DWT is well-suited for multiresolution analysis. The DWT decomposes high-frequency components of a signal with fine time resolution but coarse frequency resolution and decomposes low-frequency components with fine frequency resolution but coarse time resolution. DWT-based multiresolution analysis helps us better understand a signal and is useful in feature extraction applications, such as fault detection, peak detection and edge detection. Multiresolution analysis also can help in removing unwanted components in the signal, such as noise and trend [16,17].
Fourier analysis uses the basic functions sin(t), cos(t), and exp(t). In the frequency domain, these functions are perfectly localized, but they are not localized in the time domain, resulting in a difficult to analyze or synthesize complex signals presenting fast local variations such as transients or abrupt changes. To overcome the difficulties involved, it is possible to "window" the signal using a regular function, which is zero or nearly zero outside a time segment [-m, m]. The results in the windowed-Fourier transform [19,20,21]:
( , )
( ) (
)
iwus
G w t
=
∫
s u g t
−
u e
−du
……. (1)
Shifting and scaling a different window function, called in this case mother wavelet, it is obtained the so called Wavelet Transform.
1
( , )
s
t
u
G w t
s
du
a
a
ϕ
−
⎛
⎞ ⎛
⎞
=
⎜
⎟ ⎝
⎜
⎟
⎠
⎝
⎠
∫
…… (2)
where a is the scale factor, u is the shift,
ϕ
( )
t
is the mother wavelet andG w t
s( , )
is the wavelet transform of function s(t).The discrete version of Wavelet Transform, DWT, consists in sampling not the signal or not the transform but sampling the scaling and shifted parameters. This result in high frequency resolution at low frequencies and high time resolution at high frequencies, removing the redundant information .
A discrete signal x[n] could be decomposed:
[ ]
[ ]
1[ ]
, , , ,
j
jo k jo k j k j k
k j jo k
x n
a
φ
n
d
ϕ
n
−
=
=
∑
+
∑ ∑
…… (3)[ ]
[ ]
0 2,
2
(2
)
j
jo
jo k
n
n k
φ
=
φ
−
: scaling function at scales
=
2
jo shifted by k.( )
n
ϕ
: mother wavelet[ ]
2,
2
(2
)
j j
j k
n
n k
ϕ
=
ϕ
−
: scaling function at scales
=
2
j shifted by k., :
jo k
a
: Coefficients of approximation at scales
=
2
jo ,:
j k
d
Coefficients of detail at scales
=
2
jN= 2j: being N the number of samples of x[n]
In order words, a discrete signal could be constructed by means of a sum of a
j
−
jo
details plus a one approximation of a signal at scales
=
2
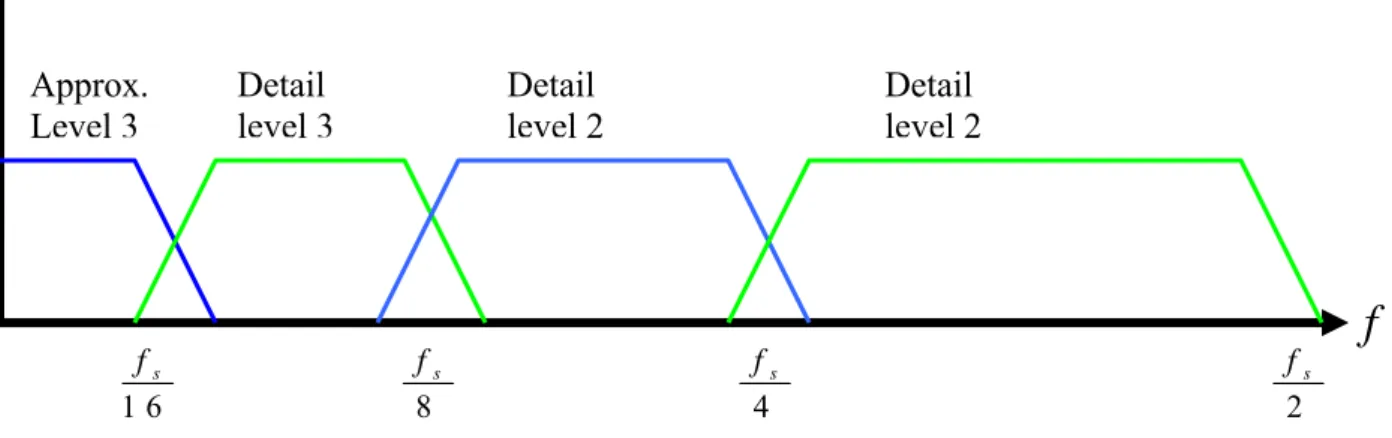
joThe details and the approximations at different scales could be obtained by means of a tree decomposition showed in Fig. 3.
Figure 3: Frequency range cover for details and final approximation
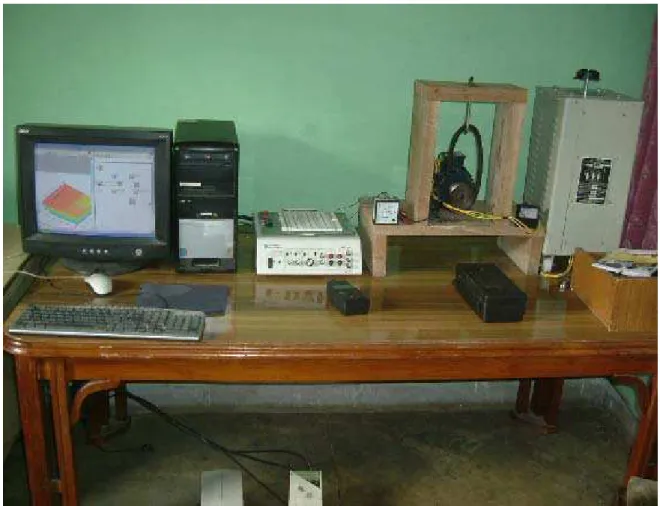
3. Experimental set up
In order to make several measurements with healthy and faulty squirrel-cage induction motors a modern laboratory test bench was set up. It consists of an electrical machine coupled with rope brake dynamometer. The speed of the motor is measured by digital tachometer. The Virtual Instrument (VIs) was built up with programming in LabVIEW 8.2. This VIs was used both for controlling the test measurements and data acquisition, and for the data processing. A data acquisition card and acquisition board ELVIS are used to acquire the current samples from the motor under load. In order to test the system in practical cases, several measurements were made, where the stator current of a machine with known number of broken rotor bars was read. Current measurements were performed for a healthy rotor and also for the same machine having different number of broken rotor bar. The rated data of the tested three-phase squirrel cage induction machine were: 0.5 kW, 415V, 1.05 A and 1380(FL) r/min. Tests were carried out for non-constant load with the healthy motor, and with similar motors having up to 12 broken rotor bars.
Table 1: Parameters of experimental induction motor
Power
0.5 HP
Current
1.05 Amp
Frequency
50 Hz
No. of pole pairs
2
Number of phases
3
Air gap length
2 mm
Speed
1500 r.p.m
Number of rotor slots
36
Volt 415
V
Efficiency(FL)
86%
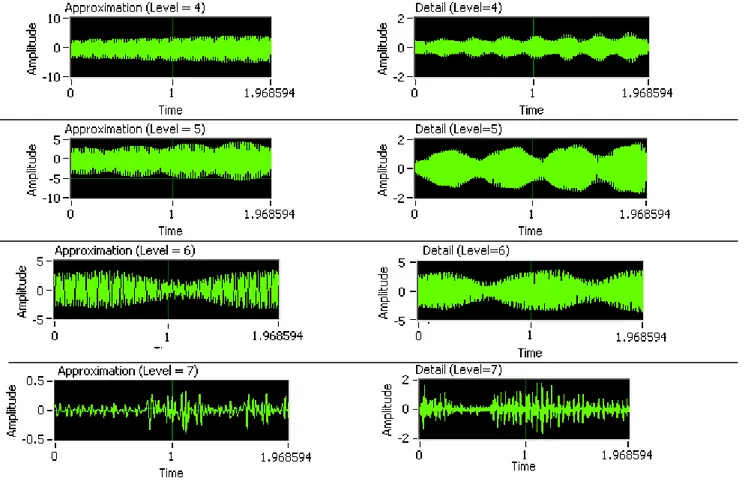
Figure 6: Multiresolution analysis for faulty motor with broken bars
4. Experimental results and analysis
In experimental analysis, it is extremely important if we expect good result that we adjust the acquisition parameters correctly in order not to miss the important information. In case of this experiment, a sample frequency of fs=6400 Hz and number of samples N=12600 have been chosen. This results in a frequency
bandwidth of 3200 Hz in an FFT analysis, which is enough to cover the significant current band of a 0.5 HP induction motor and to distinguish the harmonics due to a fault. Wavelet analysis show different windows, centered in different frequencies. The windows depend upon the sampling frequency. The wavelet analysis breaks up the signal in several details and one final approximation. The different components cover the entire frequency spectrum with different bandwidth.
Table 2: Decomposition details
Sr. no. Decomposition Details Frequency bands (Hz)
1 Detail at level1 3200-1600 Hz
2 Detail at level 2 1600-800 Hz
3 Detail at level 3 800-400 Hz
4 Detail at level 4 400-200 Hz
5 Detail at level 5 200-100 Hz
6 Detail at level 6 100-50 Hz
7 Detail at level 7 50-25 Hz
fault harmonic band, and it should be the preferred option in diagnosis the condition of the motor. For instance, the seven detail of the described wavelet, which is in the frequency band of 25-50 Hz is the most significant for the diagnosis of broken bars. Figure 5 and 6 show the wavelet decomposition from levels one to seven, for healthy motor and for a faulty motor respectively. For the decomposition levels from 1 to 5, there in no information about signal variation available. The wavelet details at level 7(figure 6) can be easily used for fault detection because amplitude at this level significantly increases which is clear indication of fault. The results of experiment show that wavelet decomposition is the right technique for non stationary signals.
5. Conclusions
This paper presents a methodology for the detection of broken rotor bar fault of induction motor based on wavelet analysis of the stator current which is useful for further online diagnosis in industrial applications. The experiment performed and results obtained show that wavelet analysis achieves good results in the field of fault diagnosis of induction motor. The higher level components of DWT of stator current follow a characteristic pattern. In this experiment, low frequency details five to seven are much more relevant for fault detection because they cover the frequency band corresponding to the supply and the fault frequency. This paper proves that the proposed method can diagnose broken rotor bar fault in non-constant load toque induction motor applications. Yet, this method requires good knowledge of signals to find the correct sampling frequency and mother wavelet to improve the detection of faults.
References
[1] A. H. Bonnett and G. C. Soukup, “Rotor failures in squirrel cage induction motors,” IEEE Transaction on Industrial Application, 22: 1165–1173 (1986).
[2] G. B. Kliman, R. A. Koegl, J. Stein, R. D. Endicott, and M. W. Madden, “Noninvasive detection of broken rotor bars in operating induction motors,” IEEE Transaction on Energy Conversion,3: 873–879 (1988). [3] J. Milimonfared, H. M. Kelk, S. Nandi, A. D. Minassians, and H. A. Toliyat, “A novel approach for
broken-rotor-bar detection in cage induction motors,” IEEE Transaction on Industrial Applications, 35(5), 1000–1006 (1999).
[4] S. Bachir, S. Tnani, G. Champenois, and J. C. Trigeassou, “Induction motor modeling of broken rotor bars and fault detection by parameter estimation,” in Proc. IEEE SDEMPED, Gorizia, Italy, 145–149 (2001) [5] J. R. Cameron, W. T. Thomson, and A. B. Dow, “Vibration and current monitoring for detecting airgap
eccentricity in large induction motors,” Proc. Inst. Electr. Eng., 133 (3): 155–163, (1986).
[6] W. T. Thomson, “On-line MCSA to diagnose shorted turns in low voltage stator windings of 3-phase induction motors prior to failure,” in Proc. IEEE IEMDC, Cambridge, MA, 891–898 (2001)
[7] R. R. Schoen, T. G. Habetler, F. Kamran, and R. G. Bartfield, “Motor bearing damage detection using stator current monitoring,” IEEE Transaction on Industrial Application, 31 (6): 1274–1279 (1995). [8] R. R. Obaid, T. G. Habetler, and J. R. Stack, “Stator current analysis for bearing damage detection in
induction motors,” in Proc. 4th IEEE SDEMPED, 182–187 (2003)
[9] B. Raison, G. Rostaing, O. Butscher, and C. S. Maroni, “Investigations of algorithms for bearing fault detection in induction drives,” in Proc. 28th Annu. Conf. IECON, 2, 1696–1701 (2002).
[10] T. Alford, Motor Current Analysis and Its Applications in Induction Motors Fault Diagnosis. ENTEK IRD Int. Corporation, 1998.
[11] M. E. H. Benbouzid, “A review of induction motors signature analysis as a medium for faults detection,” IEEE Transaction on Industrial . Electronics, 47(5): 984–993, (2000).
[12] W. T. Thomson and M. Fenger, “Case histories of current signature analysis to detect faults in induction motor drives,” in Proc. IEEE IEMDC, 3, 1459–1465 (2003)
[13] C. S. Burrus, R. A. Gopinath, and H. Guo, Introduction to Wavelets and Wavelet Transforms. A Primer. Englewood Cliffs, NJ: Prentice-Hall, 1998.
[14] The Wavelet Tutorial. [Online]. Available: http://engineering.rowan.edu/
~polikar/WAVELETS/WTtutorial.html
[15] W. S. Chow and S. Hai, “Induction machine fault diagnostic analysis with wavelet technique,” IEEE Transaction on Industrial Electronics. 51(3); 558–565, (2004).
[16] Lokenath Debnath, “Wavelet Transforms and Time Frequency signal analysis”, Birkhauser Boston, (2001) [17] www.ni.com
[18] H. L. Resnikoff, R.O. Wells, “Wavelet Analysis”, Springer, (2004)
[19] J. Roger-Folch, J. Antonino, M. Riera, and M. P. Molina, “A new method for the diagnosis of rotor bar failures in induction machines via wavelet decomposition,” in Proc. 16th ICEM, Cracow, Poland, Sep. 5– 8, (2004).
[21] J. Cusido, A. Jornet, L. Romeral, J.A Ortega, A. Garica, “Wavelet and PSD as a fault detection techniques”, Instrumentation and measurement Technology Conference Sorrento, Italy 24-27, 1397-1400, (2006). [22] W.A. Wilkinson, M.D. Cox, “Discrete Wavelet Analysis of Power system transients”, IEEE Transactions
on Power systems, 11,(4):1110-1116 (1996).
Neelam Mehala received the B.E. degree from North-Maharastra
University, Jalgaon, India and M.Tech. degree from National Institute of Technology, Kurukshetra, India in 1998 and 2002 respectively both in Electronics and Communication Engineering. She is currently working as Lecturer in Electronics and Communication Engineering Department at YMCA University of Science and Technology, Faridabad (Haryana) and also perusing her Ph.D. from National Institute of Technology Kurukshetra, India. Her areas of interest are Signal Processing and fault diagnosis of electric machines.
Dr.Ratna Dahiya received her B.Tech from GBU, Pant Nagar and
![Figure 1: Two channel perfect Reconstruct filter banks [112]](https://thumb-eu.123doks.com/thumbv2/123dok_br/17185857.242087/3.892.107.817.115.346/figure-channel-perfect-reconstruct-filter-banks.webp)