Embedded Object Detection with Radar Echo Data by
Means of Wavelet Analysis of MRA:
Multi-Resolution Analysis
Kohei Arai
Department of Information Science Saga University
Saga City, Japan
Abstract—A method for embedded object detection with radar echo data by means of wavelet analysis of MRA: Multi-Resolution Analysis, in particular, three dimensional wavelet transformations is proposed. In order to improve embedded object detecting capability, not only one dimensional radar echo data but also three dimensional data are used. Through a comparison between one dimensional edge detection with Sobel operator and three dimensional wavelet transformation based edge detection, it is found that the proposed method is superior to the Sobel operator based method
Keywords-Three dimensional wavelet transformation; Radar echo data; wavelet MRA; Edge detection.
I. INTRODUCTION
Measuring instrument of Pulsed Radar for Underground object detections and object shape estimations: PRU data is used to use for detecting embedded objects underground in general. The problems of the PRU utilized embedded object findings are (1) range and azimuth resolution is not good enough for small object detections, (2) poor resolution of radar echo signal receivers in the case that there is small difference of dielectric characteristics between embedded objects and its surrounding materials. Other than these, (3) multiple reflections from embedded objects and surrounding materials are another problems together with (4) interference due to multiple echo from embedded objects and surrounding materials such as boundary layers, tiny stones, etc.
Through human perceptions with PRU radar echo data, in general, embedded objects are used to find usually. Therefore, it requires huge experiences and knowledge for the person in charge on human perceptions. Meanwhile, automatic detections with differentiation operator of embedded objects from the radar echo data are used to attempt. The method for estimation of the shape of embedded objects and medium of material parameters from radar echo data is proposed [1]. Also the method utilizing filtering and correlation analysis for noise removals is proposed together with the preprocessing of wavelet analysis based method [2]. On the other hand, the method for feature extractions in the frequency domain which uses Fourier transformation is proposed. Meanwhile, Hough transformation based method is proposed for extraction of embedded objects utilizing the well known feature of which
cylindrical shape of embedded objects show bi-polar function of the curves theoretically [4].
The conventional embedded object finding methods are based on the edge detection algorithms utilizing the differentiation operator and wavelet based Multi Resolution Analysis [5]: MRA. In the methods, radar echo data are treated as one dimensional data. One dimensional differential operators and MRA are used to use in the conventional methods. Radar echo data are essentially three dimensional data. Therefore, it is possible to improve edge detection performances by using three dimensional differentiation operators and three dimensional MRA.
The following section describes the proposed three dimensional MRA for detection of embedded objects with radar echo data followed by a comparison of edge detection performance between the conventional one dimensional differentiation operators (The well-known Sobel operator in the paper) and the proposed three dimensional MRA. Then conclusions and some discussions are followed.
II. PROPOSED METHOD
A. Pulsed Rdar for Underground Object Detections and Object Shape Estimations
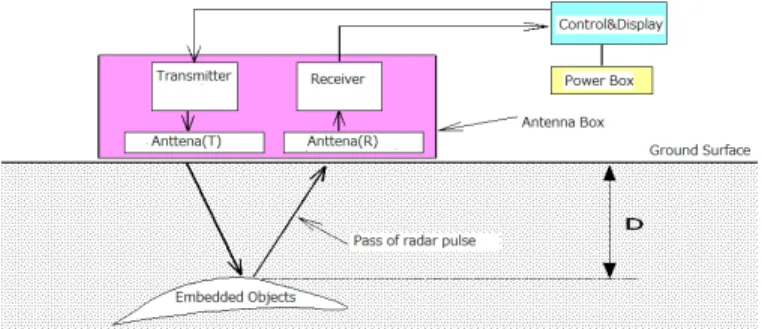
Fig.1 shows the principle of the pulsed radar for underground object detections and object shape estimations. Radar echo data is the function of time, f(t) at the position in concern and is scanned in two dimensional ground surface, f(t:x,y).
(1)
where V and C denotes, respectively, electric magnetic wave propagation speed of the underground and the air. T denotes time interval of the pulse repeat cycle while εr denotes di-electric constant of the soils of the underground.
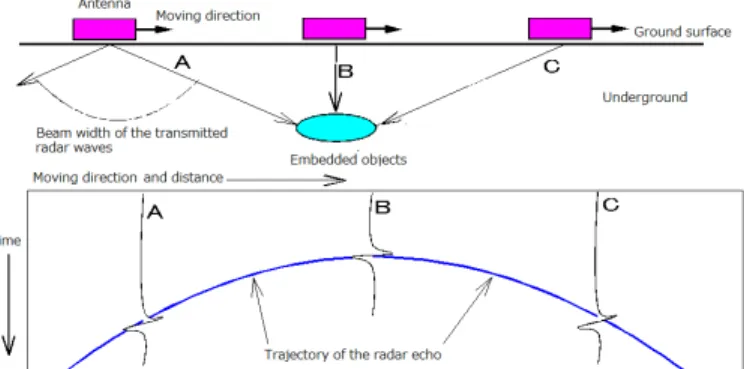
Cylindrical or spherical shapes of embedded objects in the underground show the edges as a parabolic function in the pulsed radar echo image as shown in Fig.2.
Figure 2. Radar echo waveforms from cylindrical and spherical shapes of embedded objects in the underground
If the embedded objects are such cylindrical and spherical shapes of objects, object shapes and three dimensional location of the object can be estimated with a prior knowledge of the radar echo waveforms. It, however, is not always appropriate of the assumption of the object shapes. For instance, there are some embedded cluster pipes and box type of pipes. It have to be estimated and determined the object shapes and the three dimensional locations without such assumption.
B. The Proposed Method based on Wavelet Multi Resolution Analysis: MRA
In order to estimate and to determine the object shapes and the three dimensional locations, edges in the radar echo is extracted. In the conventional method for edge detection, one dimensional differentiation in time domain is used to apply to the acquired radar echo. Also one dimensional wavelet transformation or Multi Resolution Analysis: MRA is applied to the radar echo data then inverse wavelet transformation or reconstruction with high frequency component is applied to the wavelet transformed data thus edges are extracted, in general. Radar echo data, in essential, is three dimensional data.
Therefore, edge detection performance of the three dimensional MRA or wavelet transformation based edge detection method is superior to the one dimensional methods. Namely, two dimensionally scanned radar echo signals shows three dimensional data. Then three dimensional MRA is applied to the three dimensional radar echo data. After that, reconstruction is made without low frequency components results in three dimensional edges are detected. It could be superior to the conventional one dimensional edge detection with one dimensional differentiation or differential operators.
C. Daubechies base function based Wavelet Transformation One dimensional wavelet transformation is expressed with the equation (2).
F=Cn f (2)
where F, f denotes wavelet frequency component and radar echo signal as a function of time. Cn denotes wavelet transformation matrix which is expressed as a bi-orthogonal function based on base functions. Cn can be determined with a reference to the appendix. Therefore, CnCnt=I. Then f is converted to F1=(L1,H1), F2=CnL1=(L2,H2), F3=CnL2=(L3,H3), and Fm=CnLm-1=(Lm,Hm). Also f is reconstructed as Cn -1
Fm=Cn-1(Lm,Hm)=Lm-1,...,Cn-1F2=L1, Cn-1F1=f.
There are some based functions such as Haar, Daubechies1, etc. Through the experiment with preliminary simulation of radar echo data, Daubechies base function is selected. Daubechies base function is one of bi-orthogonal functions. Then F=(L1,H1).where L1, H1 denotes low and high frequency components, respectively. If inverse wavelet transformation is applied to the H1 component and zero filled L1 component, then one dimensional edge (high frequency component) can be extracted.
One dimensional wavelet transformation can be expanded to two dimensional transformations easily. Namely,
F=[Cn[Cmfxy]t] (3)
where Cm denotes another wavelet transformation matrix while fxy denotes two dimensional scanned radar echo data. As the result, F=(LL1,LH1,HL1,HH1) with four frequency components in x and y directions, LL1,LH1,HL1,HH1. If the two dimensional inverse wavelet transformation is applied to the F with zero filled LL1 and the other frequency components, then two dimensional edges are extracted.
Pulsed radar echo data is expressed with three dimensional data essentially, fxyz . x and y directions are corresponding to the scanned directions of the ground surface while z direction is corresponding to time. Then three dimensional wavelet transformations are defined with the equation (4).
F=[Cn[Cm[Clfxyz]t]t] (4)
Thus eight frequency components are derived. Then the three dimensional inverse wavelet transformations is applied to F with zero filled LLL1 and the other frequency components results in three dimensional edges are extracted.
1
Daubechies base function is defined as {αk} satisfying the following
conditions, r
T C T V D
2 2
・ ・
III. EXPERIMENTS
A. Data Used
PRU of SIR-2 which is manufactured by GSSI: Geophysical Survey Systems, Inc. with the center frequency of 400MHz is used to acquire the pulsed radar echo data of embedded objects of the road from the Kami-Tozu to the Shimo-Tozu, Kokura ward, Kita-Kyushu City, in Japan on 2nd of April 2004. Fig.3 shows the structure in the underground of this road.
Ground surface (Road)
Figure 3. Cross section of the underground structure of the embedded objects.
The embedded objects as shown in Table 1 are found from the underground of the road in concern.
TABLE1.OBJECTS WHICH ARE EMBEDDED IN THE UNDERGROUND OF THE ROAD IN CONCERN.DISTANCE DENOTES THE DISTANCE FROM THE LEFT END OF
THE ROAD.DEPTH 1 SHOWS THE PREDICTION RESULTS WHILE DEPTH 2 DENOTES THE ACTUAL DEPTH OF THE EMBEDDED OBJECTS THROUGH HUMAN
PERCEPTIONS WITH PRU RADAR ECHO DATA.
Object No. Object name Distance(m) Depth1(m) Depth2(m)
1 Cables 1.0-2.0 0.5-1.2 0.7-1.3
2 Pipes 1.25 1.5 1.3
3 Common use
boxes 4.95 Unknown Unknown
4 Old pipes 17.3 1.2 1.1
5 Cables 18-18.3 0.75-1.5 1.2
6 Common use
boxes 19.3-20.5 Unknown Unknown
7 Pipes 21 1.1 1.1
The common use boxes include some pipes and cables for commonly used for the local governments and public agents and the others. The distances of the common use boxes are known while their depth is unknown. These data are not found in the old list. Also it is difficult to estimate the depth and dimensions of the common use boxes because it is not identifiable in the PRU radar echo data as well. The cables and pipes are situated at the two locations, respectively. Their dimensions are known. The old pipes are not useable situations.
The depth and the dimensions of the embedded objects derived from human perceptions are coincident to the predicted depth and dimensions which are estimated from the record which is created at the construction of the road.
Although human perceptions with PRU radar echo data seems reliable, it takes huge experiences and knowledge.
B. Attempt for Finding Unknown Objects of Common Use Boxes
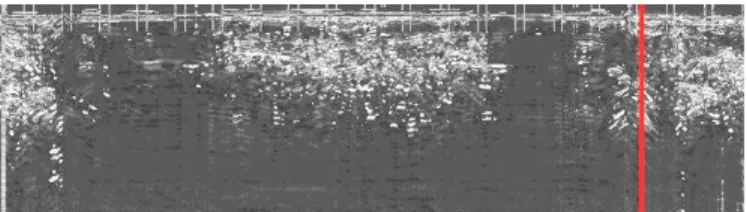
As it is mentioned above, the common use boxes are difficult to find the location and shapes (dimensions) through human perceptions with PRU radar echo data. An attempt is made to estimate the location and shapes of the common use boxes with the proposed method. Fig.4 shows the PRU radar echo data (reflected echo signals).
1 2 3 4 5 6 7
Location in concern A B
Figure 4. Received scanned PRU radar echo data which corresponds to cross section of the road. The top row numbers ranges from 1 to 7 are corresponding
to the embedded objects which are listed in the Table 1.
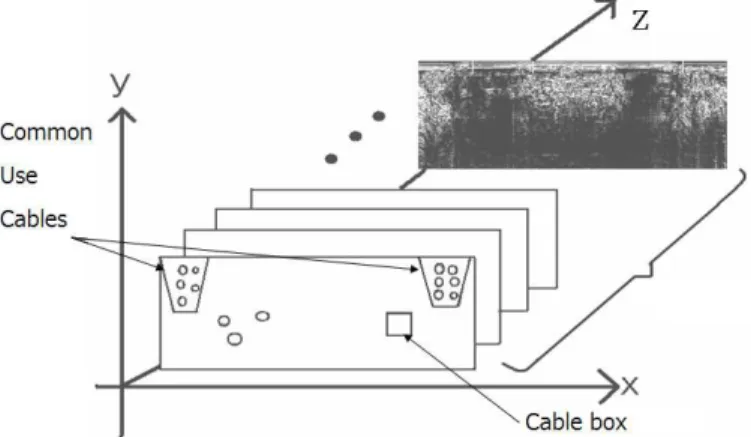
In the Fig.4, the locations of two unknown embedded objects are indicated with location in concern A and B, respectively. It is hard to identify by human perceptions even for the expertise persons. On the other hand, the other objects are recognizable and are identified the location and the shapes. Three dimensional representations of PRU radar echo data is illustrated in Fig.5.Three dimensional edges are detected with the proposed MRA based method. Namely, if the reconstruction process is made without low frequency component, LLL1, then high frequency component of edges can be detected. Three dimensional edges have much information rather than two dimensional edges and also rather than one dimensional edge.
Figure 5. Conceptual three dimensional PRU of radar echo of the underground of the road.
C. Experimental Results
in Fig.6. Fig.6 (a) and (g) shows PRU radar echo data and shows the location of embedded objects No.3 and No.6. In the figure, not only PRU radar echo but also one dimensional profile in the direction of depth repeatedly.
(a) The location in concern A in the PRU radar echo data
(b)One dimensional profile at the location A in the depth direction
(c)Detected edges of the location A based on Sobel differentiation operator
(d)One dimensional profile of the location A in the depth direction(edges are detected with Sobel differentiation operator)
(e)Detected edges of the location A based on the proposed three dimensional MRA based method with three dimensional data of PRU radar echo data
(f)One dimensional profile of the detected edges of the location A based on the proposed three dimensional MRA based method with three dimensional
data of PRU radar echo data
(g)The location B in the PRU radar echo data
(h)One dimensional profile of the location B in the depth direction
(i) Detected edges of the location B by using Sobel operator
(k)Detected edges of the location B based on three dimensional MRA based method with three dimensional PRU radar echo data
(l)One dimensional profile of the detected edges of the location B based on three dimensional MRA based method with three dimensional PRU radar echo
data
Figure 6. Comparisons of the detected edges by Sobel operator and the proposed three dimensional MRA based method
D. Discussionss
In the case of Sobel operator, undesired edges are detected results in valuable and desirable edges are hidden by the detected undesired edges. Meanwhile, the proposed three dimensional MRA based edge detection method allows detection of desirable edges depending on frequency components of edges. In this paper, although one level, single stage of MRA is used, variety frequency components of edges can be detected by changing the level. MRA does work as filter bank.
Fig.6 (f), (i) shows the edges which are corresponding to the common cable and pipes boxes with the proposed three dimensional MRA based edge detecting method. The location at which the edges are detected is totally equal to the boxes locations. Meanwhile, the resultant images of Sobel operator of the boxes does not show clear edges which are corresponding to the boxes.
IV. CONCLUSION It may concluded that
(1) the proposed three dimensional MRA based edge detection is superior to the conventional edge detection method with differentiation operator such as Sobel, Laplasian, etc. in terms of sensitivity to undesired edges, (2) The proposed three dimensional MRA based edge
detection method is superior to the one dimensional MRA based edge detection method in terms of three dimensional edge detection,
(3) Detected edges are coincident to these of which the expertise persons’ results, in particular, the edges which are difficult to detect such as the common cable and pipe boxes in the experiment of the roads.
ACKNOWLEDGEMENT
The author would like to thank to GIS Kyushu Co. Ltd. for providing the PRU radar data as well as the information of the embedded objects in the underground of the road in concern. Also the author would like to thank to joint research member of the cooperated research was made between GIS Kyushu Co. Ltd. and the Saga University.
REFERENCES
[1] Tanaka, et al., Surveillances of the embedded objects by means of time domain analysis, Proceedings of the 5th Workshop on the Underground
Measurements with Electro Magnetic Waves, 67-72, 1999.
[2] Tada, et al., Investigation of characteristics with the noise removal method utilizing two dimensional parabolic function of wavelet for PRU radar data, Proceedings of the 5th Workshop on the Underground
Measurements with Electro Magnetic Waves, 73-78, 1999.
[3] Nagashima, et al., Technology of embedded object findings by means of pattern recognition method in frequency domains, Proceedings of Space Aeronautics Electronics Symposium, SANE-87-54, 1987
[4] Yamauchi, H., Image processing methods for underground object identifications with PRU radar images, Ritsumeikan University Symposium on Image Processing and Analysis, pp.21-30,1999. [5] Arai, K. Fundamental Theory of Wavelet Analysis, Morikita Shuppan
Publicing Co. Ltd., 2000.
APPENDIX (WAVELET TRANSFORMATION MATRIX)
For instance, the 8th order2 of Daubechies base function based Cn with the support length of two can be expressed with the equation (A1).
8 1 7 0 8 1 7 0 6 1 5 0 6 1 5 0 4 1 3 0 4 1 3 0 2 1 1 0 2 1 1 0 8 7 6 5 4 3 2 1 1 0 1 0 1 0 1 0 1 0 1 0 1 0 1 0 8 7 6 5 4 3 2 1 ] 2 [ 8 q q p p q q p p q q p p q q x p x p q q p p q q p p q q p p q q p p C (A1)
The 8th order of Cn with the support length of four is also expressed with the equation (A2).
2
2 3 1 2 8 1 7 0 2 3 1 2 8 1 7 0 8 3 7 2 6 1 5 0 8 3 7 2 6 1 5 0 6 3 5 2 4 1 3 0 6 3 5 2 4 1 3 0 4 3 3 2 2 1 1 0 4 3 3 2 2 1 1 0 8 7 6 5 4 3 2 1 1 0 3 2 1 0 3 2 3 2 1 0 3 2 1 0 3 2 1 0 3 2 1 0 3 2 1 0 3 2 1 0 8 7 6 5 4 3 2 1 ] 4 [ 8 q q q q p p p p q q q q p p p p q q q q p p p p q q q q p p p p q q q q p p p p q q q q p p p p q q q q p p p p q q q q p p p p C (A2)
pi and qi in the equations (A1) and (A2) is also expressed with equation (A3) and (A4), respectively.
0 1 0 2 1 0 0 0 0 1 1 0 1 0 ] 2 [ ] 2 [ q q p q p q p p I C Cn T n n(A3)
0 3 2 1 0 0 3 2 1 0 2 3 1 2 1 1 1 0 1 3 0 2 0 1 0 0 0 0 3 1 2 2 1 3 0 3 2 1 0 ] 4 [ ] 4 [ q q q q q q q q p q p q p q p q p p p p I CC n n
T n
(A4)
These equation can be expanded to the general support length of Cn as shown in equation (A5).
) 1 2 sup ( ,..., 2 , 1 , 0 0 ) 1 (sup ,..., 2 , 1 , 0 1 2 1 sup 0 ) ) 1 ((sup 1 sup 0 [sup] [sup] r q j j p q p I C C j j r j j j j j n n T n (A5)Therefore, the coefficients of the Daubechies base function can be determined from the solution of the equation (A5).
AUTHORS PROFILE Kohei ARAI
Saga University Saga, Japan