www.ccarevista.ufc.br ISSN 1806-6690
Quantitative genetic analysis for meat tenderness trait in Polled
Nellore cattle
1Análise genética quantitativa da característica maciez da carne em bovinos Nelore
Mocho
Letícia Mendes de Castro2*, Cláudio Ulhôa Magnabosco3, Roberto Daniel Sainz4, Carina Ubirajara de Faria5 e Fernando Brito Lopes6
ABSTRACT - The aim of the present study was to analyze the interrelationships among the variables and also estimate the genetic correlations between tenderness (WBSF), growth (ILW, FLW and ADG) and carcass (BF, RF and LMA) features. Other purpose was to identify individuals who were more likely to be carriers of favorable genes for tenderness. Growth, carcass and tenderness data from 415 Polled Nellore animals was analyzed. Factor analysis and canonical correlations were used to analyze the phenotypic relationships. The covariance components and genetic parameters were estimated using Gibbs Sampling method. Lack of phenotypical correlations between the WBSF and the other traits were observed. The genetic correlations between WBSF and the other evaluated traits were of a low magnitude, with values of -0.15; -0.18; -0.13; 0.10; -0.12 and 0.18, between WBSF and ILW, FLW, ADG, BF, RF and LMA, respectively. The results support the conclusion that tenderness selection will not affect the selection of other economic traits and vice-versa, but for a better knowledge of the genetic relationships between meat tenderness and other traits for Polled Nellore more studies are required. The heritability estimated for WBSF was of a low magnitude (0.11 ± 0.022). Based on the principle of probability of identical genes by ancestry individuals who were more likely to be carriers of favorable genes for tenderness were identified. Further work will include creation of a segregating population that will serve as experimental material for future gene prospecting and identification research.
Key works:Carcass. Shear force. Pedigree.
RESUMO - Objetivou-se analisar os inter-relacionamentos entre as variáveis, além de estimar as correlações genéticas entre os grupos de características de maciez (FC), crescimento (PI, PF e GPD) e carcaça (EG, P8 e AOL). Foi proposto também, identificar indivíduos que apresentem alta probabilidade de serem portadores de genes favoráveis à maciez. Analisou-se dados de 415 animais Nelore Mocho, filhos de touros repreAnalisou-sentativos das principais linhagens Nelore, avaliados para características de crescimento, carcaça e maciez. Para análises de relacionamentos fenotípicos foram utilizadas análises de fatores e correlações canônicas. Os componentes de variância necessários à obtenção dos parâmetros genéticos foram estimados pelo método da Amostragem de Gibbs. Observou-se ausência de correlações fenotípicas entre FC e as outras características produtivas. As correlações genéticas entre FC e PI, PF, GPD, EG, P8 e AOL foram de baixa magnitude (-0,15; -0,18; -0,13; 0,10; -0,12 e 0,18). A seleção para a maciez não influenciará na seleção de outras características de interesse econômico e vice-versa, porém serão necessários mais estudos para melhor conhecimento sobre as relações genéticas da maciez e outras características produtivas em bovinos Nelore Mocho. A estimativa de herdabilidade para a característica FC foi de baixa magnitude (0,11 ± 0,022). Baseando-se no princípio da probabilidade de genes idênticos por descendência, identificou-se indivíduos com alta probabilidade de possuírem genes favoráveis à maciez. Posterior trabalho irá incluir a criação de uma população segregante a partir desses animais identificados, que irá servir como população experimental para posterior pesquisa de prospecção e identificação de genes para maciez da carne em bovinos Nelore Mocho.
Palavras-chave: Carcaça. Força de cisalhamento. Pedigree.
* Autor para correspondência
1Recebido para publicação em 28/11/2012; aprovado em 28/12/2013
Parte da Dissertação de Mestrado do primeiro autor; Pesquisa Financiada pela Embrapa/CNPq
2Programa de Pós-Graduação em Ciência Animal, Universidade Federal de Goiás, Bolsista Capes, Goiânia-GO, Brasil, [email protected] 3Embrapa Cerrados/CNPq, Brasília-DF, Brasil, [email protected]
4Embrapa, Brasília-DF, Brasil, Professor da University of California, Davis-CA, EUA, [email protected] 5Universidade Federal de Uberlândia, Uberlândia- MG, Brasil, [email protected]
INTRODUCTION
In Brazil, Zebu animals comprise around 80% of the national cattle herd, showing differences in growth and production potential between the different country regions and also between different management systems (FERRAZ; ELER, 2010). Several researchers have studied carcass, food intake and growth traits, such as weight at different ages, growth curves and features
related to growth rate of Nellore cattle (BOUQUET et
al., 2010; HERD; ARCHER; ARTHUR, 2004; HOQUE
et al., 2009; LANCASTER et al., 2009; LOPES et al.,
2011; LOPES et al., 2012; ROBINSON; ODDY, 2004;
SOUZAet al., 2008; SANTOS et al., 2012). However,
research to evaluate meat quality, especially tenderness and its relationships with growth and carcass quality traits of Zebu cattle in Brazil, are incipient.
In 2012, Brazil produced about 9.6 million tons of beef and, of these, approximately 1.8 million tons were destined for export (USDA, 2013), making Brazil the largest beef exporter in the world by volume. However, Brazil lags behind other global beef exporters in export value, losing to countries such as the U.S. and Australia (IBGE, 2011), because most of the beef exported by Brazil is considered of medium and low quality by international buyers.
Among the features that depreciate the quality of Brazilian exported beef is the low tenderness, mainly because most of that meat comes from animals with Zebu genetic background, known to be less tender than
beef from Bos taurus beef breeds. However, research
developed with Nellore cattle (SAINZ et al., 2005) has
demonstrated the existence of genetic variability for beef tenderness, indicating that this trait can be improved through genetic selection. Some researchers suggest that differences for meat tenderness within same breed sires are greater than the mean differences for meat tenderness
between sires from different breeds (BIANCHINIet al.,
2007; SAINZet al., 2005), indicating that the selection of
the right sire can make all the difference.
Despite the fact that genetic improvement of beef tenderness in Zebu populations are of major importance, very few structured herds include this trait in their breeding programs, because Brazilian packers do not pay for meat quality as in other countries, rather they pay only for quantity. However, there are studies showing that consumers would be willing to pay more for meat quality, especially regarding meat tenderness
(BOLEMANet al., 1997).
In this context, we aimed to estimate the (co) variance components and genetic parameters for meat tenderness, growth and carcass traits, as well as adopt
strategies to identify individuals that have the probability of being carriers of the desired genetic material for breeding, in order to generate a population that will serve as experimental material for further phenotyping, prospection and gene identification work for meat tenderness in the Polled Nellore cattle breed.
MATERIALS AND METHODS
The construction of this database was possible due to two slaughters, conducted in 2004 and 2008, of a Polled Nellore population with known genealogy and evaluated for meat tenderness.
These slaughters are derived from a study conducted by Marca OB Ranch and the Brazilian Agricultural Research Corporation - Embrapa for characterization and genetic selection for meat tenderness in Polled Nellore. In this study, 22 sires were selected representing the main Nellore bloodlines to be mated with 552 Polled Nellore cows. The progenies of these matings were raised on pasture, finished in feedlot for three months and slaughtered with ages ranging from 24 to 26 months old.
In the first study, 234 animals, offspring of pure breed Polled Nellore sires and commercial Polled Nellore dams, born between October 2002 and January 2003 were slaughtered in November 2004, at an average age of 24 months. In the second study, 181 animals, offspring of pure breed Polled Nellore sires and dams, born between February and April of 2006 were slaughtered in August 2008 at an average age of 26 months. Due to these experimental slaughters, complete pedigree and phenotypic evaluations for carcass and meat tenderness data of 415 progenies of pure breed Polled Nellore sires and dams were produced, forming a relationship matrix containing 956 animals.
The analyzed traits were: initial live weight (ILW); final live weight (FLW); average daily gain (ADG); longissimus muscle area (LMA); rump fat thickness (RF); backfat thickness at the 12th-13th rib (BF); and Warner-Bratzler shear force (WBSF),
determined using the Longissimus dorsi muscle after
ageing for seven days at 4 ºC (WHEELER et al.,
2005).
The statistical analyses were conducted using
SAS® (Statistical Analysis System, 2004), through
The animals’ pedigree information was organized so that similar groups were formed by using CLUSTER procedure. Clusters were defined using Ward’s method (HAIRet al., 2005).
The variance components needed to obtain the genetic parameters were estimated by the Gibbs Sampling method, as described by Van Tassell and Van Vleck (1996), using the MTGSAM (Multiple Trait using Gibbs Sampler under Animal Model) program. The basic linear model for single trait and bivariate analyses was:
y = X = Zu + e (1)
where y = vector of the dependent variable,
= vector of fixed effects, X = incidence matrix
that associates with y, Z = incidence matrix that
associates the vector u to y, u = vector of additive
genetic effects, ande = vector of residual effects. The
linear model included the additive genetic and residual random effects, the fixed effects of the animal sex and contemporary group (formed by year of slaughter and slaughter date) and the systematic effect of age as covariate.
For the prior values of additive and residual (co)variances the uninformative or “flat” (reflecting no prior knowledge of the parameter) distribution was used. In the implementation of the Gibbs Sampling a chain of 1,500,000 cycles was used, the first 500,000 cycles were discarded (burn in period) and the samples taken every 1,000 cycles, totaling 1,000 Gibbs samples. For convergence evaluation the GIBANAL software (VAN KAAM, 1997) was used.
To identify animals with higher and lower genetic potential for meat tenderness, the data analyses were based on the relationship structure among animals connected to individuals with genetic and phenotypic information regarding meat tenderness.
The analytical procedures, implemented in
SAS®, were conducted using the principle of identical
genes probability by descent to ancestral “founders”, that were more likely to be carriers of genes favorable to express the trait of interest, as proposed by Lacy (1989). The model can be described as follows:
(2)
where r
i is the expected portion of the founder
i alleles that was retained within the descending
population, and p
i is the portion of the founderi genes in the descending population.
RESULTS AND DISCUSSION
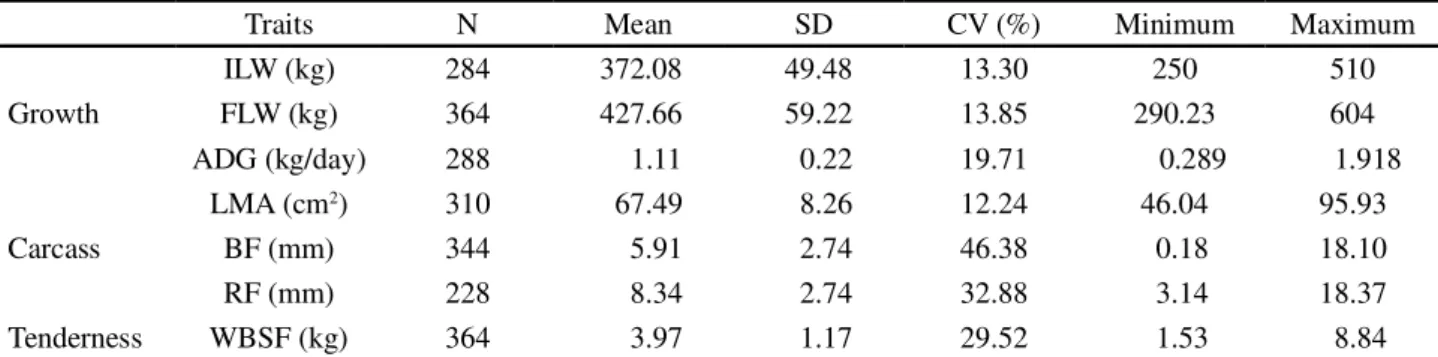
The ILW and FLW showed high standard deviations, possibly because the animals were selected by their lineage and not for their weight. The same can be observed when evaluating the carcass data, which presented high coefficients of variation (46.38% for BF and 32.88% for RF), and illustrates the heterogeneity of these group of animals studied, in other words, that occurred because these animals were not pre-selected based on their phenotype, but based on their genealogy (Table 1).
The WBSF trait also showed a high coefficient of variation (29.51%), indicating heterogeneity of the data set with values ranging from 1.53 to 8.84 kg. This high variation of WBSF within a population or contemporary
group has been reported previously (LAGE et al.,
2012). Although there are studies indicating genetic
influences on meat tenderness (SAINZ et al., 2005),
this trait is highly influenced by environmental factors,
ante mortem or post mortem (PARDI et al., 2005),
which results in a high heterogeneity of WBSF values even within one population.
The means obtained for growth traits (ILW, FLW and ADG) in this population were 372 kg, 428 kg and 1.11 kg day-1, respectively. It is noteworthy that, when analyzing the data of ILW and FLW, there was a wide variation between the minimum and maximum values for these features. This occurred because those animals were selected in order to form an experimental population, thus, they were selected primarily for their lineage and not according to a margin of predetermined weight. This heterogeneity of weights as a result of a selection based on the animals’ lineage was also reported by Sainzet al. (2005).
The characteristics related to carcass quality
measuredin vivo by ultrasound, such as LMA, BF and
RF, showed mean values of 67.49 cm2, 5.91 mm and
8.34 mm, respectively. Previous studies (COSTAet al.,
2005; SILVAet al., 2004; YOKOOet al., 2009) indicate
that even when considering research using animals of the same breed, the values of growth and carcass traits differ considerably from one study to another. This is probably due to variations in types of management and feed regimes, as well as the ages at which the measures were obtained.
The mean WBSF value found (3.97 kg) was similar to that reported by Lageet al. (2012), who obtained 3.39
kg for Nellore animals. Higher values were reported by
Razook et al. (2001), who, analyzing different herds of
Table 1 - Descriptive statistics for growth (ILW, FLW and ADG), carcass (LMA, BF and RF) and tenderness (WBSF) traits of Polled Nellore cattle breed
Traits N Mean SD CV (%) Minimum Maximum
Growth
ILW (kg) 284 372.08 49.48 13.30 250 510
FLW (kg) 364 427.66 59.22 13.85 290.23 604
ADG (kg/day) 288 1.11 0.22 19.71 0.289 1.918
Carcass
LMA (cm2) 310 67.49 8.26 12.24 46.04 95.93
BF (mm) 344 5.91 2.74 46.38 0.18 18.10
RF (mm) 228 8.34 2.74 32.88 3.14 18.37
Tenderness WBSF (kg) 364 3.97 1.17 29.52 1.53 8.84
N: nº of animals, CV: coefficient of variation, SD: Standard Deviation, IWL: initial live weight, FLW: final live weight, ADG: average daily gain, LMA: longissimus muscle area, BF: backfat thickness at the 12th-13th rib, RF: rump fat thickness, WBSF: Warner-Bratzler shear force of the Longissimus dorsi
Guzerat, Nellore and Caracu breeds, respectively. Previous work shows that WBSF values tend to decrease with
the addition of Bos taurus genes through crossbreeding
(LAGEet al., 2012). The WBSF values also decrease as
beef ageing time increases (BIANCHINI et al., 2007)
and when animals are slaughtered at younger ages
(BIANCHINIet al., 2007: RUBIANOet al., 2009).
With the increased proportion of Zebu genes a decrease in calpain activity occurs which, according Pardiet al. (2005), is the most important enzyme in meat
ageing, for degrading myofibrillar proteins and thus achieving optimal tenderness. The reduced rate of ageing in beef from Zebu animals is due to a higher activity of calpastatin, an endogenous protein that inhibits calpain activity (O’CONNOR, TATUM and WULF, 1997). When the calpains are inhibited, the rate of fragmentation of muscle fibers during thepost mortemperiod is decreased.
Significant differences in ILW, FLW and ADG were observed between animals with high and low WBSF. Animals with lower WBSF proved to be heavier and with greater average daily gain than the animals with higher WBSF. There was no significant difference between the
Table 2 - Comparison of growth, carcass and tenderness traits between males and females and between animals with high and low WBSF
ILW FLW ADG LMA BF RF WBSF
High WBSF 304 B 426 B 1.11 B 66.81 A 5.92 A 8.35 A 4.63 A
Low WBSF 320 A 442 A 1.17 A 68.02 A 5.99 A 8.36 A 2.93 B
Female 252 B 396 B 1.06 B 65.71 B 7.03 A 9.58 A 4.09 A
Male 344 A 470 A 1.17 A 69.67 A 4.72 B 7.19 B 3.85 B
two groups of WBSF phenotypes in the carcass traits (LMA, BF and RF).
There were significant differences between males and females for growth (ILW, FLW and ADG), carcass (LMA, BF and RF) and tenderness (WBSF) traits. The males evaluated in both slaughters showed higher ILW, FLW, ADG, LMA and WBSF than the females, but the females showed greater BF larger than the males. This was probably because females tend to reach maturity earlier compared to males, therefore, they enter early in the fattening stage and have lower carcass weight and greater fat thickness compared to
males (RODRIGUESet al., 2010) (Table 2).
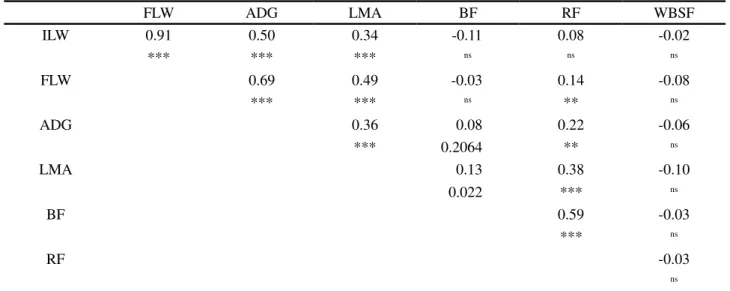
No significant phenotypic correlations (p > 0.05) were observed between growth traits (ILW, FLW and ADG) or carcass traits (LMA, BF and RF) and WBSF (Table 3). To better understand the structure of the phenotypic correlations among traits, an analysis of factors was performed using multivariate techniques. The factorial analysis describes the dependence structure of a set of variables by creating factors that measure common aspects (JOHNSON; WHICHERN, 1998), in other words,
the factor analysis will compare the groups in terms of similarity and dissimilarity and correlation.
The results of the factor analysis of the features are shown in Table 4, indicating that a minimum of three factors were needed to explain more than 80% of the total variance.
Table 3 - Phenotypic correlation estimates between growth (ILW, FLW, ADG), carcass (LMA, BF, RF) and tenderness (WBSF) traits of Polled Nellore cattle
FLW ADG LMA BF RF WBSF
ILW 0.91 0.50 0.34 -0.11 0.08 -0.02
*** *** *** ns ns ns
FLW 0.69 0.49 -0.03 0.14 -0.08
*** *** ns ** ns
ADG 0.36 0.08 0.22 -0.06
*** 0.2064 ** ns
LMA 0.13 0.38 -0.10
0.022 *** ns
BF 0.59 -0.03
*** ns
RF -0.03
ns
Significance: *(p < 0.05); **(p < 0.01); ***(p <0.001); ns: not significant; IWL: initial live weight, FLW: final live weight, ADG: average daily gain, LMA: longissimus muscle area, BF: backfat thickness at the 12th-13th rib, RF: rump fat thickness, WBSF: Warner-Bratzler shear force of the Longissimus dorsi
Table 4 - Common factors analysis, percentage of explained variance by each factor and cumulative variance
Figure 1 - Graphical relationship between the eigenvectors 1, 2 and 3
IWL: initial live weight, FLW: final live weight, ADG: average daily gain, LMA: longissimus muscle area, BF: backfat thickness at the 12th-13th rib, RF: rump fat thickness, WBSF: Warner-Bratzler shear force of the Longissimus dorsi
Eigenvectors Autovalue
Explained variance
(%)
Cumulative variance
(%)
Factor 1 3.445 0.43 0.43
Factor 2 1.973 0.25 0.68
Factor 3 1.003 0.13 0.80
Factors 1, 2 and 4 were responsible for 43%, 25% and 14% of the variances presented by all the traits, respectively. To better visualize the interrelationships explained by the sources of variation presented by the factor vectors, the three eigenvectors are graphically represented in Figure 1. Factor 1 was responsible for explaining mainly the variability of ILW and FLW traits. Factor 2 explained the variability of ILW, FLW, ADG, BF, RF and LMA and factor 3 represented the WBSF trait.
Distinct groups of traits were observed within the data set, i.e., weight (ILW and FLW), lean growth (ADG and LMA) and fatness (BF and RF) traits. The WBSF trait did not correlate with any of the others, as can be seen in Figure 1.
In order to better demonstrate the relationships among traits, another multivariate analysis technique, canonical correlation analysis, was used. This technique generates new values (canonical eigenvalues) that best explain the correlations between all the traits and thus assists in the analysis of phenotypic correlations between the variables. The circles in the canonical correlation plot (Figure 2) show the major groupings that resulted.
Figure 2 - Graphical representation of the canonical correlation between growth (ILW, FLW, ADG), carcass (LMA, BF, RF) and tenderness (WBSF) traits
IWL: initial live weight, FLW: final live weight, ADG: average daily gain, LMA: longissimus muscle area, BF: backfat thickness at the 12th-13th rib, RF: rump fat thickness, WBSF: Warner-Bratzler shear force of the Longissimus dorsi
The canonical correlation analysis shows that the traits form two separate groups. The first includes ADG and fat thickness (BF and RF). The second group includes weight (ILW and FLW) and muscularity (LMA) traits. However, the WBSF trait did not group with any of the other studied features, confirming the results obtained in the previous analyses.
The variance components estimation for WBSF showed that this trait does not have significant values of additive genetic variance. This can be observed by the low additive genetic variance estimate (0.148) and the high residual (1.222) and phenotypic (1.370) variances presented. These values of direct additive genetic and phenotypic variances generated a heritability estimate
of 0.11 ± 0.022, suggesting that only 11% of the WBSF genes have direct additive genetic effects, while 89% of the effects that control this feature are present in the residue, this being composed of epistatic, dominance, genotype-environment interactions and environmental effects (Table 5).
Table 5 - Variance components and genetic parameters analysis of WBSF (Warner-Bratzler shear force) of the Longissimus dorsi of Polled Nellore cattle obtained from univariate analysis in animal model
Traits 2
a
2 e
2
p h
2
WBSF 0.148 1.222 1.370 0.11 (± 0.022)
WBSF: Warner-Bratzler shear force of the Longissimus dorsi beef;
2
a: additive genetic variance; 2
e: residual variance; 2
p: phenotypic variance; h²: heritability
The heritability value of WBSF in this study was
similar to that found by Elzoet al. (1998), who found
heritability of 0.17 for WBSF in Brahman animals and crosses. Smithet al. (2007) reported higher heritability
values for WBSF in Brahman cattle, obtaining estimates around 0.29. Clearly the heritability for meat tenderness can present substantial variation even among animals of the same breed. Other reports in the literature also demonstrate heritabilities ranging from low to high magnitude, whether within or between
breeds (BOUKHA et al., 2011; JOHNSTON et al.,
2003; MINICK et al., 2004). However, there are few
studies that are directly comparable with the results found in this study, because most of the research with
gene prospection of meat quality features refers toBos
taurus breeds and their crossbreds with Zebu cattle
(ELZOet al., 1998; JOHNSTONet al., 2003).
The genetic correlation estimates (Table 6) between the growth traits (ILW, FLW and ADG) and WBSF were negative and of low magnitudes (-0.15, -0.18 and -0.13, respectively), indicating that the selection for WBSF will
not influence directly the selection for weight and vice
versa. A negative and low magnitude (-0.12) correlation
also occurred between WBSF and fat thickness measured on the rump (RF), indicating that the joint selection for these traits will not influence their phenotypic expression.
tenderness, these results must be interpreted with caution due to the very large 95% confidence regions.
Genetic correlations between WBSF and carcass traits (BF and LMA) were also observed by Koch, Cundiff and Gregory (1982) who obtained a value of -0.01 for the genetic correlation between WBSF and BF, and a value of -0.02 between WBSF and LMA. Although these genetic correlations were negative, opposite to those obtained in this study, they were also of a very low magnitude, indicating that the selection for WBSF should not influence the selection for the mentioned carcass traits.
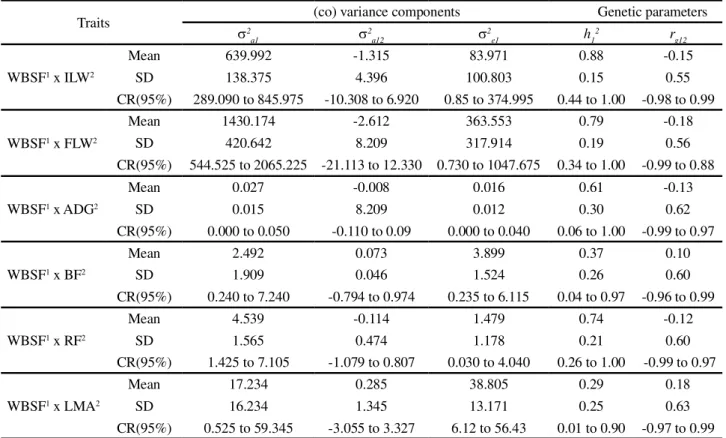
The heritability estimates (Table 7) obtained for the traits related to carcass quality by bivariate Bayesian
analysis, measured in vivo by ultrasound, were 0.29,
0.37 and 0.74 for LMA, BF and RF, respectively. These values can be considered from moderate (LMA and BF) to high (RF) magnitude, but the heritability estimates obtained in this study for the growth traits as ILW, FLW and ADG were of high magnitude, with values of
Traits (co) variance components Genetic parameters
2 a1
2 a12
2
e1 h1
2 r
g12
WBSF1 x ILW2
Mean 0.128 -1.315 1.238 0.09 -0.15
SD 0.122 4.396 0.136 0.09 0.55
CR(95%) 0.007 to 0.434 -10.308 to 6.920 0.931 to 1.493 0.01 to 0.32 -0.98 to 0.99
WBSF1 x FLW2
Mean 0.161 -2.612 1.218 0.11 -0.18
SD 0.176 8.209 0.162 0.11 0.56
CR(95%) 0.009 to 0.681 -21.113 to 12.330 0.823 to 1.476 0.01 to 0.45 -0.99 to 0.88
WBSF1 x ADG2
Mean 0.189 -0.008 1.196 0.13 -0.13
SD 0.176 8.209 0.168 0.12 0.62
CR(95%) 0.010 to 0.640 -0.110 to 0.09 0.830 to 1.480 0.01 to 0.42 -0.99 to 0.97
WBSF1 x BF2
Mean 0.190 0.073 1.211 0.12 0.10
SD 0.176 0.046 0.170 0.12 0.60
CR(95%) 0.009 to 0.621 -0.794 to 0.974 0.843 to 1.499 0.01 to 0.43 -0.96 to 0.99
WBSF1 x RF2
Mean 0.148 -0.114 1.229 0.11 -0.12
SD 0.143 0.474 0.145 0.10 0.60
CR(95%) 0.004 to 0.531 -1.079 to 0.807 0.894 to 1.482 0.01 to 0.37 -0.99 to 0.97
WBSF1 x LMA2 Mean 0.199 0.285 1.184 0.14 0.18
SD 0.217 1.345 0.187 0.14 0.63
CR(95%) 0.008 to 0.895 -3.055 to 3.327 0.637 to 1.479 0.01 to 0.54 -0.97 to 0.99
Table 6 - Descriptive statistics of the (co) variance components and heritability estimates and genetic correlations between WBSF and ILW, FLW, ADG, BF, RF and LMA traits, in Polled Nelore cattle, obtained from bivariate analyses in animal model
1: Warner-Bratzler shear force of the Longissimus dorsi (WBSF);2: initial live weight (ILW) , final live weight (FLW), average daily gain
(ADG), longissimus muscle area (LMA), backfat thickness at the 12th-13th rib (BF), rump fat thickness (RF); 2
a1: additive genetic variance of 1; 2
a12: additive genetic covariance between 1 and 2; 2
e1: residual variance of 1;h1
2: heritability of 1;r
g12: genetic correlation between 1 and 2; SD: standard deviation; CR: credibility region at 95%
0.88, 0.79 and 0.61, respectively. Literature values of heritabilities for weight, especially for yearling weight and weight gain, vary widely. Bergmann (2003) reported variation from 0.08 to 0.83 for direct heritability for yearling weight in studies with various breeds of beef cattle, and the author further stated that due to the great use of the trait as a selection criterion, several authors have been concerned with obtaining more accurate estimates of the genetic parameters.
The magnitudes of heritability presented by the studied traits show that these can be passed from one generation to the next, in other words, there may be genetic progress in applying the selection for the same. Thus, in a breeding program it will be possible to select and improve both carcass and / or growth traits as well as the tenderness trait, not through a correlated response, but rather due to the high heritabilities of the traits.
analyses presented here (Tables 6 and 7), such as the correlation between WBSF and the initial live weight (ILW). This credibility region at 95% (95% CR) ranged from -0.98 to 0.99, indicating that the analyzed parameter can assume any value within that range.
This high amplitude of the credibility region at 95% occurred with all analyzed parameters and may indicate that the collected data was insufficient to generate a more consistent analysis and further studies should be conducted to obtain a greater volume of information on the meat tenderness trait.
In general, when considering only the Zebu breeds, especially Nellore, studies addressing tenderness as an object of selection are rather scarce. However, experiments to evaluate this trait are of high cost and long duration, which further complicates large scale collection of tenderness data.
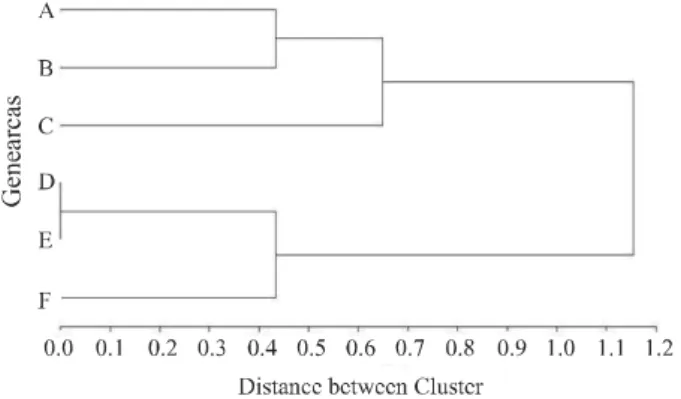
Using the animals’ genealogy information, it was possible to identify the Nellore breed founder animals, as described by Magnabosco, Cordeiro and Trovo (1997),
Table 7 - Descriptive statistics of the (co) variance components and heritability estimative and genetic correlation between ILW, FLW, ADG, BF, RF and LMA traits and the WBSF trait, in Polled Nelore cattle, obtained from bivariate analyses in animal model
Traits 2 (co) variance components Genetic parameters
a1
2 a12
2
e1 h1
2 r
g12
WBSF1 x ILW2
Mean 639.992 -1.315 83.971 0.88 -0.15
SD 138.375 4.396 100.803 0.15 0.55
CR(95%) 289.090 to 845.975 -10.308 to 6.920 0.85 to 374.995 0.44 to 1.00 -0.98 to 0.99
WBSF1 x FLW2
Mean 1430.174 -2.612 363.553 0.79 -0.18
SD 420.642 8.209 317.914 0.19 0.56
CR(95%) 544.525 to 2065.225 -21.113 to 12.330 0.730 to 1047.675 0.34 to 1.00 -0.99 to 0.88
WBSF1 x ADG2
Mean 0.027 -0.008 0.016 0.61 -0.13
SD 0.015 8.209 0.012 0.30 0.62
CR(95%) 0.000 to 0.050 -0.110 to 0.09 0.000 to 0.040 0.06 to 1.00 -0.99 to 0.97
WBSF1 x BF2
Mean 2.492 0.073 3.899 0.37 0.10
SD 1.909 0.046 1.524 0.26 0.60
CR(95%) 0.240 to 7.240 -0.794 to 0.974 0.235 to 6.115 0.04 to 0.97 -0.96 to 0.99
WBSF1 x RF2
Mean 4.539 -0.114 1.479 0.74 -0.12
SD 1.565 0.474 1.178 0.21 0.60
CR(95%) 1.425 to 7.105 -1.079 to 0.807 0.030 to 4.040 0.26 to 1.00 -0.99 to 0.97
WBSF1 x LMA2
Mean 17.234 0.285 38.805 0.29 0.18
SD 16.234 1.345 13.171 0.25 0.63
CR(95%) 0.525 to 59.345 -3.055 to 3.327 6.12 to 56.43 0.01 to 0.90 -0.97 to 0.99
1: Warner-Bratzler shear force of the Longissimus dorsi (WBSF);2: initial live weight (ILW) , final live weight (FLW), average daily gain (ADG),
longissimus muscle area (LMA), backfat thickness at the 12th-13th rib (BF), rump fat thickness (RF); 2
a1: additive genetic variance of 2; 2
a12:
additive genetic covariance between 1 and 2; 2
e1: residual variance of 2;h1
2: heritability of 2;r
g12: genetic correlation between 1 and 2; SD: standard
deviation; CR: credibility region at 95%
that had greater numbers of descendants in this population presenting high or low WBSF. This founder population with descendants that segregate for low WBSF are represented by the letters D, E and F, while the founders with descendants that segregate for high WBSF are represented by the letters A, B and C (Figure 3).
Although the founders of the studied population were separated into two groups considering the WBSF phenotype, it was observed that some bulls, descended from the same founder, had progeny that segregated for both tenderness phenotypes, in other words, these bulls had progeny who had low WBSF and also had progeny who had high WBSF. This phenotypic behavior can be explained by the low heritability for the meat tenderness trait in this study and several others reported
in the literature (BOUKHA et al., 2011; MINICK et
al., 2004).
Figure 3 - Distances between founders’ dendrogram according to the Warner-Bratzler shear force of the Longissimus dorsi of their respective progenies
who were more likely to be carriers of tenderness genes, considering that the analyses using Gaussian models in animal models and Bayesian perspective did not allow the prediction of breeding values for WBSF.
CONCLUSIONS
1. The estimates of (co) variance components and genetic parameters for meat tenderness indicated that most of the genes responsible for the meat tenderness trait (WBSF) have no direct additive genetic effect. The selection for meat tenderness in Polled Nellore will not affect the deposition of subcutaneous fat in the carcass nor the animals’ muscularity and
vice versa. Furthermore, the results of this study
also demonstrated no correlated response between tenderness and growth traits, such as weight and weight gain, indicating that joint selection for those traits will not influence phenotypic expression of tenderness;
2. Using pedigree information and according to the principle of probability of identical genes by descent, individuals who were more likely to be carriers of favorable genes for tenderness were identified. Further work will include creation of a segregating population that will serve as experimental material for future gene prospecting and identification research.
ACKNOWLEDGEMENTS
To Guaporé Pecuária S/A, owner of the OB brand, for providing the data of the OBChoice Program and for always supporting research and education
programs, and also to CNPq, Embrapa and Capes for the funding.
REFERENCES
BERGMANN, J. A. G. Objetivos e critérios de seleção.In: WORKSHOP SELEÇÃO EM BOVINOS DE CORTE, 4., 2003, Ribeirão Preto.Anais... Ribeirão Preto: ANCP, p.1-8, 2003. [Cd-rom].
BIANCHINI, W. et al. Efeito do grupo genético sobre as características de carcaça e maciez da carne fresca e maturada de bovinos superprecoces.Revista Brasileira de Zootecnia, v. 36, n. 6, p. 2109-2117, 2007.
BOLEMAN, S. J. et al. Consumer evaluation of beef of known categories of tenderness. Journal of Animal Science, Champaign, v. 75, n. 6, p. 1521-1524, 1997.
BOUKHA, A. et al. Genetic parameters of carcass and meat quality traits of double muscled Piemontese cattle.Meat Science, v. 89, p. 84-90, 2011.
BOUQUET, A. et al. Genetic parameters for growth, muscularity, feed efficiency and carcass traits of young beef bulls.Livestock Science, v. 129, p. 38-48, 2010.
COSTA, M. A. L. et al. Desempenho, digestibilidade e características de carcaça de novilhos zebuínos alimentados com dietas contendo diferentes níveis de concentrado.Revista Brasileira de Zootecnia, v. 34, n. 1, p. 268-279, 2005. ELZO, M. A.et al. Genetic variation and prediction of additive and nonadditive genetic effects for six carcass traits in an Angus-Brahman multibreed herd.Journal of Animal Science, v. 76, n. 7, p. 1810-1823, 1998.
FERRAZ, J. B. S.; ELER, J. P. Parceria público x privada no desenvolvimento de pesquisa em melhoramento genético animal.Revista Brasileira de Zootecnia, v. 39, suppl. spe, p. 216-222, 2010.
HAIR, J. F.et al.Análise multivariada de dados. 5. Ed. Porto Alegre: Bookman, 2005. 593p.
HERD, R.M.; ARCHER, J.A.; ARTHUR, P.F. Steers growth and feed efficiency on pasture are favourably associated with genetic variation in sire net feed intake.Animal Production in Australia, v. 25, p. 93-96, 2004.
HOQUE, M. A. et al. Genetic parameters for measures of residual feed intake and growth traits in seven generations of Duroc pigs.Livestock Science. v. 121, p. 45-49, 2009. IBGE - Instituto Brasileiro De Geografia e Estatística.Produção da pecuária municipal - PPM 2010, 2011. Disponível em: <http://www.ibge.gov.br>. Acesso em: 20 jan. 2012.
from temperate and tropically adapted beef breeds. 3. Meat quality traits.Australian Journal of Agricultural Research, v. 54, p. 135-147, 2003.
KOCH, R. M.; CUNDIFF, L. V.; GREGORY, K. E. Heritabilities and genetic, environmental and phenotypic correlations of carcass traits in a population of diverse biological types and their implications in selection programs. Journal of Animal Science, v. 55, n. 6, p. 1319-1329, 1982. LACY, R. C. Analysis of founder representation in pedigrees: Founder equivalents and founder genome equivalents. Zoo Biology, v. 8, p. 111-123, 1989.
LAGE, J. F. et al. Influence of genetic type and level of concentrate in the finishing diet on carcass and meat quality traits in beef heifers.Meat Science, v. 90, p. 770-774, 2012. LANCASTER, P.A.et al. Phenotypic and genetic relationships of residual feed intake with performance and ultrasound carcass traits in Brangus heifers.Journal of Animal Science, v. 87, n. 12, p. 3887-3896, 2009.
LOPES, F. B. et al. Ajustes de curvas de crescimento em bovinos Nelore da região Norte do Brasil.Revista Brasileira de Saúde e Produção Animal, v. 12, n. 3, p. 607-617, 2011. LOPES, F. B. et al. Tendência genética para características relacionadas a velocidade de crescimento em bovinos Nelore da região Norte do Brasil.Revista Ciência Agronômica, v. 43, n. 2, p. 362-367, 2012.
MAGNABOSCO, C. U.; CORDEIRO, C. M. T.; TROVO, J. B.Catálogo de linhagens do germoplasma zebuíno: raça Nelore.Brasília: Embrapa - Cenargen, 52p., 1997.
MINICK, J. A. et al. Heritability and correlation estimates of Warner-Bratzler shear force and carcass traits from Angus, Charolais, Hereford, and Simmental-sired cattle. Canadian Journal of Animal Science, v. 84, p. 599-609, 2004.
O’CONNOR, S.F.; TATUM, J.D.; WULF, D.M. Genetics effects on beef tenderness in Bos indicus composite and Bos taurus cattle.Journal of Animal Science, v.75, n.7, p. 1822-1830, 1997.
PARDI, M. C.et al.Ciência, higiene e tecnologia da carne. 2. Ed. UFG, 2005. 623p.
RAZOOK, A. G. et al.Efeitos de raça e da seleção para peso pós-desmame sobre características de confinamento e de carcaça da 15ª progênie dos rebanhos zebu e caracu de sertãozinho.Revista Brasileira de Zootecnia, v. 30, n. 1, p. 115-124, 2001.
ROBINSON, D. L.; ODDY, V. H. Genetics parameters for feed efficiency, fatness, muscle area, and feeding behavior of feedlot finished beef cattle.Livestock Production Science, v. 90, p. 255-270, 2004.
RUBIANO, G. A. G. et al. Desempenho, características de carcaça e qualidade da carne de bovinos superprecoces das raças Canchim, Nelore e seus mestiços.Revista Brasileira de Zootecnia, v. 38, n. 12, p. 2490-2498, 2009.
RODRIGUES, E. et al. Crescimento dos tecidos muscular e adiposo de fêmeas bovinas de diferentes grupos genéticos no modelo biológico superprecoce. Revista Brasileira de Zootecnia, v. 39, n. 3, p. 625-632, 2010.
SAINZ, R. D. et al. Projeto OB-Choice: genética para melhorar a qualidade da carne brasileira. In: CONGRESSO BRASILEIRO DE CIÊNCIA E TECNOLOGIA DE CARNES, 3., 2005, São Pedro.Anais... São Pedro: CTC, p. 265, 2005. SANTOS, G. C. J. et al. Tendência genética para pesos padronizados aos 205, 365 e 550 dias de idade de bovinos nelore da região Norte do Brasil.Acta Scientiarum. Animal Sciences, v. 34, p. 97-101, 2012.
SAS INSTITUTE INC.SAS onlineDOC®9.1.3, Cary, NC. 2004.
SILVA, S. L. et al. Estimativa da gordura de cobertura ao abate, por ultra-som, em tourinhos Brangus e Nelore.Revista Brasileira de Zootecnia, v. 33, n. 2, p. 511-517, 2004.
SMITH, T. et al. Genetic parameters for growth and carcass traits of Brahman steers.Journal of Animal Science,v. 85, n. 6, p. 1377-1384, 2007.
SOUZA, J. C. et al. Tendências ambientais e genéticas para características produtivas de bovinos da raça Nelore. Archivos Latino americanos de Producción Animal, v. 16, n. 2, p. 85-90, 2008.
USDA - United States Department of Agricultural.Livestock and Poltry: World Markets and Trade. Disponível em: http://www.usda.gov. Acesso em: 19/12/2013.
VAN KAAM, J.Gibanal - Analyzing program for Markov Chain Monte Carlo sequences.Version 2.4, Department of Animal Breeding, Wageningen-Netherlands, 1997.
VAN TASSELL, C. P.; VAN VLECK, L. D. Multiple-trait Gibbs sampler for animal models: flexible programs for Bayesian and likelihood-based (co)variance component inference.Journal of Animal Science, v. 74, n.11, p. 2586-2597, 1996.
WHEELER, T. L.; CUNDIFF, L. V.; SHACKELFORD, S. D.; KOOHMARAIE, M. Characterization of biological types of cattle (Cycle VII): Carcass, yield, and longissimus palatability traits.Journal of Animal Science, Champaign, v. 83, n. 1, p. 196-207, 2005.