NHESSD
3, 955–992, 2015Harbour agitation under climate change
J. P. Sierra et al.
Title Page
Abstract Introduction
Conclusions References
Tables Figures
◭ ◮
◭ ◮
Back Close
Full Screen / Esc
Printer-friendly Version Interactive Discussion
Discussion
P
a
per
|
Discussion
P
a
per
|
Discussion
P
a
per
|
Discussion
P
a
per
|
Nat. Hazards Earth Syst. Sci. Discuss., 3, 955–992, 2015 www.nat-hazards-earth-syst-sci-discuss.net/3/955/2015/ doi:10.5194/nhessd-3-955-2015
© Author(s) 2015. CC Attribution 3.0 License.
This discussion paper is/has been under review for the journal Natural Hazards and Earth System Sciences (NHESS). Please refer to the corresponding final paper in NHESS if available.
Projected impact on wave-driven harbour
agitation due to climate change –
application to the Catalan ports
J. P. Sierra1,2, M. Casas-Prat1,2,*, M. Virgili1, C. Mösso1,2, and A. Sánchez-Arcilla1,2
1
Laboratori d’Enginyeria Marítima, Universitat Politècnica de Catalunya BarcelonaTech, Jordi Girona 1–3, Mòdul D1, Campus Nord, 08003 Barcelona, Catalonia, Spain
2
Centre Internacional d’Investigació dels Recursos Costaners (CIIRC), Jordi Girona 1–3, Mòdul D1, Campus Nord, 08003 Barcelona, Catalonia, Spain
*
now at: Environment Canada, Science and Technology Branch, Toronto, Canada
Received: 15 December 2014 – Accepted: 19 January 2015 – Published: 4 February 2015 Correspondence to: J. P. Sierra ([email protected])
NHESSD
3, 955–992, 2015Harbour agitation under climate change
J. P. Sierra et al.
Title Page
Abstract Introduction
Conclusions References
Tables Figures
◭ ◮
◭ ◮
Back Close
Full Screen / Esc
Printer-friendly Version Interactive Discussion
Discussion
P
a
per
|
Discussion
P
a
per
|
Discussion
P
a
per
|
Discussion
P
a
per
Abstract
The objective of the present work is to analyse how changes in wave patterns due to the effect of climate change can affect harbour agitation (oscillations within the port due to wind waves). The study focuses on 13 harbours located on the Catalan coast (NW Mediterranean) using a methodology with general applicability. To obtain the
pat-5
terns of agitation, a Boussinesq-type model is used, which is forced at the boundaries by present/future offshore wave conditions extracted from recently developed high-resolution wave projections in the NW Mediterranean. These wave projections were ob-tained with the SWAN model forced by present/future surface wind fields projected, re-spectively, by 5 different combinations of global and regional circulation models (GCMs
10
and RCMs) for the A1B scenario. The results show a general slight reduction in the annual average agitation for most of the ports, except for the northernmost and south-ernmost areas of the region, where a slight increase is obtained. A seasonal analysis reveals that the tendency to decrease is accentuated in winter. However, the inter-model variability is large for both the winter and the annual analysis and many ports
15
present at least one model configuration showing a rise in the agitation. Conversely, a general increase is found during summer, which is the period with greater activity in most of the studied ports (marinas). The latter result is more consistent among models, which illustrates the lower inter-model variability in summer.
1 Introduction
20
Climate change has become a major focus of attention because of its potential haz-ards and impacts on our environment in the near future. In coastal areas, vulnerabil-ity assessments focus mainly on sea level rise (SLR). Other nonclimatic drivers (e.g. socioeconomic change) that can significantly interact with climate change are often ig-nored, despite being essential for climate and coastal management policy development
25
NHESSD
3, 955–992, 2015Harbour agitation under climate change
J. P. Sierra et al.
Title Page
Abstract Introduction
Conclusions References
Tables Figures
◭ ◮
◭ ◮
Back Close
Full Screen / Esc
Printer-friendly Version Interactive Discussion
Discussion
P
a
per
|
Discussion
P
a
per
|
Discussion
P
a
per
|
Discussion
P
a
per
|
coastal communities being affected by climate change. The greenhouse effect and the complex interactions of atmospheric processes may produce changes in near-surface wind and pressure patterns, potentially affecting the wave field (e.g. Bengtsson et al., 2006; Weisse and von Storch, 2010), which is another important coastal driver. Indeed, changes in ocean wave climate have been reported in numerous studies (e.g. Aumann
5
et al., 2008; Wang et al., 2009) suggesting that the number, intensity and location of storms will be modified (e.g. Wang et al., 2004; Leckebusch and Ulbrich, 2004; Lionello et al., 2008).
The aforementioned changes in wave conditions would affect harbour agitation in several ways. Variations in wave height would directly modify the amount of energy
10
penetrating into harbours. Changes in wave period or direction would also affect prop-agation processes such as shoaling, refraction and diffraction. Therefore they could in-duce changes in sediment transport patterns (potentially generating siltation) or wave penetration into harbours (Sierra and Casas-Prat, 2014), which, in turn, would affect port operability. The activities in the harbour areas are strongly dependent on wave
15
conditions, especially in relationship with the entrance and exit of the ships in safe con-ditions, but also for the regular harbour operations (Rusu and Guedes Soares, 2013), including ship mooring and cargo loading/unloading.
This study aims to assess the impact on harbour agitation focusing on several har-bours located on the Catalan coast (NW Mediterranean Sea). This issue was
pre-20
viously analysed for few Catalan ports by Casas-Prat and Sierra (2010, 2012) who raised awareness by showing a tendency of harbour agitation to increase. However, their results were based on trend analysis, which is a simple and non-computationally technique that can only be used to provide a preliminary assessment because it does not consider explicitly the greenhouse scenarios and because it assumes that the
ob-25
NHESSD
3, 955–992, 2015Harbour agitation under climate change
J. P. Sierra et al.
Title Page
Abstract Introduction
Conclusions References
Tables Figures
◭ ◮
◭ ◮
Back Close
Full Screen / Esc
Printer-friendly Version Interactive Discussion
Discussion
P
a
per
|
Discussion
P
a
per
|
Discussion
P
a
per
|
Discussion
P
a
per
circulation models (RCMs), one of them being forced by two different global circulation models (GCMs). Having different GCM-RCM combinations will also allow to inspect the inter-model variability in terms of the impact on harbour agitation. As pointed out by Casas-Prat et al. (2015) for the case of sediment transport, it is not trivial how inter-model variability translates from the wave field to the wave-driven impacts.
5
In this paper only variations in wave climate are taken into account, assuming that the sea level does not change. Obviously, potential changes in sea level in this area would give rise to additional variations in the agitation pattern within the harbours, but these impacts are out of the scope of this paper, which only focuses on the affectation caused by changes on wave patterns due to climate change.
10
The rest of the manuscript is structured as follows. In Sect. 2 the study area is de-scribed. In Sect. 3 the materials and methods are explained. In Sect. 4 the results are presented and discussed. Finally, in Sect. 5 the conclusions of this work are presented.
2 Study area
The Catalan coast, which is about 700 km long, is located in the north-western
Mediter-15
ranean from latitude 40◦45′to 42◦25′N and from longitude 0◦45′to 3◦15′E. This area is
a microtidal environment, with mixed tides predominantly semidiurnal and tidal ranges of about 20 cm.
Some environmental properties of the NW Mediterranean are highly conditioned by its semi-enclosed character. It features local high and low atmospheric pressure
sys-20
tems controlled by orographic barriers like the Pyrenees, which determine the spatial distribution of winds and, therefore, the wave field. In terms of intensity, wind climate is characterized by low to medium average winds, but some extreme synoptic events occur (Sanchez-Arcilla et al., 2008).
The directional distribution of waves along the coast shows a predominance of NW
25
NHESSD
3, 955–992, 2015Harbour agitation under climate change
J. P. Sierra et al.
Title Page
Abstract Introduction
Conclusions References
Tables Figures
◭ ◮
◭ ◮
Back Close
Full Screen / Esc
Printer-friendly Version Interactive Discussion
Discussion
P
a
per
|
Discussion
P
a
per
|
Discussion
P
a
per
|
Discussion
P
a
per
|
the E or E-NE, where the largest fetches and stronger winds coincide (Sanchez-Arcilla et al., 2008).
In Catalonia, there are 47 seaports, 2 are large commercial ports (Barcelona and Tarragona), 3 small commercial (with facilities for leisure and fishing boats), 2 industrial, 18 mixed (fishing and leisure) and 22 marinas. In this paper, only 13 of them are studied
5
due to the availability of detailed current lay-outs and bathymetries within the harbours. The location of the 13 selected ports is detailed in Fig. 1, showing that the 2 largest ports (Barcelona, num. 4, and Tarragona, num. 9) are included.
3 Material and methods
3.1 Wave data
10
As mentioned in the Introduction, the high spatial (0.125◦) and temporal (3 h) resolution
wave projections developed by Casas-Prat and Sierra (2013) have been used in this study to evaluate the impact on harbour agitation. They were obtained with the SWAN wave model (Booij et al., 1999) forced by winds generated with 5 combinations of global (GCMs) and regional circulation models (RCMs) considering the A1B scenario of the
15
4th Assessment Report from IPCC (2007). The wave data sets (and their correspond-ing simulations) will be named as in Casas-Prat and Sierra (2013), with acronyms relative to the combination of RCM and GCM used for their obtaining: HIR_E (RCM: HIRHAM5, GCM: ECHAM5), RAC_E (RCM: RACMO2, GCM: ECHAM5), REM_E (RCM: REMO, GCM: ECHAM5), RCA_E (RCM: RCA3, GCM: ECHAM5) and RCA_H
20
(RCM: RCA3, GCM: HadCM3Q3). These atmospheric projections were developed and provided by, respectively: DMI (Danmarks Meteorologiske Institut, Denmark), KNMI (Koninklijk Nederlands Meteorologisch Instituut, the Netherlands), MPI (Max-Planck-Institut für Meteorologie, Germany) and SMHI (Sveriges Meteorologiska och Hydrolo-giska Institut, Sweden), the latter providing the last two sets of atmospheric data. For
25
NHESSD
3, 955–992, 2015Harbour agitation under climate change
J. P. Sierra et al.
Title Page
Abstract Introduction
Conclusions References
Tables Figures
◭ ◮
◭ ◮
Back Close
Full Screen / Esc
Printer-friendly Version Interactive Discussion
Discussion
P
a
per
|
Discussion
P
a
per
|
Discussion
P
a
per
|
Discussion
P
a
per
climate: 1971–2000 for the “present” and 2071–2100 for the “future”. Please refer to Casas-Prat and Sierra (2013) for further details.
The aforementioned wave projections at the cell grid closest to each harbour provide therefore the offshore wave conditions for the current study. In the following Sect. 3.2 it is described how these wave patterns are propagated towards the inside of the selected
5
harbours.
3.2 Methodology
Boussinesq-type models have been widely used for simulating both wind-wave and long-wave propagation (e.g. Madsen et al., 1997; Bingham, 2000; Nadaoka and Raveenthiran, 2002). As pointed out by Rusu and Guedes Soares (2011), in the
har-10
bour areas the higher resolution phase resolving models, based either on the mild slope equation or on the Boussinesq equations can give a realistic picture on the wave pen-etration inside the harbour areas and on some specific processes such as the harbour oscillations.
In this paper, we utilize a Boussinesq-type model to simulate the wave propagation
15
within the harbours, as used in previous works (González-Marco et al., 2008; Casas-Prat and Sierra, 2010, 2012). We use a model configuration that was validated with wave records obtained from 3 wave sensors deployed during a 1 year campaign in 2012 in the Port Fòrum (num. 3 in Fig. 1). The simulated significant wave height (Hs)
inside that harbour showed a root mean absolute error between 20 and 30 %, which
20
is reasonably good taking into account the low average of Hs at these inner points (between 0.10 and 0.22 m).
The offshore wave conditions affecting each harbour are given by the wave projec-tions described in the previous Sect. 3.1 at the closest grid point. Instead of directly propagating the whole 30 year wave time series, a wave regime characterization is
25
previously carried out. The data are grouped in eight 45◦ directional sectors (N, NE, E,
NHESSD
3, 955–992, 2015Harbour agitation under climate change
J. P. Sierra et al.
Title Page
Abstract Introduction
Conclusions References
Tables Figures
◭ ◮
◭ ◮
Back Close
Full Screen / Esc
Printer-friendly Version Interactive Discussion
Discussion
P
a
per
|
Discussion
P
a
per
|
Discussion
P
a
per
|
Discussion
P
a
per
|
is computed. Additionally, representative wave parameters are assigned to each group. ForHsand direction, the central value of each bin is considered, with the exception of the largest group, for which a representative value of 5 m is used. The representative wave period is obtained through Eq. (1):
Tp=aHsb (1)
5
whereTpis the peak period anda,bare two coefficients fitted to each wave projection
dataset. The representative wave parameters thus obtained are representative of the deep/intermediate water conditions at the corresponding node location. To propagate these wave conditions to the boundaries of the aforementioned Boussinesq-model do-main, the linear theory is employed. This simple approach introduces a certain error
10
and, therefore, a limitation in the analysis, but it has been followed due to the lack of detailed bathymetries outside the harbours. Note that only those wave groups with a wave direction capable to enter the port are propagated and used afterwards.
In summary, the following methodological steps are carried out to evaluate the impact on harbour agitation
15
– For each port, selection of thenwave directions capable to enter the port.
– For each selected direction, computation of the wave periods associated to the five representative wave heightsHs=[0.5, 1.5, 2.5, 3.5 and 5] m under present
and future conditions, for each model data set (5 models).
– Wave propagation using linear theory of the 25nwave classes (5 wave heights×n
20
directions×5 models) for present and future conditions from the closest wave grid
point (of the wave fields described in Sect. 3.1) to the outer limit of the Boussinesq-model domain. Note that the range ofHsand wave directions are always the same
butTpmay be different for present and future and for each model.
– Simulation of the propagation of each 50n(5 waves heights×ndirections×2 time
25
spans – present and future –×5 models) wave class within the harbour using the
NHESSD
3, 955–992, 2015Harbour agitation under climate change
J. P. Sierra et al.
Title Page
Abstract Introduction
Conclusions References
Tables Figures
◭ ◮
◭ ◮
Back Close
Full Screen / Esc
Printer-friendly Version Interactive Discussion
Discussion
P
a
per
|
Discussion
P
a
per
|
Discussion
P
a
per
|
Discussion
P
a
per
– Computation of the annual Hs within the harbour (at each grid point) for present and future conditions (and for each model) by multiplying the Hs obtained in
each simulation by its frequency of occurrence and adding the values of all wave classes. The same for winter and summer periods to obtain seasonal averages.
– Computation of the annual/seasonal spatial averagedHs (spatial average of
val-5
ues at all grid points within the harbour) for each port, model and time span.
– Computation of the ensemble of the annual/seasonal Hs and that of the spatial
averaged Hs (averaging over the 5 model simulations) for each port and time span.
4 Results and discussion
10
This section presents and discusses the results obtained following the methodology described in Sect. 3.1, separating the annual and seasonal analysis, respectively, in Sects. 4.1 and 4.2.
4.1 Annual analysis
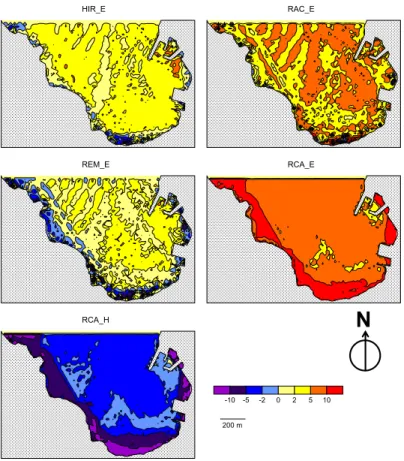
Due to the huge amount of simulations carried out, the results are presented in an
15
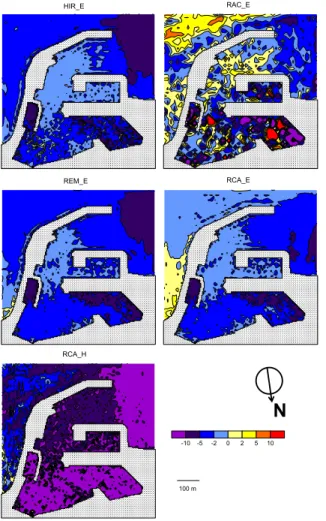
integrated way as maps for each port, illustrating for each RCM-GCM combination, the variation (in percentage) of the (annual)Hsbetween future and present conditions.
Positive values indicate that future waves will be higher while negative values denote shorter future waves.
Figure 2 shows the results corresponding to Port de la Selva, which is the
north-20
ernmost port of Catalonia included in this study (num. 1 in Fig. 1). 2 models (HIR_E and REM_E) show small variations ofHs within the harbour (less than 5 %) prevailing
the areas whereHsincreases in the future. Greater differences can be appreciated for
NHESSD
3, 955–992, 2015Harbour agitation under climate change
J. P. Sierra et al.
Title Page
Abstract Introduction
Conclusions References
Tables Figures
◭ ◮
◭ ◮
Back Close
Full Screen / Esc
Printer-friendly Version Interactive Discussion
Discussion
P
a
per
|
Discussion
P
a
per
|
Discussion
P
a
per
|
Discussion
P
a
per
|
the last one. The ensemble of the spatial averagedHsshows an increase of harbour ag-itation, being in agreement the spatial averagedHs associated to 4 models (maximum
rise of 8.04 % obtained by RCA_E, and minimum of+1.45 %, obtained by REM_E). In contrast, RCA_H shows a decrease in the spatial average of−4.47 %. Therefore, in this
case the ensemble of the 5 models should be used with caution because it masks two
5
tendencies: increase (HIR_E, RAC_E, REM_E and RCA_E) vs. decrease (RCA_H). In Fig. 3 the results corresponding to Arenys de Mar Port (num. 2 in Fig. 1) are plotted. In this case, the 5 models predict a reduction ofHswithin the port in the future,
although for model RAC_E there are increases in certain areas. However, the latter seems to be affected by numerical noise giving low reliability to the corresponding high
10
variability. This strange behaviour is probably due to low values of annualHswithin the harbour for present and future conditions, so that very close values lead to oscillations in the sign of changes. Like in Port de la Selva (Fig. 2), the more outstanding simulation is that of RCA_H having a decrease of the globalHs of−11.13 % (whereas it ranges from−2.00 to−2.81 % for the rest of the other four model configurations).
15
Figure 4 shows the results for Port Fòrum (num. 3 in Fig. 1). In this case the models offer different trends, with two models (HIR_E and REM_E) projecting future decreases ofHsin all the port, while the other 3 have areas whereHsdecreases and areas where
it increases. For the spatial averagedHs, four models predict decreases (ranging from −3.37 to−0.17 %) and one an increase of 1.16 % (RAC_E).
20
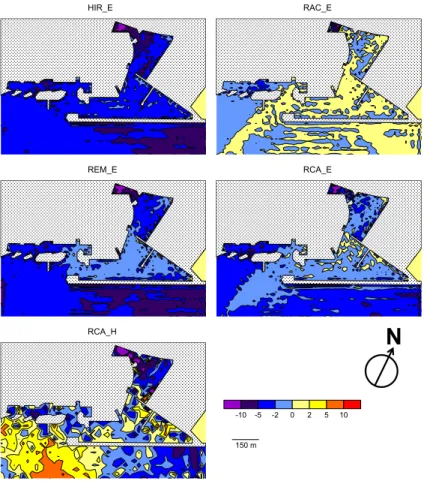
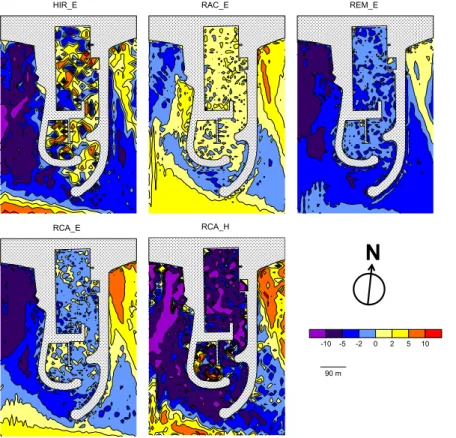
In Fig. 5, we can see the results for the port of Barcelona (num. 4 in Fig. 1), the largest harbour and the main commercial port of this region. The port has two accesses since a second mouth was opened to facilitate the entry and exit of small crafts and cruises. In this case, there are 3 models (HIR_E, REM_E and RAC_H) that project lower future spatial averagedHs (between −2.18 and −4.84 %), however close to the
25
NHESSD
3, 955–992, 2015Harbour agitation under climate change
J. P. Sierra et al.
Title Page
Abstract Introduction
Conclusions References
Tables Figures
◭ ◮
◭ ◮
Back Close
Full Screen / Esc
Printer-friendly Version Interactive Discussion
Discussion
P
a
per
|
Discussion
P
a
per
|
Discussion
P
a
per
|
Discussion
P
a
per
for RCA_E) but is important to notice that RCA_E projects increases ofHsgreater than 10 % in certain areas of the port.
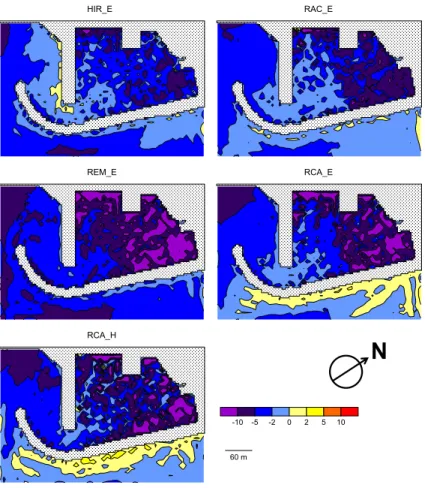
Contrary to the previous ports, the projections for the Garraf Marina (Fig. 6) do not present a significant inter-model variability since the five models show the same trend: decreases of futureHswithin all the port, with reductions greater than 10 % in some
ar-5
eas. The variation of the spatial averagedHsranges from−0.95 % (RAC_E) to−5.31 %
(REM_E), being the ensemble equal to−2.67 %. Since all the models show a similar
pattern, the ensemble average is a more representative value of the impact on harbour agitation for this port.
Figure 7 presents the agitation results for Vilanova i la Geltrú Port (num. 6 in Fig. 1).
10
As for the nearby Garraf Marina site (Fig. 6), in this port the five models show the same trend: a future decrease of theHs in all the harbour, with a higher magnitude for
RCA_H. All the models foreseeHs decreases greater than 10 % at the inner parts of
the port. The spatial averagedHschange ranges from−3.58 % for HIR_E to−12.92 % for RCA_H, with a predicted ensemble of−7.54 %.
15
In Fig. 8 we can see the differences between future and present Hs for the Segur
de Calafell Marina (num. 7 in Fig. 1). In this case, three models project agitation de-creases, although in two of them (RCA_E and RCA_H) there are points where Hs
increases. In these three models the variation range is−0.59 % (RCA_E) to −6.57 %
(RCA_H). In the other 2 models (RAC_E and HIR_E) the areas whereHs increases
20
are greater than those where Hs decreases, showing a trend to higher waves in
av-erage (0.82 and 0.48 % respectively). The higher inter-model variability of this marina compared to the previous analysed (nearby) port might be attributable to the notable different port layout, that could contribute to enhance such variability.
In the Torredembarra Port (num. 8 in Fig. 1), the models also project different
be-25
haviours (Fig. 9). For two models (HIR_E and RCA_E) most of the port experiences a slight increase ofHsin the future, with a spatial average that grows 1.10 and 0.85 %
respectively. For model REM_E, Hs decreases at all the port (−2.23 % in average),
NHESSD
3, 955–992, 2015Harbour agitation under climate change
J. P. Sierra et al.
Title Page
Abstract Introduction
Conclusions References
Tables Figures
◭ ◮
◭ ◮
Back Close
Full Screen / Esc
Printer-friendly Version Interactive Discussion
Discussion
P
a
per
|
Discussion
P
a
per
|
Discussion
P
a
per
|
Discussion
P
a
per
|
where Hs increases, presenting a decrease of the spatial averaged Hs (−0.55 and −1.76 % respectively).
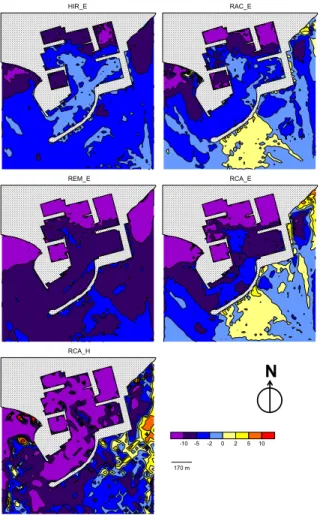
Model results for Tarragona Port, the second largest port in this area (num. 9 in Fig. 1) are plotted in Fig. 10. For three models (HIR_E, REM_E and RCA_E) the pro-jected future wave height is lower than the present one at almost all the port, with the
5
spatial averaged Hs varying between −2.85 and −5.29 %. One of the other models
(RAC_H) shows a similar behaviour but in this case there is a relatively large area whereHs increases (although slightly, with a rise lower than 5 %), being the change of
the spatial averagedHs of−1.35 %. The remaining RCM-GCM combination (RAC_E)
gives a greater futureHsat most of the port, with a spatial average increase of 1.22 %.
10
In Fig. 11 the agitation maps for Cambrils port are shown (port num. 10 in Fig. 1). In this case, four models coincide in the projected trend, predicting decreases of the spatial averagedHsfrom−3.33 % for model REM_E to−6.45 % for model RCA_E with
an ensemble average of−3.77 %. However, there is an area attached to the counter-dike (whose extension depends on the model) with consistent slight increases for all
15
RCM-GCM combinations. The remaining model (RAC_E) follows a curious behaviour with about half of the harbour (close the port mouth) experiencing higher future waves, while the inner half shows lower future waves. The spatial average balances both types of responses giving a value close to 0. This shows that the spatial averages sometimes can be a little “tricky” because they can mask opposite behaviours.
20
In Fig. 12 we can see the variations associated to L’Hospitalet de l’Infant Marina (num. 11 in Fig. 1). At this port, three of the models (HIR_E, RAC_E and REM_E) give a clear tend to increase agitation in the future, although there are points (in particular in the area attached to the largest dock) where futureHsdecreases. Global averageHs
ranges between 1.12 and 3.74 %. On the contrary, the other 2 models have a spatial
25
averaged decrease of−2.67 % (RCA_E) and−2.08 % (RCA_H), but showing opposite
NHESSD
3, 955–992, 2015Harbour agitation under climate change
J. P. Sierra et al.
Title Page
Abstract Introduction
Conclusions References
Tables Figures
◭ ◮
◭ ◮
Back Close
Full Screen / Esc
Printer-friendly Version Interactive Discussion
Discussion
P
a
per
|
Discussion
P
a
per
|
Discussion
P
a
per
|
Discussion
P
a
per
The results for L’Ametlla de Mar Port (num. 12 in Fig. 1) are plotted in Fig. 13. In this port the five models consistently project future increases of the spatial averaged Hs
within the port, with four of them predicting changes greater than 7 % (between+7.29 % for HIR_E and+9.60 % for RCA_E) and only one giving lower increases (REM_E with
+2.61 %). Although the areas with higher future Hs prevail in the five cases, there are
5
large areas with opposite results, in particular in the case of REM_E model, which is the one giving lower variation in the spatial average.
Cases d’Alcanar (num. 13 in Fig. 1) is the southernmost port of Catalonia and the results corresponding to this case are displayed in Fig. 14. In this case four models predict increases of the future average agitation within the harbour (between 2.68 % for
10
HIR_E and 5.59 % for RCA_E) while the remaining model gives negligible variations (−0.27 %) due to the fact that about half of the port experiences slight increases of
futureHs (up to 5 %) whereas the other half behaves oppositely.
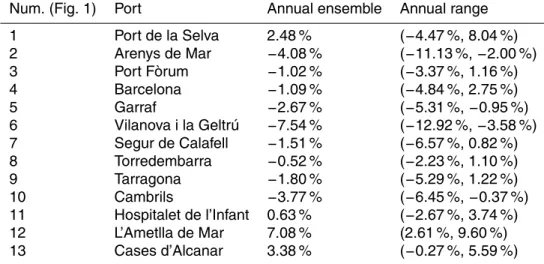
With the aim to try to derive concluding patterns of change at the 13 studied ports, Table 1 summarizes the variation of the ensemble of the spatial averaged Hs, also
15
including the range of variation considering the 5 models individually. We can see that consistent increases of future agitation are concentrated in the northernmost and southernmost ports (point 1 and 11 to 13 in Fig. 1), while in the central part of the region (points 2 to 10 in Fig. 1) there is a general tendency of futureHsto decrease. However,
as many ports have opposite projected patterns the ensemble of the spatial average
20
should be used with caution. Indeed, from the 13 harbours analysed, in only 5 cases the five models give the same trend (i.e. all of them project increases or decreases). In 4 cases four models predict the same trend (increase or decrease) and the fifth shows an opposite tendency. And, finally, in 4 cases three models make predictions in one way and, the other two, in the opposite direction. It is interesting to notice though,
25
that in most of these cases with different projected patterns, those models showing an opposite trend to that of the majority, project small changes (<5 %).
NHESSD
3, 955–992, 2015Harbour agitation under climate change
J. P. Sierra et al.
Title Page
Abstract Introduction
Conclusions References
Tables Figures
◭ ◮
◭ ◮
Back Close
Full Screen / Esc
Printer-friendly Version Interactive Discussion
Discussion
P
a
per
|
Discussion
P
a
per
|
Discussion
P
a
per
|
Discussion
P
a
per
|
−1.80 % respectively). Nevertheless, in the case of Barcelona two opposite behaviours
can be observed since two models project increases of the averageHs (RAC_E with +2.25 % and RCA_E with+2.75 %) and three decreases (from−2.18 % for HIR_E to −4.84 % for RCA_H). In the case of Tarragona, the majority of the models (4 out of 5)
give spatial averagedHsdecreases in the future (from−1.35 % for RCA_H to−5.29 %
5
for HIR_E) and only one model predict a future increase of the spatial averaged Hs
(RAC_E with+1.22 %). In addition, in the case of Barcelona, the two models predicting a general rise foresee wide areas whereHs increases more than 10 %. This situation
could generate operability problems in this port. In the case of Tarragona, the maximum expected increases are between 5 and 10 % and only in a small area and for a single
10
model.
Finally, to get deeper insight into the analysis of the aforementioned results, we try to relate the projected variations in harbour agitation with the patterns of change of the wave climate while discussing the resulting inter-model variability.
Casas-Prat and Sierra (2013) obtained two distinct patterns of response in winter
15
(the most energetic season) as a function of the GCM (i.e. HIR_E, RAC_E, REM_E, RCA_E vs. RCA_H), especially in respect to the changes in the mean wave direction. This dual response is only clearly appreciated in the two northernmost ports, indicating the larger complexity of the inter-model variability in terms of harbour agitation. In Port de la Selva (Fig. 2), for example, the clear reduction of the frequency of occurrence
20
associated to N events associated to RCA_H during winter can explain the marked reduction in harbour agitation during this season for this port, which is mainly affected by N events. In the case of Arenys de Mar (Fig. 3), the larger decrease for RCA_H model could be explained by the fact that this model configuration projected a decrease during (the most energetic) winter season of the occurrence of SE-S waves (those more
25
effective in penetrating the port).
NHESSD
3, 955–992, 2015Harbour agitation under climate change
J. P. Sierra et al.
Title Page
Abstract Introduction
Conclusions References
Tables Figures
◭ ◮
◭ ◮
Back Close
Full Screen / Esc
Printer-friendly Version Interactive Discussion
Discussion
P
a
per
|
Discussion
P
a
per
|
Discussion
P
a
per
|
Discussion
P
a
per
and RCA_E in Port de la Selva (Fig. 2), that correspond to a notable increase of the 50 year return period ofHsin the northern Catalan coast (Casas-Prat and Sierra, 2013).
Indeed, for most of the ports (9 of 13), RAC_E projects higher waves inside the har-bour, which can be explained by the largest future storm energy content associated to this RCM-GCM in most of the Catalan coast, as found out by Casas-Prat et al. (2015)
5
in terms of the stormHs and duration. A similar reasoning, but to a lesser extent (for
both magnitude and spatial extension), can be extended to RCA_H configuration. Con-versely, there is a majority of the ports showing a decrease for REM_E, which is as-sociated to a decrease of theHs under storm conditions but, especially, to the storm
duration and a drastic drop in the annual number of storms (Casas-Prat et al., 2015).
10
This reduction of the wave energy was also reflected in terms of the 50 year return pe-riod ofHs obtained for this model (Casas-Prat and Sierra, 2013). Nevertheless, some
exceptions are found in this general correlation pattern, which means that the physical processes are complex and a straight-forward conclusion cannot be derived a priori, especially in harbours with very local-depending or peculiar conditions, such as Port de
15
la Selva, which has shelter from many wave directions. In addition, local bathymetries, port geometries and structure reflectivity play a major role in the distribution of wave energy within the ports.
Finally, a comment regarding the comparison with the preliminary assessment per-formed by Casas-Prat and Sierra (2012) is due. As mentioned in the introduction, they
20
evaluated the changes in harbour agitation using wave projections obtained by trend analysis. This trend analysis was carried out with the HIPOCAS wave data (Guedes Soares et al., 2002), which is a long-term hindcast data set. They analysed two of the ports included in this study (Port Fòrum, Fig. 5, and Tarragona, Fig. 11), obtaining a spatial average increase of 18 and 11 %. Taking into account the inter-model
variabil-25
be-NHESSD
3, 955–992, 2015Harbour agitation under climate change
J. P. Sierra et al.
Title Page
Abstract Introduction
Conclusions References
Tables Figures
◭ ◮
◭ ◮
Back Close
Full Screen / Esc
Printer-friendly Version Interactive Discussion
Discussion
P
a
per
|
Discussion
P
a
per
|
Discussion
P
a
per
|
Discussion
P
a
per
|
tween HIPOCAS and RAC_E in terms of long-shore sediment transport for the current situation.
4.2 Seasonal analysis
As explained in Sect. 3, a seasonal analysis is carried out focusing in the two extreme seasons: winter and summer. The first one is defined as the months of December,
5
January and February, and summer as June, July and August, as is common in studies on the Mediterranean climate (Giorgi and Lionello, 2008).
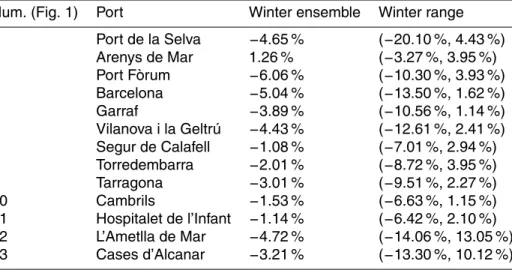
Table 2 illustrates the ensemble of the spatial averaged Hs variation in winter. The average of the five models indicates a reduction of the ensemble in 12 of the 13 studied ports. Only Arenys de Mar port shows an increase in the ensemble. However, in all
10
ports, there is at least one model showing an opposite trend to the others, with 6 ports where only one model shows this opposite trend and 7 ports with two models. This highlights the large inter-model variability obtained in winter. In addition, it is interesting to point out that, despite the average reductions for this season being small (between 1.08 and 6.06 %), some models give spatial average reductions exceeding 10 %. That
15
would entail even greater reductions in certain port areas.
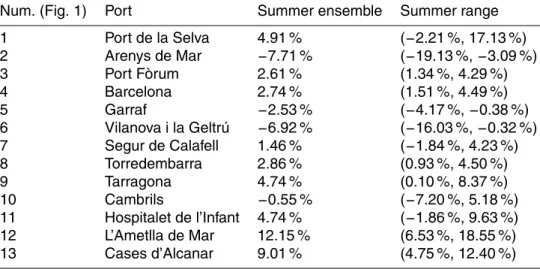
Table 3 summarizes the agitation results corresponding to summer. In 9 of the 13 ports, the ensemble of the 5 models give future increases of Hs while in the other 4, Hs reductions prevail. In 9 of the 13 ports the 5 models give the same trend (3 Hs reduction and 6 Hs increase), while in other 2, there are 4 models indicating Hs
20
reduction and 1Hs increase and in the remaining 2 ports, 2 models show an opposite trend to the other 3. The cases where the ensemble decreases, have a range from
−0.55 % (Cambrils) to−7.71 % (Arenys de Mar) and, when it increases, the range is
between 1.46 % (Segur de Calafell) and 12.15 % (L’Ametlla de Mar). However, some models give average reductions of up to−19.13 % (Arenys de Mar) and increases of up
25
NHESSD
3, 955–992, 2015Harbour agitation under climate change
J. P. Sierra et al.
Title Page
Abstract Introduction
Conclusions References
Tables Figures
◭ ◮
◭ ◮
Back Close
Full Screen / Esc
Printer-friendly Version Interactive Discussion
Discussion
P
a
per
|
Discussion
P
a
per
|
Discussion
P
a
per
|
Discussion
P
a
per
(spatial variability among ports) is larger in summer but the inter-model variability is sustainably lower. This inter-model variability seasonal pattern was also obtained for the wave field, especially in terms of the wave direction (Casas-Prat and Sierra, 2013). Indeed, the changes in harbour agitation in summer might be more affected by the changes in wave direction (due to large presence of calm sea states). The obtained
5
predominant increase of Hs inside harbours could be explained in many cases by a rise of the occurrence of SE waves obtained for all RCM-GCM combinations at least in the mid and southern Catalan coast. Note that almost all ports have an entrance orientated towards the south and therefore can be very sensitive to changes in this wave direction. On the other hand, the higher inter-port variability (i.e. variability along the Catalan
10
coast) can be explained by summer being more affected by local atmospheric events, which have larger spatial variability than larger scale synoptic events typically occurring during winter.
5 Summary and conclusions
The main objective of this paper is to analyse how changes in wave patterns due to the
15
effect of climate change can affect harbour agitation, focusing on 13 harbours located on the Catalan Coast (NW Mediterranean). These ports are selected considering data availability (in particular detailed bathymetries).
The study is based on the high-resolution wave projections developed by Casas-Prat and Sierra (2013), which were obtained with the SWAN model for 5 combinations of
20
regional and global circulation models (RCMs and GCMs) considering the SRES sce-nario A1B. These projections were performed for two 30 year periods: present (1971– 2000) and future (2071–2100). With the wave climate derived for each harbour and each time span, a representative set of wave parameters are propagated using lin-ear theory from the closest SWAN node to the limit of the simulation domain used
25
NHESSD
3, 955–992, 2015Harbour agitation under climate change
J. P. Sierra et al.
Title Page
Abstract Introduction
Conclusions References
Tables Figures
◭ ◮
◭ ◮
Back Close
Full Screen / Esc
Printer-friendly Version Interactive Discussion
Discussion
P
a
per
|
Discussion
P
a
per
|
Discussion
P
a
per
|
Discussion
P
a
per
|
the annual (or seasonal)Hs is obtained considering the corresponding frequencies of occurrence. From the comparison of present and futureHs, the percentage of variation
can be estimated for each model which serves to assess the potential changes in wave agitation.
The main limitation associated to the used methodology, which has a general
ap-5
plicability, is the use of linear theory to propagate the offshore wave conditions to the boundary of the Boussinesq-type model domain. It would be preferable to apply a wave numerical model to carry out this propagation (e.g. SWAN itself) but the lack of detailed bathymetries prevented from doing so. Nevertheless, taking into account the large uncertainty associated to climate change scenarios and model projections, the
10
error introduced using linear theory is acceptable.
Considering the ensemble (making an average of the five models) for each port it results in a general slight decrease in the annual agitation in most of the ports, although in the northernmost and southernmost areas of the region, a slight increase is obtained. However, the inter-model variability is large and therefore these ensemble values are
15
representative only for few locations that presents more consistency among RCM-GCM combinations. Only in 5 of the 13 ports analysed the five models give the same trend and the range of variation doubles or triples the ensemble increases or decreases of futureHs. Also, the spatial averaging sometimes masks opposite patterns within the
same port (for a single model), meaning that a future assessment on port operability
20
should use different values for each quay or platform.
In terms of inter-model variability, the following general features are noticed. RCA_H tends to project different patterns owing to the underlying different GCM. This is not as obvious though, as the fact that most realizations associated to RAC_E and REM_E show a potential increase and decrease, respectively, in the agitation inside the
har-25
NHESSD
3, 955–992, 2015Harbour agitation under climate change
J. P. Sierra et al.
Title Page
Abstract Introduction
Conclusions References
Tables Figures
◭ ◮
◭ ◮
Back Close
Full Screen / Esc
Printer-friendly Version Interactive Discussion
Discussion
P
a
per
|
Discussion
P
a
per
|
Discussion
P
a
per
|
Discussion
P
a
per
The seasonal analysis projects a decrease in agitation during winter, with a future reduction of global Hs in 12 of the 13 studied ports. However, in all ports, there is
at least one model showing an opposite trend to the others, with 6 ports where only 1 model shows this opposite trend and 7 ports with 2 models. Indeed, although the reduction obtained for the ensemble projections for this season is small (between 1.08
5
and 6.06 %), notably larger variations in the spatial averaged Hs are obtained. This
illustrates the larger inter-model variability in winter, with agrees with that of the wave field (Casas-Prat and Sierra, 2013). For summer, results project a general increase of spatial averagedHs (in 9 of the 13 ports), which is the period with greater activity
in most of the studied ports (marinas). For this season, the inter-model variability is
10
significantly lower (in 9 of the 13 ports the 5 models give the same trend), which also agree with the lower inter-model variability of the wave field obtained for this season (Casas-Prat and Sierra, 2013).
Ultimately, the obtained results show that potential changes in wave patterns can produce clear spatial and seasonal variations in agitation at the Catalan Coast ports.
15
Although most of the realizations entail a “positive” change (reduction of agitation in ports, increasing their safety and operability), the possibility of “negative” change (in-crease of waves within the port, reducing their safety and operability) is non-negligible. For the annual analysis, for example, most of the ports have RCM-GCM combinations showing an increase inHs. Also, although the analysis of spatial averaged values
in-20
dicate limited magnitude of the changes, a detailed analysis of their distribution within the harbours show that in certain areas the increase of wave heights may be very significative (greater than 20 %) potentially leading to serious management problems. The port community needs therefore to be aware of this potential problem. However, further studies are needed in this regard, trying to reduce the obtained uncertainty, for
25
example, by using updated climate projections.
NHESSD
3, 955–992, 2015Harbour agitation under climate change
J. P. Sierra et al.
Title Page
Abstract Introduction
Conclusions References
Tables Figures
◭ ◮
◭ ◮
Back Close
Full Screen / Esc
Printer-friendly Version Interactive Discussion
Discussion
P
a
per
|
Discussion
P
a
per
|
Discussion
P
a
per
|
Discussion
P
a
per
|
d’Universitats i Recerca del Dpt. d’Economia i Coneixement de la Generalitat de Catalunya (Ref 2014SGR1253) is also acknowledged.
The authors gratefully acknowledge the four European research centres and institutions that freely provided the atmospheric data sets used to develop the wave projections utilized in this study: DMI (Danmarks Meteorologiske Institut, Denmark), KNMI (Koninklijk Nederlands Meteo-5
rologisch Instituut, the Netherlands), MPI (Max-Planck-Institut für Meteorologie, Germany) and SMHI (Sveriges Meteorologiska och Hydrologiska Institut, Sweden).
References
Aumann, H., Ruzmaikin, A., and Teixeira, J.: Frequency of severe storms and global warming, Geophys Res. Lett., 35, L19805, doi:10.1029/2008GL034562, 2008.
10
Bengtsson, L., Hodges, K. I., and Roeckner, E.: Storm tracks and climate change, J. Climate, 19, 3518–3543, 2006.
Bingham, H. B.: A hybrid Boussinesq-panel method for predicting the motion of a moored ship, Coast. Eng., 40, 21–38, 2000.
Booij, N., Ris, R. C., and Holthuijsen, L. H.: A third-generation wave model for coastal regions: 15
1. Model description and validation, J. Geophys. Res., 104, 7649–7666, 1999.
Casas-Prat, M. and Sierra, J. P.: Trend analysis of wave storminess: wave direction and its im-pact on harbour agitation, Nat. Hazards Earth Syst. Sci., 10, 2327–2340, doi:10.5194/nhess-10-2327-2010, 2010.
Casas-Prat, M. and Sierra, J. P.: Trend analysis of wave direction and associated impacts on 20
the Catalan Coast, Climatic Change, 115, 667–691, 2012.
Casas-Prat, M. and Sierra, J. P.: Projected future wave climate in the NW Mediterranean Sea, J. Geophys. Res.-Oceans, 118, 3548–3568, 2013.
Casas-Prat, M., McInnes, K. L., Hemer, M. A., and Sierra, J. P.: Inter-model variability in regional climate change projections in terms of wave-driven coastal sediment transport, Reg. Environ. 25
Change, under review, 2015.
NHESSD
3, 955–992, 2015Harbour agitation under climate change
J. P. Sierra et al.
Title Page
Abstract Introduction
Conclusions References
Tables Figures
◭ ◮
◭ ◮
Back Close
Full Screen / Esc
Printer-friendly Version Interactive Discussion
Discussion
P
a
per
|
Discussion
P
a
per
|
Discussion
P
a
per
|
Discussion
P
a
per
González-Marco, D., Sierra, J. P., Fernández de Ybarra, O., and Sánchez-Arcilla, A.: Impli-cations of long waves in harbour management: the Gijon port case study, Ocean Coast. Manage., 51, 180–201, 2008.
Guedes Soares, C., Carretero-Albiach, J. C., Weisse, R., and Alvarez-Fanjul, E.: A 40 years hindcast of wind, sea level and waves in European waters, Proceedings of the 21st Interna-5
tional Conference on Offshore Mechanics and Arctic Engineering, Oslo, Norway, 669–675, 2002.
IPCC: Climate Change 2007. The Physical Science Basis. Contribution of Working Group I to the Fourth Assessment Report of the Intergovernmental Panel on Climate Change, edited by: Solomon, S., Qin, D., and Manning, M., Cambridge University Press, Cambridge, UK and 10
New York, NY, USA, 996 pp., 2007.
Leckebusch, G. C. and Ulbrich, U.: On the relationship between cyclones and extreme wind-storm events over Europe under climate change, Global Planet. Change, 44, 181–193, 2004. Lionello, P., Cogo, S., Galati, M. B., and Sanna, A.: The Mediterranean surface wave climate
inferred from future scenario simulations, Global Planet. Change, 63, 152–162, 2008. 15
Madsen, P. A., Sørensen, O. R., and Schäffer, H. A.: Surf zone dynamics simulated by a Boussi-nesq type model. Part II: surf beat and swash oscillations for wave groups and irregular waves, Coast. Eng., 32, 289–319, 1997.
Nadaoka, K. and Raveenthiran, K.: A phase-averaged Boussinesq model with effective de-scription of carrier wave group and associated long wave evolution, Ocean Eng., 29, 21–37, 20
2002.
Nicholls, R. J., Wong, P. P., Burkett, V., Woodroffe, C. D., and Hay, J.: Climate change and coastal vulnerability assessment: scenarios for integrated assessment, Sustain. Sci., 3, 89– 102, 2008.
Rusu, E. and Guedes Soares, C.: Wave modelling at the entrance of ports, Ocean Eng., 38, 25
2089–2109, 2011.
Rusu, L. and Guedes Soares, C.: Evaluation of a high-resolution wave forecasting system for the approaches to ports, Ocean Eng., 58, 224–238, 2013.
Sánchez-Arcilla, A., González-Marco, D., and Bolaños, R.: A review of wave climate and predic-tion along the Spanish Mediterranean coast, Nat. Hazards Earth Syst. Sci., 8, 1217–1228, 30
doi:10.5194/nhess-8-1217-2008, 2008.
NHESSD
3, 955–992, 2015Harbour agitation under climate change
J. P. Sierra et al.
Title Page
Abstract Introduction
Conclusions References
Tables Figures
◭ ◮
◭ ◮
Back Close
Full Screen / Esc
Printer-friendly Version Interactive Discussion
Discussion
P
a
per
|
Discussion
P
a
per
|
Discussion
P
a
per
|
Discussion
P
a
per
|
Wang, X., Zwiers, F., and Swail, V.: North Atlantic ocean wave climate change scenarios for the twenty-first century, J. Climate, 17, 2368–2383, 2004.
Wang, X., Swail, V., Zwiers, F., Zhang, X., and Feng, Y.: Detection of external influence on trends of atmospheric storminess and northern oceans wave heights, Clim. Dynam., 32, 189–203, 2009.
5
NHESSD
3, 955–992, 2015Harbour agitation under climate change
J. P. Sierra et al.
Title Page
Abstract Introduction
Conclusions References
Tables Figures
◭ ◮
◭ ◮
Back Close
Full Screen / Esc
Printer-friendly Version Interactive Discussion
Discussion
P
a
per
|
Discussion
P
a
per
|
Discussion
P
a
per
|
Discussion
P
a
per
Table 1. Ensemble of the annual spatial averaged change in Hs and its range of variation considering each RCM-GCM configuration individually, at the 13 studied ports.
Num. (Fig. 1) Port Annual ensemble Annual range 1 Port de la Selva 2.48 % (−4.47 %, 8.04 %) 2 Arenys de Mar −4.08 % (−11.13 %,−2.00 %) 3 Port Fòrum −1.02 % (−3.37 %, 1.16 %)
4 Barcelona −1.09 % (−4.84 %, 2.75 %)
5 Garraf −2.67 % (−5.31 %,−0.95 %)
6 Vilanova i la Geltrú −7.54 % (−12.92 %,−3.58 %) 7 Segur de Calafell −1.51 % (−6.57 %, 0.82 %) 8 Torredembarra −0.52 % (−2.23 %, 1.10 %)
9 Tarragona −1.80 % (−5.29 %, 1.22 %)
10 Cambrils −3.77 % (−6.45 %,−0.37 %)
NHESSD
3, 955–992, 2015Harbour agitation under climate change
J. P. Sierra et al.
Title Page
Abstract Introduction
Conclusions References
Tables Figures
◭ ◮
◭ ◮
Back Close
Full Screen / Esc
Printer-friendly Version Interactive Discussion
Discussion
P
a
per
|
Discussion
P
a
per
|
Discussion
P
a
per
|
Discussion
P
a
per
|
Table 2.Ensemble of the winter spatial averaged change inHsand its range of variation con-sidering each RCM-GCM configuration individually, at the 13 studied ports.
Num. (Fig. 1) Port Winter ensemble Winter range 1 Port de la Selva −4.65 % (−20.10 %, 4.43 %) 2 Arenys de Mar 1.26 % (−3.27 %, 3.95 %) 3 Port Fòrum −6.06 % (−10.30 %, 3.93 %)
4 Barcelona −5.04 % (−13.50 %, 1.62 %)
5 Garraf −3.89 % (−10.56 %, 1.14 %)
6 Vilanova i la Geltrú −4.43 % (−12.61 %, 2.41 %) 7 Segur de Calafell −1.08 % (−7.01 %, 2.94 %) 8 Torredembarra −2.01 % (−8.72 %, 3.95 %)
9 Tarragona −3.01 % (−9.51 %, 2.27 %)
10 Cambrils −1.53 % (−6.63 %, 1.15 %)
NHESSD
3, 955–992, 2015Harbour agitation under climate change
J. P. Sierra et al.
Title Page
Abstract Introduction
Conclusions References
Tables Figures
◭ ◮
◭ ◮
Back Close
Full Screen / Esc
Printer-friendly Version Interactive Discussion
Discussion
P
a
per
|
Discussion
P
a
per
|
Discussion
P
a
per
|
Discussion
P
a
per
Table 3. Ensemble of the summer spatial averaged change in Hs and its range of variation considering each RCM-GCM configuration individually, at the 13 studied ports.
Num. (Fig. 1) Port Summer ensemble Summer range 1 Port de la Selva 4.91 % (−2.21 %, 17.13 %) 2 Arenys de Mar −7.71 % (−19.13 %,−3.09 %)
3 Port Fòrum 2.61 % (1.34 %, 4.29 %)
4 Barcelona 2.74 % (1.51 %, 4.49 %)
5 Garraf −2.53 % (−4.17 %,−0.38 %)
6 Vilanova i la Geltrú −6.92 % (−16.03 %,−0.32 %) 7 Segur de Calafell 1.46 % (−1.84 %, 4.23 %)
8 Torredembarra 2.86 % (0.93 %, 4.50 %)
9 Tarragona 4.74 % (0.10 %, 8.37 %)
10 Cambrils −0.55 % (−7.20 %, 5.18 %)
NHESSD
3, 955–992, 2015Harbour agitation under climate change
J. P. Sierra et al.
Title Page
Abstract Introduction
Conclusions References
Tables Figures
◭ ◮
◭ ◮
Back Close
Full Screen / Esc
Printer-friendly Version Interactive Discussion
Discussion
P
a
per
|
Discussion
P
a
per
|
Discussion
P
a
per
|
Discussion
P
a
per
|
1
2
3
7 8
13 12 11
4 5 6 9 10
NHESSD
3, 955–992, 2015Harbour agitation under climate change
J. P. Sierra et al.
Title Page
Abstract Introduction
Conclusions References
Tables Figures
◭ ◮
◭ ◮
Back Close
Full Screen / Esc
Printer-friendly Version Interactive Discussion
Discussion
P
a
per
|
Discussion
P
a
per
|
Discussion
P
a
per
|
Discussion
P
a
per
N
NHESSD
3, 955–992, 2015Harbour agitation under climate change
J. P. Sierra et al.
Title Page
Abstract Introduction
Conclusions References
Tables Figures
◭ ◮
◭ ◮
Back Close
Full Screen / Esc
Printer-friendly Version Interactive Discussion
Discussion
P
a
per
|
Discussion
P
a
per
|
Discussion
P
a
per
|
Discussion
P
a
per
|
N
NHESSD
3, 955–992, 2015Harbour agitation under climate change
J. P. Sierra et al.
Title Page
Abstract Introduction
Conclusions References
Tables Figures
◭ ◮
◭ ◮
Back Close
Full Screen / Esc
Printer-friendly Version Interactive Discussion
Discussion
P
a
per
|
Discussion
P
a
per
|
Discussion
P
a
per
|
Discussion
P
a
per
|
N
NHESSD
3, 955–992, 2015Harbour agitation under climate change
J. P. Sierra et al.
Title Page
Abstract Introduction
Conclusions References
Tables Figures
◭ ◮
◭ ◮
Back Close
Full Screen / Esc
Printer-friendly Version Interactive Discussion
Discussion
P
a
per
|
Discussion
P
a
per
|
Discussion
P
a
per
|
Discussion
P
a
per
|
N
NHESSD
3, 955–992, 2015Harbour agitation under climate change
J. P. Sierra et al.
Title Page
Abstract Introduction
Conclusions References
Tables Figures
◭ ◮
◭ ◮
Back Close
Full Screen / Esc
Printer-friendly Version Interactive Discussion
Discussion
P
a
per
|
Discussion
P
a
per
|
Discussion
P
a
per
|
Discussion
P
a
per
|
N
NHESSD
3, 955–992, 2015Harbour agitation under climate change
J. P. Sierra et al.
Title Page
Abstract Introduction
Conclusions References
Tables Figures
◭ ◮
◭ ◮
Back Close
Full Screen / Esc
Printer-friendly Version Interactive Discussion
Discussion
P
a
per
|
Discussion
P
a
per
|
Discussion
P
a
per
|
Discussion
P
a
per
|
N
NHESSD
3, 955–992, 2015Harbour agitation under climate change
J. P. Sierra et al.
Title Page
Abstract Introduction
Conclusions References
Tables Figures
◭ ◮
◭ ◮
Back Close
Full Screen / Esc
Printer-friendly Version Interactive Discussion
Discussion
P
a
per
|
Discussion
P
a
per
|
Discussion
P
a
per
|
Discussion
P
a
per
|
N
NHESSD
3, 955–992, 2015Harbour agitation under climate change
J. P. Sierra et al.
Title Page
Abstract Introduction
Conclusions References
Tables Figures
◭ ◮
◭ ◮
Back Close
Full Screen / Esc
Printer-friendly Version Interactive Discussion
Discussion
P
a
per
|
Discussion
P
a
per
|
Discussion
P
a
per
|
Discussion
P
a
per