www.biogeosciences.net/9/1237/2012/ doi:10.5194/bg-9-1237-2012
© Author(s) 2012. CC Attribution 3.0 License.
Biogeosciences
Intra- versus inter-site macroscale variation in biogeochemical
properties along a paddy soil chronosequence
C. Mueller-Niggemann1, A. Bannert2, M. Schloter3, E. Lehndorff4, and L. Schwark1
1Institute of Geosciences, Christian-Albrechts-University of Kiel, Kiel, Germany 2Chair of Soil Ecology, Technische Universit¨at M¨unchen, Neuherberg, Germany 3Research Unit for Environmental Genomics, Helmholtz Zentrum M¨unchen
– German Research Center for Environmental Health, Neuherberg, Germany
4Institute of Crop Science and Resource Conservation, Soil Sciences, Bonn University, Bonn, Germany
Correspondence to:L. Schwark ([email protected])
Received: 18 August 2011 – Published in Biogeosciences Discuss.: 14 October 2011 Revised: 14 February 2012 – Accepted: 28 February 2012 – Published: 30 March 2012
Abstract. In order to assess the intrinsic heterogeneity of paddy soils, a set of biogeochemical soil parameters was investigated in five field replicates of seven paddy fields (50, 100, 300, 500, 700, 1000, and 2000 yr of wetland rice cultivation), one flooded paddy nursery, one tidal wetland (TW), and one freshwater site (FW) from a coastal area at Hangzhou Bay, Zhejiang Province, China. All soils evolved from a marine tidal flat substrate due to land reclamation. The biogeochemical parameters based on their properties were differentiated into (i) a group behaving conservatively (TC, TOC, TN, TS, magnetic susceptibility, soil lightness and colour parameters, δ13C, δ15N, lipids and n-alkanes) and (ii) one encompassing more labile properties or fast cy-cling components (Nmic, Cmic, nitrate, ammonium, DON and
DOC). The macroscale heterogeneity in paddy soils was as-sessed by evaluating intra- versus inter-site spatial variabil-ity of biogeochemical properties using statistical data anal-ysis (descriptive, explorative and non-parametric). Results show that the intrinsic heterogeneity of paddy soil organic and minerogenic components per field is smaller than be-tween study sites. The coefficient of variation (CV) values of conservative parameters varied in a low range (10 % to 20 %), decreasing from younger towards older paddy soils. This indicates a declining variability of soil biogeochemical properties in longer used cropping sites according to progress in soil evolution. A generally higher variation of CV val-ues (>20–40 %) observed for labile parameters implies a need for substantially higher sampling frequency when in-vestigating these as compared to more conservative param-eters. Since the representativeness of the sampling strat-egy could be sufficiently demonstrated, an investigation of long-term carbon accumulation/sequestration trends in top-soils of the 2000 yr paddy chronosequence under wetland
rice cultivation restricted was conducted. Observations can-not be extrapolated to global scale but with coastal paddy fields developed on marine tidal flat substrates after land reclamation in the Zhejiang Province represent a small frac-tion (<1 %) of the total rice cropping area. The evolutionary trend showed that the biogeochemical signatures character-istic for paddy soils were fully developed in less than 300 yr since onset of wetland rice cultivation. A six-fold increase of topsoil TOC suggests a substantial gain in CO2sequestration
potential when marine tidal wetland substrate developed to 2000 yr old paddy soil.
1 Introduction
On global scale rice (Oryza sativa) is the most important staple crop feeding more than 50 % of the World’s pop-ulation. Cultivation of rice thus affords large proportion of arable land, amounting to approx. 156×106hectare, of which>90 % is used for wetland or paddy rice cultivation in 2008 (IRRI, 2010). A critical factor in paddy rice cropping is the periodic flooding of soils and the associated fluctuations in soil redox conditions, biogeochemical cycling of essen-tial and trace elements, and microbial community structure. Rice paddy fields are assumed to contribute significantly to the emission of potent greenhouse gases CH4and N2O (e.g.
A major problem in the design of biogeochemical studies of paddy fields is the intrinsic heterogeneity of paddy soils in the spatial as well as the temporal realm. Spatial variabil-ity may occur on the micro (nm–mm), meso (cm) and macro (m–tens of m) scale level. In paddy soils microscale vari-ability has been described for soil aggregates (Li et al., 2007) and within the rhizosphere whereas mesoscale variations oc-cur within paddy soil profiles on cm or decimetre scale and can be related preferentially to changes in redox conditions (Koegel-Knabner et al., 2010). Macroscale heterogeneity in paddy soils occurs over distances of meters or tens of me-ters and is less well studied than micro or mesoscale vari-ability. The focus on such heterogeneity investigations has been placed on soil fertility, crop yields and nutrient levels in paddy fields (Tatsuya et al., 2004; Wang et al., 2009; Wei et al., 2009; Yanai et al., 2001; Zhao et al., 2009). How-ever the heterogeneity of bulk organic, molecular and iso-topic biogeochemical parameters used to interpret paddy soil processes has not yet been investigated on the macroscale. The objectives of this study thus were, first to evaluate intra-and inter-site spatial variability of geochemical properties indicative for soil organic matter (SOM), minerogenic sub-strate and nutrients in paddy fields. Hereby, a differentia-tion of parameters assumed to behave conservatively by re-flecting time-integrated properties (averaging over years or decades) versus fast reacting or labile parameters (reflecting daily, weekly or seasonal changes) was performed. Biogeo-chemical properties assumed to behave conservatively com-prised soil TOC, TN,δ13C,δ15N and extractable lipid con-tent and composition (Zhou et al., 2009; Wiesenberg et al., 2004, 2008), reflecting time-averaged influx and composi-tion of crop biomass and microbial re-mineralizacomposi-tion. Fur-ther parameters reflecting time-averaged soil mineralogy and redox conditions were soil magnetic susceptibility and spec-tral soil colour (Mullins, 1977; Viscarra Rossel et al., 2006). As labile parameters microbial biomass carbon and nitrogen (Chantigny et al., 1996; Bai et al., 2000), nitrate, ammonium (Myrold et al., 1986; Davidson et al., 1992; Stark and Hart, 1997), dissolved organic N, and dissolved organic C (Kalbitz et al., 2003; Zhang et al., 2011) were considered.
Factors influencing macroscale paddy soil heterogeneity can be either linked to natural variability of the substrate on which paddy soils evolved and/or management practices (R¨uth and Lennartz, 2008) that locally affect influx and ef-flux of various components into soils, which in turn regulates the soil microbial community (Dupuis and Whalen, 2007). Management practices can cause very localized and arbitrary enrichment (spots of 1–3 m diameter) of fertilizers, pesti-cide application, vegetation waste, or biomass combustion residues (heaps of burning rice straw) on paddy fields. Addi-tionally, more systematic in-field variations in soil properties may result from flow pathways of irrigation water and its sus-pended materials load (Schmitter et al., 2010). Puddling of rice fields (ploughing under flooded conditions) is considered a key factor in the homogenization of locally constrained
inputs and when repeated oftentimes may finally lead to the establishment of homogeneous distribution of conservative soil parameters, whereas the labile components may still ex-hibit severe spatial variability on the field scale.
Depending on the methodological approach applied, chal-lenges to obtain representative paddy soil samples may vary considerably. This may lead to incompatible results, if e.g. microbial ecology conducted by genomics or proteomics tar-geting labile components is compared to lipidomics (analy-sis of phospholipid fatty acids or other microbial membrane lipids) employing conservative components.
Secondly, if it could be proven that inter-site variations ex-ceed intra-site variability for specific parameters, the biogeo-chemical trends over up to 2000 yr of rice cultivation could be evaluated for a chronosequence (Walker et al., 2010) from the Zhejiang Province, China. Here rice cultivation started in coastal regions following land reclamation after dyke build-ing at well dated times (Cheng et al., 2009; Chen et al., 2011), which allows for investigation of long-term evolution-ary trends in rice paddy biogeochemistry. It is postulated that ongoing paddy soil evolution will continuously diminish the intrinsic heterogeneity of young paddy soils and ultimately establish homogeneous soil biogeochemical conditions as a consequence of destruction of aggregates and macropores (Ringrose-Voase et al., 2000) and by formation of an efficient plough pan (Lennartz et al., 2009) via puddling. Verifica-tion of paddy soil homogeneity in this investigaVerifica-tion will con-tribute to validating pedogenic and biogeochemical studies of the same chronosequence conducted previously (Cheng et al., 2009; Bannert et al., 2011a, b; Chen et al., 2011; Roth et al., 2011; Wissing et al., 2011). All biogeochemical inves-tigations were carried out using 5 field replicates that were treated statistically and allow assessing whether a composi-tion in one field or a trend over several fields is robust and representative.
2 Material and methods 2.1 Study sites
The sites are located in the coastal Cixi area (Hangzhou Bay) in the north-east of the Zhejiang Province, China, as shown in Fig. 1. The Bay is affected by river runoff and tide from the East China Sea. The Yangtze (Changjiang) River with an average water runoff of 925×109m3yr−1and sediment
load of 480×109kg yr−1supplied the dominant amount of
Fig. 1. Map of study area, depicting generations of dykes con-structed for land reclamation purposes and sampling locations (courtesy of R. Jahn, University Halle).
Step by step land reclamation on marine tidal mudflat sed-iments (continuous alluvial plain of Andong Beach) through the building of protective dykes over the past 2000 yr, al-lows the investigation of a soil chronosequence with differ-ent stages of developmdiffer-ent and well known starting dates of cultivation (Edit Committee of Chorography of Cixi County, 1992; Yu et al., 2003; Cheng et al., 2009; Chen et al., 2011). Wetland rice cultivation generally started when salt concen-tration decreases to tolerance levels, commonly after<5 yr. Based on the time of dyke construction and information of the Edit Committee of Chorography of Cixi County (1992) sites with ongoing wetland rice cultivation for 50, 100, 300, 500, 700, 1000 and 2000 yr were identified.
In this region the generally cropping system constitutes one wetland rice season and one dry inter-crop (vegetables, cotton or cereals) season per year, called paddy-upland rota-tion. Soils with wetland rice cultivation represent Anthraquic Anthrosols, or briefly paddy soils. These are exposed to longer phases of irrigation influenced by oxygen depriva-tion and establishment of reducing condidepriva-tions. The sampled paddy soils can be differentiated into a Stagnic Endogleyic Cambisol (50 yr old paddy), an Endogleyic Cambisol (100 to 500 yr old paddy soils) and an Endogleyic Stagnosol (700 to 2000 yr old paddy soils).
2.2 Sampling
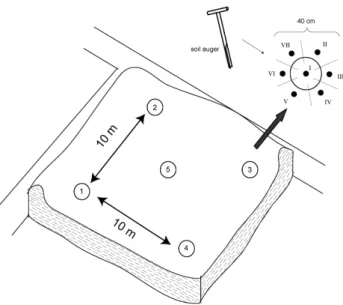
Sampling was conducted in June 2008 after the harvest of the upland crop from seven paddy sites (P50, P100, P300, P500, P700, P1000, P2000) before flooding. In addition, sediment from a flooded paddy nursery site (P50N), a marine site (TW for tidal wetland), and a lacustrine site (FW for freshwater sediment) were analyzed. From each site the top soil/ sedi-ment down to the plough pan (roughly 0–20 cm) was sampled by a soil auger. The sample representativeness was ensured by collecting five field replicates at each site. The sampling strategy in Fig. 2 shows that each field replicate constitutes a composite sample of seven subsamples. After storage of the soil and sediment samples in a freezer, soil microbial biomass analyses followed within the next 2 weeks. The re-maining sample aliquots were freeze dried and homogenized by grinding to fine powder prior further analyses.
Fig. 2.Design for recovery of field replicates at 10 m regular spac-ing, each of which is a composite of 7 subsamples taken at 40 cm regular spacing.
2.3 Laboratory analysis
Total organic carbon (TOC) concentrations of the soils and sediments were determined with a LECO CS-225 analyzer after decarbonatisation with HCl (10 %) and neutralization with distilled water. The total carbon (TC), total nitrogen (TN) and total sulphur (TS) were measured directly with a CNS analyzer (Elementar Vario EL-III). Bulk magnetic sus-ceptibility was analyzed at room temperature with a Kap-pabridge (KLY-2, noise level 4×10⁻⁸ SI) to characterize
the magnetizability of ferromagnetic particles in the sample. Soil colour was quantified using a Minolta (CM-700d/600d) spectrophotometer by measuring the colour parameters on the surface of air-dried samples as described in Wiesenberg et al. (2006). Determinations of water extractable organic carbon (DOC) and nitrogen (DON) were conducted after ex-traction of the samples with 0.01 M CaCl2(solid to liquid
ra-tio of 1:3) with a total organic carbon analyzer DIMATOC 100 (J¨orgensen and Brookes, 1991). For the detection of microbial biomass carbon (Cmic)and nitrogen (Nmic)
con-tent, aliquots of soils/sediments were fumigated with chlo-roform (24 h) prior to CaCl2 extraction. The nitrate and
ammonium concentrations were measured in CaCl2extracts
by a photometric autoanalyzer (CFA-SAN Plus/Skalar An-alytic) using the commercial kits NANOCOLOR Nitrat-50 and Ammonium-3.
The extractable lipids of soils and sediments were ob-tained by pressurized solvent extraction (Dionex ASE 200). Briefly, lipids from ca. 8 g dry soil were extracted with a dichloromethane/methanol (3/1; v:v) solvent mixture for 20 min at 100◦C and 7×10⁶kg m−1s−2. Elemental sul-phur was removed from the total lipid extracts by addi-tion of activated copper. For quantificaaddi-tion known amounts of perdeuteratedn-tetracosane were added as internal stan-dard. Total extracts dissolved in n-hexane were separated into apolar and polar compounds using small scale chro-matography (Bastow et al., 2007). The aliphatic hydrocar-bons were eluted withn-hexane after passing the glass col-umn (4 mm×8 cm) filled with activated silica gel (2 h at 130◦C). The sample volume was reduced via evaporation prior to transfer to GC-MS vials. Aliphatic hydrocarbon frac-tions were analyzed on a 30 m, ZB-1ms fused silica capillary column (0.25 mm internal diameter, film thickness 0.25 µm; Phenomenex) in a HP 5890 Series II gas chromatograph (oven programme: 70◦C, 3 min isothermal, 10◦C min−1 to
140◦C, 3◦C min−1to 340◦C, 3.5 min isothermal) equipped with a split/splitless injector coupled to a HP 5971A mass spectrometer operated in EI-mode at 70 EV.
2.4 Statistical analysis
All individual data sets were subjected to a statistical eval-uation including calculation of various descriptive statistics such as the average (AV), the standard deviation (SD) and the coefficient of variation (CV), whereby the latter describe the spread and relative proportion of variation in the data set. Non-parametric statistical analyses were applied to compare all measured soil parameters among the different sampling sites. For identification of significant variations between the sites a Kruskal-Wallis Test, suitable for non-Gaussian distributed populations, was operated (null hypothesis was all medians are equal), where the asymptotic significances (p-values) <0.05 indicate one or more medians are differ-ent. Additionally, multivariate techniques such as a principal component analysis and a cluster analysis were conducted to identify inter-site variability. The analyses were performed using MS Office Excel and PASW Statistics 18.
3 Results and discussion 3.1 Soil parameters
For the control of sample representativeness five field repli-cates (each a composite sample of seven individual subsam-ples covering an area of 2 square meters) were taken from every site and investigated for 23 different biogeochemical parameters. The summary of the descriptive statistics with average, standard deviation and the coefficients of variations of all parameters determined for the individual sites are listed in Table 1.
3.2 Macroscale intra-site variability
The investigation of intra-site variability on macroscale level provides information about heterogeneity and distribution of soil parameters within a single field. According to their prop-erties the parameters chosen could be pre-differentiated in two groups. The first group termed as “conservative” param-eters contained the soil properties that were assumed to rep-resent time-averaged and well homogenized (puddled) soil properties including TC, TOC, TN, TS, lipids,n-alkanes, sta-ble carbon and nitrogen isotopes (δ13C,δ15N), magnetic sus-ceptibility (χ), soil lightness (L∗)and colour parameters (a∗, b∗). The second group termed “labile” parameters encom-passed all fast reacting properties (reflecting daily, weekly or at maximum seasonal changes) included microbial biomass nitrogen and carbon (Nmic, Cmic), nitrate, ammonium, DON
and DOC (Table 1).
3.2.1 Bulk organic and minerogenic parameters
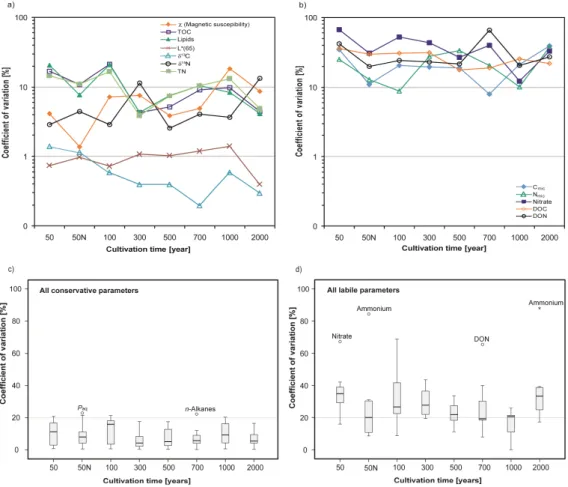
The results show much lower variation of individual parame-ters in the conservative group with non-uniform distribution pattern over different paddy soil cultivation times (Table 1, Fig. 3a). A coefficient of variation (CV) for soil parameters lower than 20 % generally indicates insignificant variability of these soil properties. The lowest spreading of CV val-ues (<1.4 %) within all soils and sediments was observed for the bulk soil organic matter (SOM)δ13C isotope values and the lightness parameterL∗(CIE axis ranging from black to white). A slightly higher but generally low variation of CV values (between 1 to 13 %) was detected for theδ15N values of bulk SOM, magnetic susceptibility (χ), and soil colour parametersa∗andb∗(Fig. 3a). These parameters and their marginal variation within a sampling site, comparable in soils and sediments provide information about the homogeneity of the parent material on which the respective paddy soils devel-oped. Only the 1000 yr old paddy soil presents an exception (Fig. 3a) with a higher variation in magnetic susceptibility (18.4 %), which can be explained by a mixture of the paddy soil with adjacent upland soils of different mineralogy caused by topsoil removal and mixing in the course of dyke mainte-nance work (Roth et al., 2011; Wissing et al., 2011).
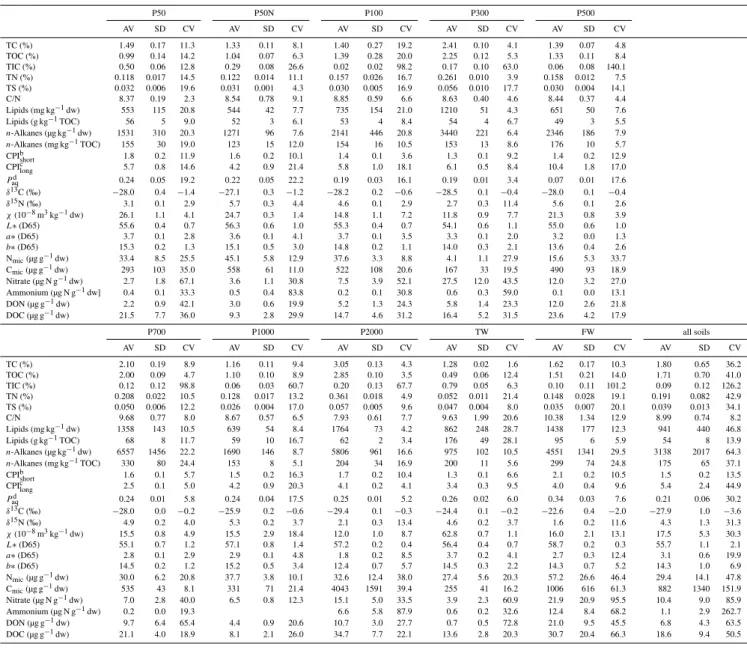
Table 1. Descriptive statistics of all biogeochemical parameters determined for the 10 study sites. P50N designates the seedling nursery paddy, TW designates the marine tidal flat substrate and FW designates the freshwater limnic substrate. AV=average value, SD=standard deviation, CV=coefficient of variation. Conservative parameters were grouped TC tob∗(D65), labile parameters were grouped Nmicto DOC.
P50 P50N P100 P300 P500
AV SD CV AV SD CV AV SD CV AV SD CV AV SD CV
TC (%) 1.49 0.17 11.3 1.33 0.11 8.1 1.40 0.27 19.2 2.41 0.10 4.1 1.39 0.07 4.8 TOC (%) 0.99 0.14 14.2 1.04 0.07 6.3 1.39 0.28 20.0 2.25 0.12 5.3 1.33 0.11 8.4 TIC (%) 0.50 0.06 12.8 0.29 0.08 26.6 0.02 0.02 98.2 0.17 0.10 63.0 0.06 0.08 140.1 TN (%) 0.118 0.017 14.5 0.122 0.014 11.1 0.157 0.026 16.7 0.261 0.010 3.9 0.158 0.012 7.5 TS (%) 0.032 0.006 19.6 0.031 0.001 4.3 0.030 0.005 16.9 0.056 0.010 17.7 0.030 0.004 14.1 C/N 8.37 0.19 2.3 8.54 0.78 9.1 8.85 0.59 6.6 8.63 0.40 4.6 8.44 0.37 4.4 Lipids (mg kg−1dw) 553 115 20.8 544 42 7.7 735 154 21.0 1210 51 4.3 651 50 7.6 Lipids (g kg−1TOC) 56 5 9.0 52 3 6.1 53 4 8.4 54 4 6.7 49 3 5.5
n-Alkanes (µg kg−1dw) 1531 310 20.3 1271 96 7.6 2141 446 20.8 3440 221 6.4 2346 186 7.9
n-Alkanes (mg kg−1TOC) 155 30 19.0 123 15 12.0 154 16 10.5 153 13 8.6 176 10 5.7 CPIb
short 1.8 0.2 11.9 1.6 0.2 10.1 1.4 0.1 3.6 1.3 0.1 9.2 1.4 0.2 12.9 CPIc
long 5.7 0.8 14.6 4.2 0.9 21.4 5.8 1.0 18.1 6.1 0.5 8.4 10.4 1.8 17.0
Paqd 0.24 0.05 19.2 0.22 0.05 22.2 0.19 0.03 16.1 0.19 0.01 3.4 0.07 0.01 17.6
δ13C (‰) −28.0 0.4 −1.4 −27.1 0.3 −1.2 −28.2 0.2 −0.6 −28.5 0.1 −0.4 −28.0 0.1 −0.4
δ15N (‰) 3.1 0.1 2.9 5.7 0.3 4.4 4.6 0.1 2.9 2.7 0.3 11.4 5.6 0.1 2.6
χ(10−8m3kg−1dw) 26.1 1.1 4.1 24.7 0.3 1.4 14.8 1.1 7.2 11.8 0.9 7.7 21.3 0.8 3.9
L∗(D65) 55.6 0.4 0.7 56.3 0.6 1.0 55.3 0.4 0.7 54.1 0.6 1.1 55.0 0.6 1.0
a∗(D65) 3.7 0.1 2.8 3.6 0.1 4.1 3.7 0.1 3.5 3.3 0.1 2.0 3.2 0.0 1.3
b∗(D65) 15.3 0.2 1.3 15.1 0.5 3.0 14.8 0.2 1.1 14.0 0.3 2.1 13.6 0.4 2.6 Nmic(µg g−1dw) 33.4 8.5 25.5 45.1 5.8 12.9 37.6 3.3 8.8 4.1 1.1 27.9 15.6 5.3 33.7 Cmic(µg g−1dw) 293 103 35.0 558 61 11.0 522 108 20.6 167 33 19.5 490 93 18.9 Nitrate (µg N g−1dw) 2.7 1.8 67.1 3.6 1.1 30.8 7.5 3.9 52.1 27.5 12.0 43.5 12.0 3.2 27.0 Ammonium (µg N g−1dw] 0.4 0.1 33.3 0.5 0.4 83.8 0.2 0.1 30.8 0.6 0.3 59.0 0.1 0.0 13.1 DON (µg g−1dw) 2.2 0.9 42.1 3.0 0.6 19.9 5.2 1.3 24.3 5.8 1.4 23.3 12.0 2.6 21.8 DOC (µg g−1dw) 21.5 7.7 36.0 9.3 2.8 29.9 14.7 4.6 31.2 16.4 5.2 31.5 23.6 4.2 17.9
P700 P1000 P2000 TW FW all soils
AV SD CV AV SD CV AV SD CV AV SD CV AV SD CV AV SD CV
TC (%) 2.10 0.19 8.9 1.16 0.11 9.4 3.05 0.13 4.3 1.28 0.02 1.6 1.62 0.17 10.3 1.80 0.65 36.2 TOC (%) 2.00 0.09 4.7 1.10 0.10 8.9 2.85 0.10 3.5 0.49 0.06 12.4 1.51 0.21 14.0 1.71 0.70 41.0 TIC (%) 0.12 0.12 98.8 0.06 0.03 60.7 0.20 0.13 67.7 0.79 0.05 6.3 0.10 0.11 101.2 0.09 0.12 126.2 TN (%) 0.208 0.022 10.5 0.128 0.017 13.2 0.361 0.018 4.9 0.052 0.011 21.4 0.148 0.028 19.1 0.191 0.082 42.9 TS (%) 0.050 0.006 12.2 0.026 0.004 17.0 0.057 0.005 9.6 0.047 0.004 8.0 0.035 0.007 20.1 0.039 0.013 34.1 C/N 9.68 0.77 8.0 8.67 0.57 6.5 7.93 0.61 7.7 9.63 1.99 20.6 10.38 1.34 12.9 8.99 0.74 8.2 Lipids (mg kg−1dw) 1358 143 10.5 639 54 8.4 1764 73 4.2 862 248 28.7 1438 177 12.3 941 440 46.8 Lipids (g kg−1TOC) 68 8 11.7 59 10 16.7 62 2 3.4 176 49 28.1 95 6 5.9 54 8 13.9
n-Alkanes (µg kg−1dw) 6557 1456 22.2 1690 146 8.7 5806 961 16.6 975 102 10.5 4551 1341 29.5 3138 2017 64.3
n-Alkanes (mg kg−1TOC) 330 80 24.4 153 8 5.1 204 34 16.9 200 11 5.6 299 74 24.8 175 65 37.1 CPIbshort 1.6 0.1 5.7 1.5 0.2 16.3 1.7 0.2 10.4 1.3 0.1 6.6 2.1 0.2 10.5 1.5 0.2 13.5 CPIclong 2.5 0.1 5.0 4.2 0.9 20.3 4.1 0.2 4.1 3.4 0.3 9.5 4.0 0.4 9.6 5.4 2.4 44.9
Pd
aq 0.24 0.01 5.8 0.24 0.04 17.5 0.25 0.01 5.2 0.26 0.02 6.0 0.34 0.03 7.6 0.21 0.06 30.2
δ13C (‰) −28.0 0.0 −0.2 −25.9 0.2 −0.6 −29.4 0.1 −0.3 −24.4 0.1 −0.2 −22.6 0.4 −2.0 −27.9 1.0 −3.6
δ15N (‰) 4.9 0.2 4.0 5.3 0.2 3.7 2.1 0.3 13.4 4.6 0.2 3.7 1.6 0.2 11.6 4.3 1.3 31.3
χ(10−8m3kg−1dw) 15.5 0.8 4.9 15.5 2.9 18.4 12.0 1.0 8.7 62.8 0.7 1.1 16.0 2.1 13.1 17.5 5.3 30.3
L∗(D65) 55.1 0.7 1.2 57.1 0.8 1.4 57.2 0.2 0.4 56.4 0.4 0.7 58.7 0.2 0.3 55.7 1.1 2.1
a∗(D65) 2.8 0.1 2.9 2.9 0.1 4.8 1.8 0.2 8.5 3.7 0.2 4.1 2.7 0.3 12.4 3.1 0.6 19.9
b∗(D65) 14.5 0.2 1.2 15.2 0.5 3.4 12.4 0.7 5.7 14.5 0.3 2.2 14.3 0.7 5.2 14.3 1.0 6.9 Nmic(µg g−1dw) 30.0 6.2 20.8 37.7 3.8 10.1 32.6 12.4 38.0 27.4 5.6 20.3 57.2 26.6 46.4 29.4 14.1 47.8 Cmic(µg g−1dw) 535 43 8.1 331 71 21.4 4043 1591 39.4 255 41 16.2 1006 616 61.3 882 1340 151.9 Nitrate (µg N g−1dw) 7.0 2.8 40.0 6.5 0.8 12.3 15.1 5.0 33.5 3.9 2.3 60.9 21.9 20.9 95.5 10.4 9.0 85.9 Ammonium (µg N g−1dw) 0.2 0.0 19.3 6.6 5.8 87.9 0.6 0.2 32.6 12.4 8.4 68.2 1.1 2.9 262.7 DON (µg g−1dw) 9.7 6.4 65.4 4.4 0.9 20.6 10.7 3.0 27.7 0.7 0.5 72.8 21.0 9.5 45.5 6.8 4.3 63.5 DOC (µg g−1dw) 21.1 4.0 18.9 8.1 2.1 26.0 34.7 7.7 22.1 13.6 2.8 20.3 30.7 20.4 66.3 18.6 9.4 50.5
aPn-alkanes=n-C 13−40 bCPI
short: 0.5×([(n-C15+n-C17+n-C19+n-C21)/(n-C14+n-C16+n-C18+n-C20)]+ [(n-C15+n-C17+n-C19+n-C21)/(n-C16+n-C18+n-C20+n-C22)]) cCPI
long: 0.5×([(n-C25+n-C27+n-C29+n-C31)/(n-C24+n-C26+n-C28+n-C30)]+ [(n-C25+n-C27+n-C29+n-C31)/(n-C26+n-C28+n-C30+n-C32)]) dP
aq: (n-C23+n-C25)/(n-C23+n-C25+n-C29+n-C31)
variation of TN and C/N in marine sediments and of TN and TS in lacustrine sediments (Table 1).
3.2.2 Lipid and alkane concentration and composition
The highest variations of conservative parameters within a sampling site were noted for the concentration of total ex-tractable lipids and the lipid class ofn-alkanes. The latter is derived from land plant wax coatings, limnic macrophytes,
Fig. 3.Coefficients of variation for paddy soil sites sampled in pentuplicate with(a)conservative parameters,(b)labile parameters,(c)box and whisker-plots showing median value, 75 percentile, 90 percentile and outliers for conservative parameters,(d)same as(c)but for labile parameters.
higher variation in the limnic environment could be attributed to sampling in a shallow water environment. This favoured mixed organic matter input from submerged aquatic macro-phyte biomass and terrestrial plant matter supplied by the catchment to the near-shore limnic setting.
The range of alkane concentrations in paddy soils is caused by diverse organic matter input from actual crop or weed vegetation, products from incomplete biomass combus-tion, or fossil fuel contaminants at different “hot-spots” on a site. In general, total extractable lipids in paddy soils repre-sent 5.6 % of the total soil organic carbon and are mainly composed of n-fatty acids, n-alcohols, sterols, long-chain wax esters, sugars and other functionalized lipid classes. On average 3.1 mg kg−1 of these soil lipids are composed
of source-diagnostic n-alkanes (Table 1) but in the 700 yr old paddy soil substantially higher proportions ofn-alkanes (6.5 mg kg−1)were observed, which could be attributed to
fossil fuel contamination.
A partial origin of n-alkanes from fossil contamination is evident from the presence of a pronounced “unresolved complex mixture” (UCM) and a high abundance of thermally mature tricyclic and pentacyclic triterpenoids (hopanoids)
Fig. 4. GC/MS total ion traces obtained from aliphatic hydrocar-bon fractions, with major peaks labelled for identification. The inset shows the extracted mass fragmentogram ofm/z=191, in-dicative for tri- and pentacyclic triterpenoids. Diploptene marked black is indicative of recent bacteria, hopanes and tricyclic hydro-carbons in grey derive from fossil fuel contamination. Peaks are labelled according to number of carbon atoms per molecule and isomerisation at position C17, C21 and C22. Ts=trisnorhopane, Tm=Trisnorneohopane. Note high abundance of fossil fuel hopanes vs. recent diploptene in P700.
The compositional variation of n-alkanes in the paddy soils can be evaluated using standardized parameters de-scribing the preferential enrichment of individual alkanes. The carbon preference index (CPI) established by Bray and Evans (1961) is used to highlight the predominance of odd-over even numbered n-alkane homologues. High CPIlong values for long-chain components (> nC23)derive
from fresh plant waxes and tend to decline with increas-ing biodegradation and thermal maturity. The same ac-counts for short chainn-alkanes (<nC22)derived from
al-gae or cyanobacteria. Fossil fuels exhibit CPI values close to unity. Variation in CPI values thus reflects recent diage-netic progress or fossil fuel origin. The short chain alka-nes for paddies and TW reveal CPI values<1.7 indicative of minor algal and/or cyanobacterial input with only the FW
site giving a higher CPIshort of 2.1 pointing to more
en-hanced algal/cyanobacterial contributions. In conjunction with a small average CV of<10 % the overall proportion of aquatic microbial biomass has been low. An even-over odd predominance of short chain (< nC21) n-alkane homologues
as marker of incomplete combustion products (Wiesenberg et al., 2009, Kuhn et al., 2010) was not observed in topsoils and sediments. More substantial variation was observed for CPIlong values around 6.0 for the young paddy sites (P50–
P300) and around 4.0 for the older paddies and reference sites, indicative of progress in diagenetic overprinting. Ex-ceptionally high CPIlongvalues were observed for P500
(Ta-ble 1) and indicate an origin of plant waxes from crops other than rice. Based on comparison with recent crop plants (data not shown), then-alkane distribution at this site is governed by input of wax lipids from the upland crop rape (Brassica napus). Very low CPIlong values of 2.5 for P700 are due
to admixture of fossil fuel with a CPI near unity and thus support the UCM and hopanoid data. For all CPIlong values
CV values are between 5 to 20 % showing no preference for source or degree of diagenesis.
ThePaq-ratio established by Ficken et al. (2000) has been
used to determine the relative contribution of submerged aquatic macrophytes to the sedimentaryn-alkane load. Val-ues for all paddies except for P500 are close to that of the TW substrate and only the FW reference sites reveal enhanced values of 0.34 (Table 1). The exceptionally lowPaqof P500
is due to an origin of alkanes from non-aquatic plants and emphasizes an origin from upland crops growing under dry conditions. During time of sample acquisition the P500 site was used as a paddy soil and had been under this utilization for more than 3 yr. The molecular composition of lipids, in particularn-alkanes, from this site however clearly reflects its previous long-term use as a non-paddy upland cropping site. The time-integrative manner of conservative molecular biogeochemical indicators unravelling the temporally domi-nating land-use of soils is well illustrated in the P500 case. Despite the coexistence of older (<3 yr) and fresh lipids, the CV for various molecular parameters is only 12 to 17 %.
For all sites the CV values are below 20 % and confirm that application of molecular proxies for source identification, de-gree of diagenetic overprinting and fossil fuel contamination are very robust and reliable.
3.2.3 Integrating conservative and labile parameters over cultivation times
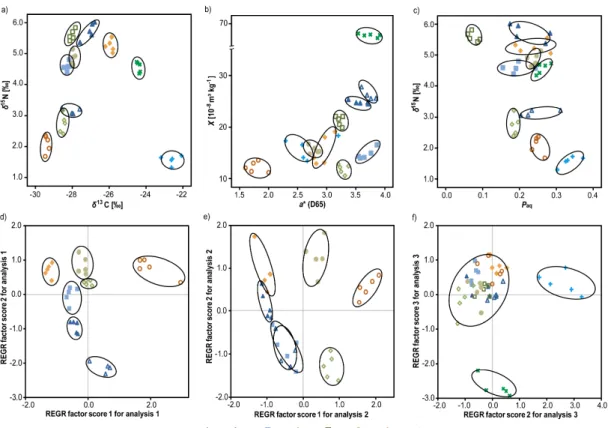
Fig. 5. Discrimination of variance between sites versus in-site using descriptive statistics(a)to (c)and non-parametric and multivariate methods(d)to(f). The factor plots obtained from PCA are shown for(d)all paddy soils using all parameters,(e)all paddy soils using exclusively conservative parameters, and(f)using all paddy soils, non-paddy soil P500 and substrates FW and TW. Note that discrimination of substrates was achieved best, when using the 2nd and 3rd factor rather than 1st and 2nd factor as in(d)and(e).
A comparison of the P50 and P50N site reveals differential behaviour that can be explained by management practices. Soil at the P50 site has experienced a long series of redox cycles like all other paddy soils, whereas the P50N site as a rice seedling nursery is kept under flooded conditions for longer times and thus has been going through less frequent and less dramatic redox cycles. As a result paddy soil evo-lution at the P50N site proceeded further compared to other sites of comparable overall cultivation time. A notable ex-ception is thePaq ratio that shows a CV comparable to the
P50 or P100 sites (Fig. 3c), indicating that water table fluc-tuations at the P50N site affect wax lipid composition of rice seedlings, even if the soils do not pass through completely dry cycles.
Except for the P1000 site where interferences due to dyke maintenance have been reported (Roth et al., 2011; Wissing et al., 2011), a decline in the CV values over cultivation time is noted (Fig. 3c). This can be explained by an increasing degree of paddy soil evolution and homogenization of SOM and minerogenic composition, accompanied by stabilization in soil microbial community structure. This establishment of quasi-continuous composition in conservative paddy soil biogeochemical parameters was established after only 300 yr of cultivation time.
The averages for labile parameters according to cultiva-tion age depicted in Fig. 3d show a much higher degree of variability, with the lower and upper boundaries of CV values for the 75 percentile ranging between 20 and 40 % (Fig. 3d). Outliers exceeding the 95 percentile are nitrate for the P50, DON for the P700, and ammonium for the P2000 site. All of these spatially highly variable param-eters are associated to reactive compounds of the nitrogen cycle and are highly influenced by spatially non-systematic human manipulation such as fertilization. Additionally, the presence of biopores and cracks in the plough pan could con-tribute to irregular leaching processes coupled with a high variability of these water soluble parameters within a field (Sander and Gerke, 2007). The approximately 20 times higher ammonium content in P2000 could have been induced by uneven manual application of nitrogen fertilizer and an inefficient field management practices just prior to sampling (see also Roth et al., 2011). Other indicators of nitrogen cy-cling in paddy soil including microbial N (CVavg=33 %),
C/N (CVavg=5 %), or δ15N (CVavg=3 %) behave stable
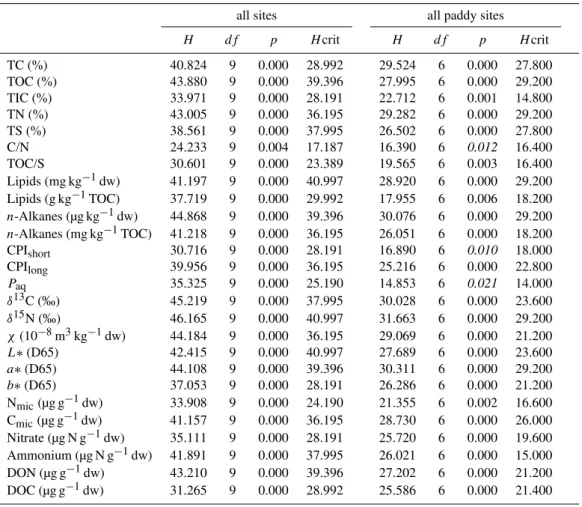
Table 2. Non-parametric variance analysis by Kruskal-Wallis test, suitable for non-normal distributed data sets, performed for all sites (n=49) and for paddy sites only (n=34). Significant variation between sites is indicated,H values from Chi-squared test exceed the criticalH-values of the null-hypothesis. Parameters indistinguishable between sites because intra-site variance exceeds inter-site variance are plotted in italic.
all sites all paddy sites
H df p Hcrit H df p Hcrit
TC (%) 40.824 9 0.000 28.992 29.524 6 0.000 27.800
TOC (%) 43.880 9 0.000 39.396 27.995 6 0.000 29.200
TIC (%) 33.971 9 0.000 28.191 22.712 6 0.001 14.800
TN (%) 43.005 9 0.000 36.195 29.282 6 0.000 29.200
TS (%) 38.561 9 0.000 37.995 26.502 6 0.000 27.800
C/N 24.233 9 0.004 17.187 16.390 6 0.012 16.400
TOC/S 30.601 9 0.000 23.389 19.565 6 0.003 16.400
Lipids (mg kg−1dw) 41.197 9 0.000 40.997 28.920 6 0.000 29.200
Lipids (g kg−1TOC) 37.719 9 0.000 29.992 17.955 6 0.006 18.200
n-Alkanes (µg kg−1dw) 44.868 9 0.000 39.396 30.076 6 0.000 29.200
n-Alkanes (mg kg−1TOC) 41.218 9 0.000 36.195 26.051 6 0.000 18.200
CPIshort 30.716 9 0.000 28.191 16.890 6 0.010 18.000
CPIlong 39.956 9 0.000 36.195 25.216 6 0.000 22.800
Paq 35.325 9 0.000 25.190 14.853 6 0.021 14.000
δ13C (‰) 45.219 9 0.000 37.995 30.028 6 0.000 23.600
δ15N (‰) 46.165 9 0.000 40.997 31.663 6 0.000 29.200
χ(10−8m3kg−1dw) 44.184 9 0.000 36.195 29.069 6 0.000 21.200
L∗(D65) 42.415 9 0.000 40.997 27.689 6 0.000 23.600
a∗(D65) 44.108 9 0.000 39.396 30.311 6 0.000 29.200
b∗(D65) 37.053 9 0.000 28.191 26.286 6 0.000 21.200
Nmic(µg g−1dw) 33.908 9 0.000 24.190 21.355 6 0.002 16.600
Cmic(µg g−1dw) 41.157 9 0.000 36.195 28.730 6 0.000 26.000
Nitrate (µg N g−1dw) 35.111 9 0.000 28.191 25.720 6 0.000 19.600 Ammonium (µg N g−1dw) 41.891 9 0.000 37.995 26.021 6 0.000 15.000
DON (µg g−1dw) 43.210 9 0.000 39.396 27.202 6 0.000 21.200
DOC (µg g−1dw) 31.265 9 0.000 28.992 25.586 6 0.000 21.400
3.3 Inter-site variability
Reliable identification of differences in biogeochemistry be-tween individual paddy fields and interpretation of evolution-ary trends according to cultivation time, physiogeographical properties, management practises, etc. can only be achieved, if the intra-site heterogeneity is smaller than inter-site dif-ferences in biogeochemistry. We thus tested individual pa-rameter relationships and applied statistical approaches to the entire data set employing PCA and non-parametric tests for variance analysis as well as the Kruskal-Wallis test to verify that inter-site exceeds intra-site variation. Finally, a cluster analysis was performed to elucidate, if duration of paddy soil management and associated soil evolution leads to establish-ment of robust clusters of comparable soil properties for the different paddies.
Examination of pairs of individual parameters revealed that in general values for each site clustered closely and only moderate overlap between site clusters occurred. This is ex-emplarily shown in Fig. 5a, b and c forδ13C vs.δ15N,χvs.
a∗andδ15N vs.Paq, respectively. The binary plots
demon-strate that individual single parameters often do not show a clear separation between sites, whereas addition of a second dimension allows full discrimination of the site clusters. The bulk isotope parameters show no overlap between site clus-ters and clearly separate the soils from the marine and limnic substrates (Fig. 5a). Soil magnetic susceptibility and colour parameters depending on minerogenic composition and ex-pression of redoximorph features also show clear separation of site clusters with little to no overlap (Fig. 5b), except for one outlier in soil colour at the FW site. Combinations of molecular compositional and isotope parameters are suitable for site differentiation also exhibiting less intra-site versus inter-site variability (Fig. 5c). Hereby the variance inPaq
ra-tios is substantially higher than forδ15N signatures. In gen-eral, overlap due to spread in one parameter is more frequent in young, less well developed or in disturbed soils (P1000).
(Gratton et al., 2000; Katsaounos et al., 2007; Lehndorff and Schwark, 2008). Including all sites and parameters the asymptotic significance gavep <0.001, except for the C/N ratio where a value of 0.004 was reached (Table 2), indicating that sites are less well distinguishable. Nevertheless the crit-icalH values for all sites did not exceed theH-values pro-posed for the null-hypothesis (Table 2), implying that a full discrimination of all sites using median values of any of the selected parameters was possible. If the data set was reduced to contain only the paddy sites, i.e. P500, TW, and FW ex-cluded (Table 2), asymptotic significance values for the C/N, CPIshortandPaq-ratios forp >0.01 could not be met.
Fur-thermore, the median-referred criticalH-values exceeded the H-values for the following parameters: TS, C/N, TOC, ex-tract yield and CPIshort(Table 2), indicating that the intra-site
variance was comparable to or exceeded inter-site variance. As most of these parameters represent concentrations that are primarily related to the absolute amount of soil organic mat-ter rather than its compositional differences, a discrimination of sites using these such indicators is not feasible.
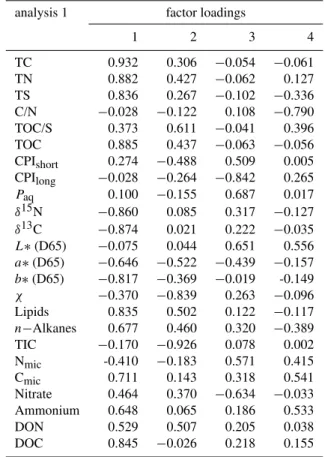
Application of principal component analysis allows evalu-ating the entire data set and was carried out on all paddy soils using all parameters determined (Fig. 5d), and for all paddy soils employing conservative parameters only (Fig. 5e). A full discrimination of all sites was achieved (Fig. 5d), when using the 1st and 2nd regression factors of all parameters, explaining 39.8 and 17.3 % of variance in the data set (Ta-ble 3). Factor 1 exhibits highest loading by parameters as-sociated with soil organic matter concentration, whereas the 2nd factor is primarily controlled by minerogenic composi-tion parameters (Table 3). No overlap of parametric values between the individual sites was observed, which was taken as direct evidence that the intrinsic heterogeneity of paddy soil does not exclude detailed interpretation of biogeochem-ical differences between sites.
If the data set was reduced to the conservatively behaving parameters, the discriminative power was reduced (Fig. 5e), whereby preferentially overlap for younger sites was ob-served. The 1st and 2nd regression factors for the data re-stricted to conservative parameters explain 50.6 and 14.2 % of the variability and are controlled by organic matter con-centration andn-alkane compositions, respectively (Table 4). The similarity in biogeochemical properties concerning the conservative parameters, in particular for the P50 and P100 sites, can be attributed to the low evolutionary stage of the paddy soils. All sites under paddy cultivation for 300 yr and more have developed individual soil characteristics as men-tioned above when discussing CV for individual age classes. Not only the duration of paddy soil utilization is of criti-cal importance but also the individual management practice. Two sites used for 50 yr of rice cultivation were investigated, whereby one of these sites was used as nursery (P50N) for growing rice seedling prior to transplantation. As the P50N site is consistently kept under flooded conditions, soil evo-lution proceeds differently from the P50 site. This allows
Table 3. Factor loadings table obtained from PCA performed with
all paddy soils and all parameters illustrated in Fig. 5d.
analysis 1 factor loadings
1 2 3 4
TC 0.932 0.306 −0.054 −0.061
TN 0.882 0.427 −0.062 0.127
TS 0.836 0.267 −0.102 −0.336
C/N −0.028 −0.122 0.108 −0.790
TOC/S 0.373 0.611 −0.041 0.396
TOC 0.885 0.437 −0.063 −0.056
CPIshort 0.274 −0.488 0.509 0.005
CPIlong −0.028 −0.264 −0.842 0.265
Paq 0.100 −0.155 0.687 0.017
δ15N −0.860 0.085 0.317 −0.127
δ13C −0.874 0.021 0.222 −0.035
L∗(D65) −0.075 0.044 0.651 0.556
a∗(D65) −0.646 −0.522 −0.439 −0.157
b∗(D65) −0.817 −0.369 −0.019 -0.149
χ −0.370 −0.839 0.263 −0.096
Lipids 0.835 0.502 0.122 −0.117
n−Alkanes 0.677 0.460 0.320 −0.389
TIC −0.170 −0.926 0.078 0.002
Nmic -0.410 −0.183 0.571 0.415
Cmic 0.711 0.143 0.318 0.541
Nitrate 0.464 0.370 −0.634 −0.033
Ammonium 0.648 0.065 0.186 0.533
DON 0.529 0.507 0.205 0.038
DOC 0.845 −0.026 0.218 0.155
full discrimination of the P50N from the P50 and P100 sites, whereas the latter two do show considerable overlap, when PCA is conducted (Fig. 5e).
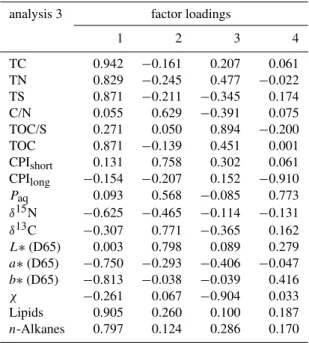
Including the reference substrates in PCA for the con-servative parameters reveals a more pronounced differenti-ation of the substrates from the soils that develop on them when 2nd factor and 3rd factor extracted by PCA, explaining 18.3 % and 17.0 percent of the variance (Table 5) are used for discrimination (Fig. 5f). The abandonment of factor 1 ex-plaining 37.93 percent of variance in the regression analysis leads to incomplete separation of the individual paddy sites emphasizing the importance of this factor in discriminant analysis. The properties exhibiting the highest loading scores on the 1st factor are organic matter concentration-related, those for the 2nd factor are governed by alkane composition, isotope signature and soil brightness, those for the 3rd fac-tor are dominated by properties linked to redox-conditions (Table 5).
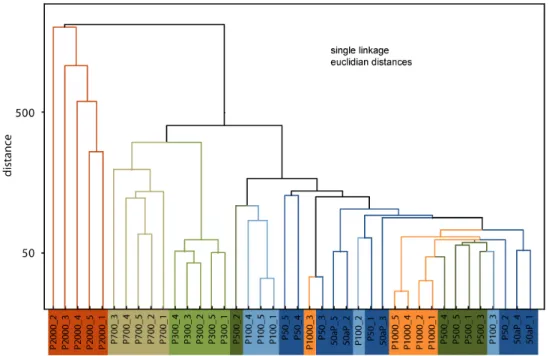
Fig. 6.Cluster diagram for paddy soils and non-paddy soil P500, constructed using all parameters.
Table 4. Factor loadings table obtained from PCA performed with
all paddy soils and all conservative parameters illustrated in Fig. 5e.
analysis 2 factor loadings
1 2 3 4
TC 0.987 0.009 0.006 −0.018
TN 0.964 0.028 −0.191 −0.111
TS 0.897 0.001 0.304 −0.051
C/N -0.019 0.137 0.815 0.035
TOC/S 0.533 0.093 −0.512 −0.383
TOC 0.983 0.052 −0.018 −0.133
CPIshort 0.094 0.195 −0.025 0.812 CPIlong −0.064 −0.909 −0.173 −0.101
Paq −0.008 0.608 −0.133 0.532
δ15N −0.799 0.383 0.170 −0.249
δ13C −0.840 0.322 0.006 −0.158
L∗(D65) −0.106 0.579 −0.617 0.233
a∗(D65) −0.748 −0.543 0.283 0.047
b∗(D65) −0.899 −0.081 0.233 0.036
χ −0.614 −0.054 0.230 0.654
Lipids 0.950 0.247 0.031 −0.141
n-Alkanes 0.796 0.445 0.306 −0.106
appropriately, whereas the younger soils exhibit insufficient development of individual biogeochemical paddy soil char-acteristics. Contamination of the P700 site did not lead to a significant change in time-integrated basic soil biogeochemi-cal parameters but preferentially affected the aliphatic hydro-carbon composition. This indicates that the addition of the
petroleum contaminants did not detrimentally affect the soil microbial community or inhibited plant growth by adding toxic substances or providing alternative substrates for mi-crobial utilization. Seen from a temporal perspective, the P700 site acquired its biogeochemical profile over a time span of about 700 yr, whereas the minor petroleum contam-ination is assumed to have occurred only a few years ago and thus has negligible influence on the overall biogeochem-ical status. In a similar but opposite fashion, the P500 site reveals the cumulative biogeochemical characteristics of al-most 500 yr of use as upland cropping site and only recently (approx. 3 yr before sampling) was converted to a paddy field. Consequently, this site still exhibits the time-integrated features of a non-paddy land management and clusters with the very young paddies (P50, P50N, P100) developed on a marine tidal substrate (Fig. 6). Similarly, the P1000 site, though continuously utilized as paddy field, groups with the young soils due to repetitive removal of surface soils and di-lution with soil material of non-paddy origin. Both of these sites, the P500 as well as P1000 exhibit four subsamples of close similarity and one subsample of largely deviating char-acter, indicating the large intra-site variation caused by hu-man interference.
Table 5. Factor loadings table obtained from PCA performed with all sites and all conservative parameters illustrated in Fig. 5f.
analysis 3 factor loadings
1 2 3 4
TC 0.942 −0.161 0.207 0.061
TN 0.829 −0.245 0.477 −0.022
TS 0.871 −0.211 −0.345 0.174
C/N 0.055 0.629 −0.391 0.075
TOC/S 0.271 0.050 0.894 −0.200
TOC 0.871 −0.139 0.451 0.001
CPIshort 0.131 0.758 0.302 0.061
CPIlong −0.154 −0.207 0.152 −0.910
Paq 0.093 0.568 −0.085 0.773
δ15N −0.625 −0.465 −0.114 −0.131
δ13C −0.307 0.771 −0.365 0.162
L∗(D65) 0.003 0.798 0.089 0.279
a∗(D65) −0.750 −0.293 −0.406 −0.047
b∗(D65) −0.813 −0.038 −0.039 0.416
χ −0.261 0.067 −0.904 0.033
Lipids 0.905 0.260 0.100 0.187
n-Alkanes 0.797 0.124 0.286 0.170
3.4 Organic matter accumulation trends
The environmental budget of paddy soils is under debate and considered to show a negative balance due to the emission of greenhouse gases and intensive nitrate loss from paddies (IPPC, 2007; Conrad, 2009; Koegel-Knabner et al., 2010). On the other hand a positive balance could be attributed to paddy soils based on atmospheric CO2sequestration via
surface soil accumulation and preservation of fresh photo-synthate. Organic carbon accumulation in Chinese paddy ecosystems has been investigated for different locations, cli-mates, soil substrates, and management systems (Cheng et al., 2009; Pan et al., 2003; Wissing et al., 2011; Wu, 2011). The results obtained in this study cannot be generalized to global scale or taken to represent a Chinese paddy soil carbon budget as the Zhejiang land reclamation area with about 1500 km2 of paddy rice cropping only represents a very minor fraction of the total wetland rice cropping area of 156×106ha (R. Jahn, personal communication, 2011). Wu (2011) identified generally higher organic carbon stocks in paddy soils than in other arable land-use types in differ-ent landscapes of China, attributed to slower organic mat-ter degradation rate under anaerobic conditions (Lal et al., 2002). The chronosequence studied here offers the oppor-tunity to evaluate CO2 sequestration in paddies,
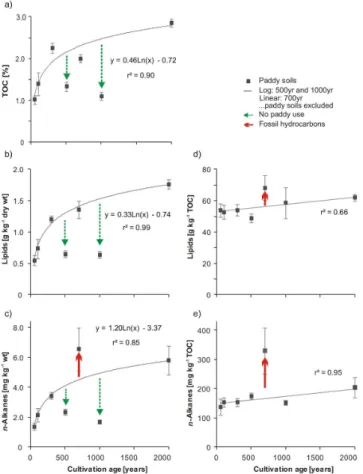
compari-son with non-paddy sites (P500) and interferences via inten-tional management (P1000) or uninteninten-tional contamination (P700). At all sites paddy soils developed on the same tidal flat sediments and land management practices were compara-ble. The accumulation trends for TOC, lipids andn-alkanes
over cultivation time are shown in Fig. 7a–c, complemented by the accumulation of lipids and alkanes normalized to TOC (Fig. 7d and e). The TOC concentrations of paddy soil reach approx. 1 % after 50 yr of cultivation, i.e. more than dou-ble the concentration of the parent substrate (Tadou-ble 1). In-crease in TOC continues to be rapid (Targulian and Krasil-nikov, 2007) until about 300 yr and levels off to reach max-imum concentrations after 2000 yr of cultivation. Severely lower TOC concentrations are noted for the P500 site, which might indicate a use as non-paddy for a longer period and thus much less TOC compared to a paddy soil has accu-mulated. Comparison of paddy and non-paddy soils from the same chronosequence revealed significantly higher or-ganic carbon contents in paddy soils, whereas in non-paddy soils no increase in organic matter accumulation upon long-term utilization was observed (Cheng et al., 2009; R. Jahn, personal communication, 2011). The P1000 site is assumed to have accumulated TOC continuously but has lost about 50 to 70 % of this TOC due to human interference as also ob-served in Wissing et al. (2011).
The lipid concentration of the paddy soils reveals a simi-lar accumulation pattern though solvent extractable lipids are less stable than recalcitrant TOC (Wiesenberg et al., 2004; Marschner et al., 2008) that includes non-extractable frac-tions, e.g. black carbon from incomplete combustion of rice straw. Normalization of lipid yield to soil TOC indicates that these constitute approx. 5 to 6 % of the organic carbon (Fig. 7d) and that the relative concentration increases with cultivation age. This indicates that the labile proportion of organic input into paddy soils and/or the standing microbial biomass is better preserved in long cultivated paddy soils.
The n-alkane accumulation trends exhibit not only neg-ative perturbations as did TOC and lipid yield but also a pronounced increase at the P700 site due to fossil fuel con-tamination (Fig. 7c). This externally addedn-alkane fraction even increases in proportion, if normalized to TOC concen-trations (Fig. 7e). Exclusion of the P700 site still results in an increase of n-alkanes over time, which is explained by the lower mineralization ofn-alkanes compared to function-alized lipids, e.g. fatty acids or alcohols. These components undergo oxidation and decarboxylation reactions upon dia-genesis, finally leading to generation and accumulation of n-alkanes. The stability and turnover times ofn-alkanes in paddy soils have not yet been studied and due to intensive re-dox cycling may deviate from upland arable and grassland soils. The former were shown to have turnover times for n-alkanes slightly shorter than total organic carbon (Wiesen-berg et al., 2004) whereas under the latter conditions then -alkanes may remain even more stable than total soil organic matter (Wiesenberg et al., 2008).
Fig. 7. Accumulation trends of(a)TOC,(b)lipid yield and(c)n -alkane yield normalized to dry sample weight and(d)lipid yield and
(e)n-alkane yield normalized to TOC over cultivation time. Arrows denote deviations from natural accumulation trends due to human disturbance of the paddy soil system. The P500 was used as upland field and only recently converted to paddy soil use, the P1000 site experienced topsoil removal and admixture of other soil material in the course of dyke maintenance work, the P700 site suffers from petroleum contamination.
comparison ofn-alkane distributions with recent reference crops, at the P500 site revealed this site to have been used as upland field for prolonged periods. Exceptional concen-trations and compositional differences in aliphatic hydrocar-bons, in particularn-alkanes, hopanes and UCM identify hu-man perturbations of the soil ecosystem by petroleum con-tamination.
4 Conclusions
Biogeochemical proxies determined on five field replicates of paddy soils differing in cultivation age and two substrates on which these paddy soils evolved showed that the intrinsic heterogeneity of paddy soil organic and minerogenic compo-nents is smaller than differences in biogeochemical proper-ties between study sites. This conclusion was drawn based
on interpretation of individual parameters, descriptive and non-parametric statistical analysis, PCA and cluster analysis. The coefficient of variation for conservative parameters de-termined in pentuplicate and reflecting time-integrated evo-lution of soil properties in general was 10 % or lower. Based on this study, collection of one composite field sample is considered sufficient for generation of representative biogeo-chemical data in paddy soils. In field heterogeneity of fast cycling and anthropogenically amended nutrients was found very high with coefficients of variation usually between 20 and 40 % and frequent outliers. Sampling strategies cover-ing the heterogeneity of such parameters will require much higher sampling frequency and spatial resolution.
Biogeochemical properties acquired by paddy soils over centennial periods of time behave conservatively and do adapt not rapidly, if management conditions or practices are altered. Hence, previous historic land use or management practices can be reconstructed, even after new utilization has been established.
Duration of cultivation as paddy soil leads to establish-ment of specific soil characteristics that become increasingly stable with cultivation time. For paddies evolving on marine tidal substrates as in this study, the full development of paddy biogeochemical signatures was completed in less than 300 yr. The environmental/ecological budget of paddy soils in the coastal Zhejiang land reclamation area studied here revealed a positive balance, when sequestration of atmospheric CO2
was considered. Paddy soils show a strong organic matter accumulation trend during 2000 yr paddy cultivation, which indicates the sequestration of atmospheric CO2. The
environ-mental/ ecological budget is only of local importance, due to soils evolving in a highly specific environment. Perturbation of paddy soils leading to severely reduced sequestration po-tential can be identified by application of molecular source proxies. Thus the integrity of the carbon accumulation his-tory of paddy soils in unknown areas can be critically evalu-ated.
Acknowledgements. We thank the German Research Foundation (DFG) for financial support (Schw554/20). Chinese and German partners of Research Initiative FOR 995 are thanked for field work collaboration. We appreciate analytical assistance by laboratory staff at Cologne University. We thank R. Jahn, for support and providing information on sample location.
Edited by: K. K¨usel
References
Bai, Q., Gattinger, A., and Zelles, L.: Characterization of microbial consortia in paddy rice soil by phospholipid analysis, Microb. Ecol., 39, 273–281, 2000.
ammonia-oxidizing community in flooded soils, Biol. Fertil. Soils, 47, 834–843, doi:10.1007/s00374-011-0552-6, 2011a. Bannert, A., Kleineidam, K., Wissing, L., Mueller-Niggemann, C.,
Vogelsang, V., Welzl, G., Cao, Z-H., and Schloter, M.: Changes in diversity and functional gene abundances of microbial com-munities involved in nitrogen fixation, nitrification and denitrifi-cation comparing a tidal wetland to paddy soils cultivated for dif-ferent time periods, Appl. Environ. Microbiol., 77, 6109–6116, doi:10.1128/AEM.01751-10, 2011b.
Bastow, T., van Aarssen, B. G. K., and Lang, D.: Rapid small-scale separation of saturate, aromatic and polar components in petroleum, Org. Geochem., 38, 1235–1250, 2007.
Bray, E. E. and Evans, E. D.: Distribution ofn−paraffins as a clue to recognition of source beds, Geochim. Cosmochim. Acta, 22, 2–15, 1961.
Chantigny, M. H., Pr´evost, D., Angers, D. A., V´ezina, L.-P., and Chalifour, F. P.: Microbial biomass and N transformations in two soils cropped with annual and perennial species, Biol. Fert. Soils, 21, 239–244, 1996.
Chen, L-M., Zhang, G-L., and Effland, W. R.: Soil Chracteristic Response Times and Pedogenic Thresholds during the 1000-Year Evolution of a Paddy Soil Chronosequence, Soil Sci. Soc. Am. J., 75, 1807–1820, 2011.
Cheng, Y-Q., Yang, L-Z., Cao, Z-H., Ci, E., and Yin, S.: Chronose-quential changes of selected pedogenic properties in paddy soils as compared with non-paddy soils, Geoderma, 151, 31–41, 2009. Conrad, R.: The global methane cycle: recent advances in under-standing the microbial processes involved, Environ. Microbiol. Reports, 1, 285–292, 2009.
Davidson, E. A., Hart, S. C., and Firestone, M. K.: Internal cy-cling of nitrate in soils of a mature coniferous forest, Ecology, 73, 1148–1156, 1992.
Dupuis, E. M. and Whalen, J. K.: Soil properties related to the spa-tial pattern of microbial biomass and respiration in agroecosys-tems, Canadian J. Soil Sci., 87, 479–484, 2007.
Edit Committee of Chorography of Cixi County: Chorography of Cixi County, Zhejiang, Peoples Express House, Hangzhou, 1992. Ficken, K. J., Li, B., Swain, D. L., and Eglinton, G.: Ann-alkane proxy for the sedimentary input of submerged/floating freshwater aquatic macrophytes, Org. Geochem., 31, 745–749, 2000. Gratton, W. S., Nkongolo, K. K., and Spiers, G. A.: Heavy metal
accumulation in soil and Jack Pine (Pinus banksiana) needles in Sudbury, Ontario, Canada, B. Environ. Contam. Tox., 64, 550– 557, 2000.
Hua, X. L. and Zhu, H.: Ningbo Yearbook, Publishing House of China (Zhong Hua Shu Ju), Beijing, 2000 (in Chinese). IPPC: Fourth Assessment Report: Climate Change 2007,
avail-able at: http://www.ipcc.ch/publications and data/publications and data reports.shtml (last access: March 2011), 2007. IRRI: available at: http://www.knowledgebank.irri.org (last access:
September 2011), 2010.
Jilan, D. and Kangshan, W.: Changjiang river plume and suspended sediment transport in Hangzhou Bay, Cont. Shelf Res., 9, 93– 111, 1989.
J¨orgensen, R. and Brookes, P.: Die Bestimmung der mikro-biellen Biomasse des Bodens mit der Fumigations-Extraktions-Methode, VDLUFA-Schriftenreihe, 666–671, 1991.
Kalbitz, K., Schmerwitz, J., Schwesig, D., and Matzner, E.: Biodegradation of soil-derived dissolved organic matter as
re-lated to its properties, Geoderma, 113, 273–291, 2003.
Katsaounos, C. Z., Giokas, D. L., Vlessidis, A. G., and Karayan-nis, M. I.: Identification of longitudinal and temporal patterns of phosphorus fractionation in river sediments by non-parametric statistics and pattern recognition techniques, Desalination, 213, 311–333, 2007.
Koegel-Knabner, I., Amelung, W., Cao, Z-H., Fiedler, S., Frenzel, P., Jahn, R., Kalbitz, K., Koelbl, A., and Schloter, M.: Biogeo-chemistry of paddy soils, Geoderma, 157, 1–14, 2010.
Kuhn, T. K., Krull, E. S., Bowater, A., Grice, K., and Gleixner, G.: The occurrence of short chain n-alkanes with an even over odd predominance in higher plants and soils, Org. Geochem., 41, 88– 95, 2010.
Lal, R.: Soil carbon sequestration in China through agricultural in-tensification, and restoration of degraded and desertified ecosys-tems, Land Degrad. Dev., 13, 469–478, 2002.
Lehndorff, E. and Schwark, L.: Accumulation histories of major and trace elements on pine needles as function of air quality, At-mos. Environ., 42, 833–845, 2008.
Lennartz, B., Horn, R., Duttmann, R., Gerke, H. H., Tippk¨otter, R., Eickhorst, T., Janssen, I., Janssen, M., R¨uth, B., Sander, T., Shi, X., Sumfleth, K., Taubner, H., and Zhang, B.: Ecological safe management of terraced rice paddy landscapes, Soil Till. Res., 102, 179–192, 2009.
Li, L., Zhang, X., Zhang, P., Zheng, J., and Pan, G.: Variation of or-ganic carbon and nitrogen in aggregate size fractions of a paddy soil under fertilisation practices from Tai Lake Region, China, J. Sci. Food Agr., 87, 1052–1058, 2007.
Li, X., Mander, ¨U., Ma, Z., and Jia, Y.: Water quality problems and potential for wetlands as treatment systems in the Yangtze River Delta, China, The Society of Wetland Scientists, 29, 1125–1132, 2009.
Marschner, B., Brodowski, S., Dreves, A., Gleixner, G., Gude, A., Grootes, P. M., Hamer, U., Heim, A., Jandl, G., Ji, R., Kaiser, K., Kalbitz, K., Kramer, C., Leinweber, P., Rethemeyer, J., Sch¨affer, A., Schmidt, M. W. I., Schwark, L., and Wiesenberg, G. L. B.: How relevant is recalcitrance for the stabilization of organic mat-ter in soils?, J. Plant Nutr. Soil Sc., 171, 91–10, 2008.
Mullins, C. E.: Magnetic-susceptibility of soils and its significance in soil science-review, Int. J. Soil Sci., 28, 223–246, 1977. Myrold, D. D. and Tiedje, J. M.: Simultaneous estimation of
sev-eral nitrogen cycle rates using 15N: Theory and application, Soil Biol. Biochem., 18, 559–568, 1986.
Ourisson, G., Rohmer, M., and Poralla, K.: Prokaryotic hopanoids and other polyterpenoid sterol surrogates, Ann. Rev. Microbiol., 41, 301–333, 1987.
Pan, G., Li, L., Wu, L., and Zhang, X.: Storage and sequestration potential of topsoil organic carbon in China’s paddy soils, Glob. Change Biol., 10, 79–92, 2003.
Peters, K. E., Walters, C. C., and Moldowan, J. M.: The biomarker guide, volume 1 and 2: biomarkers and isotopes in the petroleum exploration and earth history, Cambridge University Press, Cam-bridge, 2005.
Ringrose-Voase, A. J., Kirby, J. M., Djoyowasito, G., Sanidad, W. B., Serrano, C., and Lando, T. M.: Changes to the physical prop-erties of soils puddled for rice during drying, Soil Till. Res., 56, 83–104, 2000.
Ac-cumulation of nitrogen and microbial residues during 2000 years of rice paddy and non-paddy soil development in the Yangtze River Delta, China, Global Biogeochem. Cy., 17, 3405–3417, doi:10.1111/j.1365-2486.2011.02500.x, 2011.
R¨uth, B. and Lennartz, B.: Spatial Variability of Soil Properties and Rice Yield Along Two Catenas in Southeast China, Pedosphere, 18, 409–420, 2008.
Sander, T. and Gerke, H. H.: Preferential Flow Patterns in Paddy Fields Using a Dye Tracer, Vadose Zone J., 6, 105–115, 2007. Schmitter, P., Dercon, G., Hilger, T., Thi Le Ha, T., Huu Thanh,
N., Lam, N., Duc Vien, T., and Cadisch, G.: Sediment induced soil spatial variation in paddy fields of Northwest Vietnam, Geo-derma, 155, 298–307, 2010.
Shrestha, R. K. and Ladha, J. K.: Nitrate in groundwater and in-tegration of nitrogen-catch crop in rice-sweet pepper cropping system, Soil Sci. Soc. Am. J., 62, 1610–1619, 1998.
Stark, J. M. and Hart, S. C.: High rates of nitrification and nitrate turnover in undisturbed coniferous forests, Nature, 385, 61–64, 1997.
Targulian, V. O. and Krasilnikov, P. V.: Soil system and pedogenic processes: Self-organization, time scales, and environmental significance, Catena, 71, 373–381, doi:10.1016/j.catena.2007.03.007, 2007.
Tatsuya, I., Goto, K., Iida, M., Nonami, K., Inoue, H., and Umeda, M.: Geostatistical analysis of yield, soil properties and crop man-agement practices in paddy rice fields, Plant Prod. Sci., 7, 230– 239, 2004.
Viscarra Rossel, R. A., Minasny, B., Roudier, P., and McBratney, A. B.: Colour space models for soil science, Geoderma, 133, 320–337, 2006.
Walker, L. R., Wardle, D. A., Bardgett, R. D., and Clarkson, B. D.: The use of chronosequences in studies of ecological succession and soil development, J. Ecol., 98, 725–736, 2010.
Wang, H., Zuosheng, Y., Saito, Y., and Liu, J. P.: Reconstruction of sediment flux from the Changjiang (Yangtze River) to the sea since the 1860s, J. Hydrol., 349, 318–332, 2008.
Wang, L., Wu, J. P., Liu, Y. X., Huang, H. G., and Fang, Q. F.: Spatial Variability of Micronutrients in Rice Grain and Paddy Soil, Pedosphere, 19, 748–755, 2009.
Wei, Y-C., Bai, Y-L., Jin, J-Y., Zhang, F., Zhang, L-P., and Liu, X-Q.: Spatial variability of soil chemical properties in the reclaim-ing marine foreland to Yellow Sea of China, Agr. Sci. China, 8, 1103–1111, 2009.
Wiesenberg, G. L. B., Schwarzbauer, J., Schmidt, M. W. I., and Schwark, L.: Sources and turnover rates of soil organic mat-ter derived from n-alkane/n-carboxylic acid compositions and C-isotope signatures, Org. Geochem., 35, 1371–1393, 2004.
Wiesenberg, G. L. B., Schwark, L., and Schmidt, M. W. I.: Ex-tractable lipids and colour in particle-size separates and bulk arable soils, Euro. Jo. Soil Sci., 57, 634–643, 2006.
Wiesenberg, G. L. B., Schwarzbauer, J., Schmidt, M. W. I., and Schwark, L.: Plant and soil lipid modifications under elevated atmospheric CO2 conditions: II. Stable carbon isotopic values (δ13C) and turnover, Org. Geochem., 39, 103–117, 2008. Wiesenberg, G. L. B., Lehndorff, E., and Schwark, L.: Thermal
degradation of rye and maize straw: lipid pattern changes as a function of temperature, Org. Geochem., 40, 167–174, 2009. Wissing, L., Koelbl, A., Vogelsang, V., Fu, J-R., Cao, Z-H., and
Koegel-Knabner, I.: Organic carbon accumulation in a 2000-year chronosequence of paddy soil evolution, Catena, 87, 376–385, doi:10.1016/j.catena.2011.07.007, 2011.
Wu, J.: Carbon accumulation in paddy ecosystems in subtropical China: evidence from landscape studies, Euro. J. Soil Sci., 62, 29–34, 2011.
Xi, D., Wang, Z., Gao, S., and De Vriend, H. J.: Modeling the tidal channel morphodynamics in a macro-tidal embayment, Hangzhou Bay, China, Cont. Shelf Res., 29, 1757–1767, 2009. Yanai, J., Lee, C. K., Kaho, T., Iida, M., Matsui, T., Umeda, M., and
Kosaki, T.: Geostatistical analysis of soil chemical properties and rice yield in a paddy field and application to the analysis of yield-determining factors, Soil Sci. Plant Nutr., 47, 291–301, 2001. Yu, Q., Yu, Y., You, A., Song, L., and Cao, Y.: Contemporary
evo-lution process of the Hangzhou Bay, International Conference on Estuaries and Coasts, November 9–11, Hangzhou, China, 2003. Zhang, M., He, Z., Zhao, A., Zhang, H., Endale, D. M., and
Schomberg, H. H.: Water extractable soil organic carbon and ni-trogen affected by tillage and manure application, Soil Sci., 176, 307–312, 2011.
Zhao, Y., Xu, X., Darilek, J. L., Huang, B., Sun, W., and Shi, X.: Spatial variability assessment of soil nutrients in an intense agri-cultural area, a case study of Rugao County in Yangtze River Delta Region, China, Environ. Geol., 57, 1089–1102, 2009. Zhou, P., Song, G., Pan, G., Li, L., and Zang, X.: Role of
chemi-cal protection by binding to oxyhydrates in SOC sequestration in three typical paddy soils under long-term agro-ecosystem exper-iments from South China, Geoderma, 153, 52–60, 2009. Zhu, J. G., Han, Y., Liu, G., Zhang, Y. L., and Shao, S. H.: Nitrogen