www.biogeosciences.net/8/1225/2011/ doi:10.5194/bg-8-1225-2011
© Author(s) 2011. CC Attribution 3.0 License.
Biogeosciences
Quantifying methane emissions from rice paddies in Northeast
China by integrating remote sensing mapping with a biogeochemical
model
Y. Zhang1, Y. Y. Wang2, S. L. Su3, and C. S. Li4
1Research Center of Remote Sensing & Geoscience, Northeast Institute of Geography & Agroecology, Chinese Academy of
Sciences, Changchun 130012, China
2Research Center for Wetland Ecology and Environment, Northeast Institute of Geography & Agroecology, Chinese
Academy of Sciences, Changchun 130012, China
3College of Environmental & Resources Sciences, Zhejiang University, Hangzhou 310029, China
4Institute for the Study of Earth, Oceans, and Space, University of New Hampshire, Durham, NH 03824, USA
Received: 19 December 2010 – Published in Biogeosciences Discuss.: 14 January 2011 Revised: 4 May 2011 – Accepted: 16 May 2011 – Published: 23 May 2011
Abstract.The Sanjiang Plain located in Northeastern China is one of the major rice producing regions in the country. However, differing from the majority rice regions in South-ern China, the Sanjinag Plain possesses a much cooler cli-mate. Could the rice paddies in this domain be an important source of global methane? To answer this question, methane (CH4)emissions from the region were calculated by
inte-grating remote sensing mapping with a process-based bio-geochemistry model, Denitrification and Decomposition or DNDC. To quantify regional CH4emissions from the plain,
the model was first tested against a two-year dataset of CH4
fluxes measured at a typical rice field within the domain. A sensitivity test was conducted to find out the most sen-sitive factors affecting CH4emissions in the region. Based
on the understanding gained from the validation and sensi-tivity tests, a geographic information system (GIS) database was constructed to hold the spatially differentiated input in-formation to drive DNDC for its regional simulations. The GIS database included a rice map derived from the Landsat TM images acquired in 2006, which provided crucial infor-mation about the spatial distribution of the rice fields within the domain of 10.93 million ha. The modeled results showed that the total 1.44 million ha of rice paddies in the plain emit-ted 0.48–0.58 Tg CH4-C in 2006 with spatially differentiated
annual emission rates ranging between 38.6–943.9 kg CH4
-C ha−1, which are comparable with that observed in Southern China. The modeled data indicated that the high SOC
con-Correspondence to:Y. Y. Wang ([email protected])
tents, long crop season and high rice biomass enhanced CH4
production in the cool paddies. The modeled results proved that the northern wetland agroecosystems could make impor-tant contributions to global greenhouse gas inventory.
1 Introduction
Among all of atmospheric components, methane (CH4)is
a major greenhouse gases (GHG). According to the Inter-governmental Panel on Climate Change (IPCC), the warm-ing forces of CH4are 25–30 times higher than that of CO2
per unit of weight based on 100-yr global warming potentials (IPCC, 2007). Although there is a significant declining trend in the rate of CH4increase over the last two decades
(Dlugo-kencky et al., 1998), atmospheric CH4concentrations have
risen to 1774 ppb in 2005, which is more than doubled over the past 300 years (Blake and Rowland, 1998; Etheridge et al., 1992; IPCC, 2007). Agricultural activities are responsi-ble for approximately 50 % of global atmospheric inputs of CH4(Scheehle and Kruger, 2006; USEPA, 2006), wherein
the rice paddies have been identified as a major sources of atmospheric CH4. Over 10 % of atmospheric CH4 was
at-tributed to the emissions from global rice paddies (Neue, 1993; Scheehle and Kruger, 2006; USEPA, 2006). From the perspective of GHG mitigation, it also becomes a poten-tial opportunity through reducing CH4emissions from paddy
fields (Oenema et al., 2001; Cole et al., 1996). Therefore, ac-curately estimating CH4emissions from rice paddies has
China is an important rice producing country, which pos-sesses approximately 20 % of the world’s rice paddies and produces 31 % of the world’s rice FAO, 2004). The 30 mil-lion ha of paddy rice cropland, accounting for 23 % of all cul-tivated land in China (Frolking et al., 2002), is a large CH4
source. To estimate the national inventory of CH4emission,
researchers have conducted field campaigns in the major rice producing areas in Southern and Southeast of China (Cai et al., 1999, 2000). Results indicated high fluxes and spatial variations of CH4 emitted from the tested rice areas (Van
Bodegom and Scholten, 2001; Verburg and Van Der Gon, 2001; Khalil et al., 1991; Yao et al., 1996; Cai et al., 2000). Attempts have been made to explain the regional variations of CH4emissions although no concrete conclusions about the
main controlling factors (Yao and Chen, 1994; Kern et al., 1997). Although traditional site-specific observation tech-niques like automatic closed chamber method have been re-cently improved for measuring CH4 emission at site scale,
the regional or global estimation still remains as a question due to the lack of reliable methodologies (Verburg et al., 2006). Consequently, demands are arising for new methods such as model simulations to extrapolate the understandings gained at site scale to a large spatial dimension.
During the past two decades, many empirical and physical models have been developed to predict GHG emissions from rice fields. In a number of empirical models, the regression relationships between CH4emission rate and rice biomass or
yield were used to estimate CH4 production (Sinha, 1995;
Kern et al., 1997; Anastasi et al., 1992). Although these em-pirical approaches were easy to use, the accuracy and pre-cision of estimated results could not be ensured, and the variation in emissions at regional scale also couldn’t be ex-plained reasonably. Since many biogeochemical processes are involved in CH4 production, oxidation and emission,
it would be difficult to predict the gas fluxes with over-simplified equations across a wide range of soil conditions and management practices. To meet the gaps, process-based biogeochemical models were developed to incorporate the comprehensive biogeochemical reactions and their environ-mental drivers. The major models that are able to simulate CH4production include MEM (Cao et al., 1995a), MERES
(Matthews et al., 2000), InfoCrop (Aggarwal et al., 2004), DNDC (Li et al., 1992a) and so on. In recent years, these models played an important role in describing CH4
produc-tion and oxidaproduc-tion process in paddies and estimating the CH4
emissions at regional or global scales (Cao et al., 1995b, 1996; Bachelet and Neue, 1993; Li et al., 2004; Pathak et al., 2005; Zhang et al., 2009a). Among the candidate mod-els, DNDC has been tested for the rice paddies in China and other Asian countries. We adopted DNDC in the study to implement the upscaling.
The Denitrification and Decomposition (DNDC) model is a generic model that simulates the biogeochemical processes leading to greenhouse gas emissions from soil. It is origi-nally developed to model N2O emissions and SOC levels in
the US cropping systems (Li et al., 1992a, 1992b, 1994), it has subsequently been adapted to model simulations of GHG emissions from a wide range of systems such like crop, pas-ture, rice paddy, and forest systems in a number of countries across the world (see a summary by Giltrap et al., 2010). As a process-based biogeochemical model, DNDC is able to track carbon (C) and nitrogen (N) cycles in agroecosys-tems driven by both the environmental factors and manage-ment practices. The DNDC has been tested against observed CO2, N2O or CH4fluxes from rice fields, and continuously
improved based on comments or suggestions from a wide range of researchers worldwide during the past about 20 years (Zhang et al., 2002; Li et al., 2002, 2004; Cai et al., 2003). Calibration and validation of the model were per-formed for the US, China, Thailand, India, Japan and Italy with satisfactory results (Zheng et al., 1997; Li et al., 2002; Cai et al., 2003; Babu et al., 2005, 2006). Recently, Pathak et al. (2005) applied the DNDC model to estimate total GHG emissions from Indian rice paddies based on agricultural cen-sus data. And also, Zhang et al. (2009a) quantified CH4
emissions from rice fields in the Taihu Lake region in China using DNDC. These studies proved that DNDC is applicable for estimating CH4emissions from rice paddies at regional
scale.
In the study reported in the paper, we decided to take a new step to advance the DNDC regional applications. Re-mote sensing technology is capable of providing spatially explicit information of land surface in time. Remote sens-ing analysis could provide more accurate rice field area data to supplement the census data which are often inadequate or problematic. In fact, many researchers have utilized re-motely sensed data (optical or microwave) for mapping the extent of paddy rice at local or regional scale (Frolking et al., 2002; Xiao et al., 2005; Le Toan et al., 1997; Ribbes and Le Toan, 1999; Zhang et al., 2009b). DNDC has been discussed for upsacling in add of the remote sensing technique to com-pile greenhouse gas inventories, identify spatial patterns in emission, or explore scenarios for mitigation (Takeuchi et al., 2001; Salas et al., 2007).
Except the introduction of remote sensing analysis into the DNDC upscaling, we selected a northern paddy rice domain in China, which possesses climate, soil and management conditions differing from that in the tropical or subtropical rice regions, which have been studied by other researchers.
2 Method 2.1 Study area
Fig. 1. Spatial distribution of paddy rice in the Sanjiang Plain in 2006.
Table 1.Remotely sensed imagery used for mapping rice paddy.
Sensor Path/Row No. Acquisition date
Landsat TM
114/26 30/08/2006
114/27 30/08/2006
114/28 30/08/2006
114/29 30/08/2006
115/27 22/09/2006
115/28 22/09/2006
115/29 22/09/2006
116/27 31/08/2006
116/28 31/08/2006
of the eastern part of Heilongjiang Province (48.5◦–43.8◦N
and 129.2◦–135.1◦E) (Fig. 1). This region lies at 45 m to
60 m geographic elevation above sea level with a gentle and flat topographic relief. Annual precipitation ranged from 310 to 750 mm during the period of 1980–2009. The local soils are fertile rich in soil organic matter. The flat topography, abundant precipitation and fertile soils have made the allu-vial plain favorable for agricultural cultivation. In the 1970s reclamation campaigns were launched by the Chinese au-thorities to convert the natural swamplands into farmlands. Since then, the region has experienced drastic changes in the land use. For example, the rice fields have increased from zero to 1.44 million ha during the past about 40 years. The rice fields are the rice-producing region with the highest lat-itude in not only China but also the world.
The rice is planted as a single-season crop in the region. Continuously flooding is extensively practiced in the rice fields. Urea and synthetic fertilizer are predominantly ap-plied without any organic matter amended. The rice straw is normally left as stubble in the fields after harvest in Octo-ber, and the stubble is incorporated into the soils with tillage before the beginning of the next rice season.
2.2 Model validation tests
To validate the DNDC model for its applicability for the rice fields in the Sanjiang Plain, field experiments were con-ducted at a paddy rice site in the Honghe Farm (at 47◦35′N and 133◦31′E) within the plain (Fig. 1). Two-year (2004 and 2006) experiments were conducted in a same paddy field with three treatments. In 2004, the field was treated with two fertilizer application rates, i.e., 60 and 150 kg N ha−1
(C04-N60 and C04-N150); in 2006, only one application rate, 150 kg N ha−1(C06-N150), was applied. For C04-N60, the 60 kg N of synthetic fertilizer was split into two applications at the rice transplanting (24 kg N ha−1) and in the tillering stage (36 kg N ha−1). The same split method was also ap-plied for the rate of 150 kg N ha−1(Table 2). CH4fluxes were
measured with chamber method (0.5 m×0.5 m) with auto-mated opening and closure. The CH4 measurements were
conducted twice per week through the whole rice-growing period (from late May to early October) (see details in Wang et al., 2008). The measured data of CH4 fluxes were used
to calibrate/validate the DNDC model. Daily meteorological data (air temperature and precipitation) were acquired from the local climate station, a part of the Ecological Experimen-tal Station of Mire-Wetland in the Sanjiang Plain run by the Chinese Academy of Science. Soil properties were obtained from the ground-based measurements, and agricultural man-agement information was collected based on the local farm-ing practices (see details in Tables 2 and 3).
DNDC simulates CH4 production mainly based on four
factors, i.e., the soil redox potential (Eh), soil C sources (DOC and CO2)available for the methanogens, soil
tem-perature, and CH4diffusion rate which is controlled by the
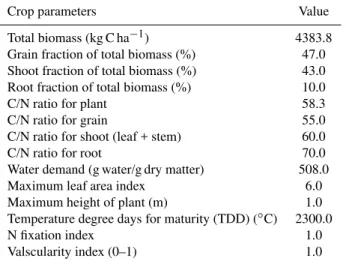
plant conductivity (aerenchyma) and soil texture (Li, 2000). Among the factors, plant (i.e., rice) growth plays a key role in determining the soil C availability. So, the parameters defin-ing the rice growth in DNDC were first calibrated against observed crop biomass/yield data. Using the turn-and-adjust method, we obtained a set of physiological and phenology parameters for the rice cultivar (Kongyu-131) which was widely planted in the Sanjiang Plain. The calibrated crop parameters are listed in Table 4. With the crop parame-ters, DNDC correctly simulated the crop biomass growth and yield and hence set a sound basis to quantify the root exuda-tion and respiraexuda-tion, which provided DOC and CO2 to the
Table 2.Management information on the rice paddies at study sites in Sanjiang Plain of Northeast China.
Mode C04-N60 C04-N150 C06-N150
Tillage 5/15: Plow depth of 30 cm 5/15: Plow depth of 30 cm 5/14: Plow depth of 30 cm
Rice cultivation 5/25–9/29 5/25–9/29 5/24–9/24
Flooding 5/15–8/23: Continuously 5/15–8/23: Continuously 5/14–8/28: Continuously
flooding, water depth flooding, water depth flooding, water depth
of 5–10 cm of 5–10 cm of 5–10 cm
Fertilization 6/13: Synthetic fertilizer 6/13: Urea + Synthetic 5/24: Urea + Synthetic
(24 kg N ha−1); 6/28: fertilizer (60 kg N ha−1); fertilizer (60 kg N ha−1); 7/2: Synthetic fertilizer (36 kg N ha−1) 6/28: Urea (90 kg N ha−1) Urea (90 kg N ha−1)
Manure application No No No
Residues management Fraction of residues left Fraction of residues left Fraction of residues left
in fields: 20 % in fields: 20 % in fields: 20 %
Table 3.Inputs used to test the DNDC model and baseline values for sensitivity tests in the validated sites of rice paddies.
Environmental Factors Baseline value Range tested
Climate Annual mean temperature (
◦C) 2.4 0.4–4.4
Total annual precipitation (mm) 560 448–672
Soil Property
Clay fraction (%) 0.41 0.1–0.6
Field capacity (%) 0.57 Not varied
Wilting point (%) 0.27 Not varied
Porosity (%) 0.59 Not varied
Initial soil C fraction (kg C kg−1soil) 0.0277 0.01–0.07
Bulk density (g cm−3) 0.98 0.8–1.6
Soil pH 5.61 5.0–9.0
Management Practices
Depth of continuous flooding water (cm) 10 Not varied
Drained days (d) 0 2–12
Fraction of rice residue left in field (%) 20 0–100
N-Fertilizer application (kg N ha−1) 60 60.0–150.0
For the model validation, the local climate, soil and farm-ing management data were utilized to compose input sce-narios, which were used to run DNDC for the experimen-tal site. The measured CH4flux data were used to compare
with the modeled CH4 fluxes at daily time step as well as
for the seasonal total emissions. Statistical tools such as the root mean square error (RMSE), the coefficient of model effi-ciency (EF) and the coefficient of model determination (CD) were adopted to assess the “goodness of fit” of model predic-tions (see details in Smith et al., 1997). The three “goodness of fit” measures were calculated separately as below:
RMSE= s
(Fsimulated−Fobserved)2
n (1)
EF=
n
P
i=1
Oi− ¯O
2
−
n
P
i=1
(Si−Oi)2 n
P
i=1
Oi− ¯O
2 (2)
CD=
n
X
i=1
(Oi− ¯O)2/ n
X
i=1
(Si− ¯O)2 (3)
Where,Fsimulatied andFobserved in Eq. (1) denotes the
sim-ulated and the observed CH4 fluxes at validation sites;nis
the total number of observations. In Eq. (2 and 3),Oi are
the observed CH4fluxes,O¯is the mean of the observed CH4
fluxes, Si are the simulated CH4 fluxes, and nis the
to 0. When a CD value of 1 or above, it indicates that the model describes the measured data better than the mean of the observations. Taken together, EF and CD allow RMSE to be further interpreted where standard error values of the measurements are unavailable.
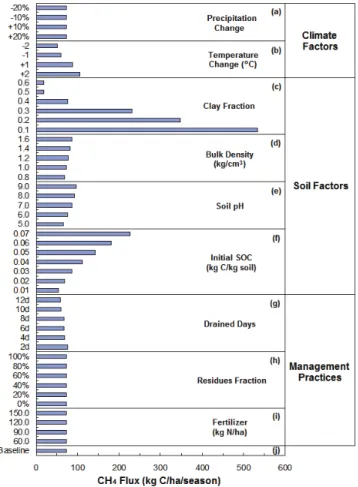
2.3 Model sensitivity test
Methane emissions from rice fields are controlled by many factors (Yan et al., 2005). However, some factors could be more sensitive than others. A sensitivity test was conducted with DNDC to find out the most sensitive factors for CH4
emissions from the Sanjiang Plain. The baseline scenario was set based on the actual climate, soil and management conditions at the experimental site in the Sanjiang Plain. In the test, we varied climate variables (temperature or precip-itation), soil properties (SOC content, clay fraction, pH and bulk density), or agricultural management practices (flood-ing regime, residue management and N-fertilizer application rate). The sensitivity test was conducted by varying a single input parameter in a predefined range while keeping all other input parameters constant. All the parameters for sensitiv-ity analysis were listed in Table 3. The model responses to changes of these factors on CH4emissions were presented
respectively in Fig. 2.
The likely response of CH4emission to changes in climate
was investigated by running DNDC using alternative climate scenarios. Precipitation was either increased or decreased by 20 % of the baseline value (∼560 mm yr−1); and temperature was varied by 1 or 2◦C. The modeled results indicated that (1) the precipitation changes had was insignificant or negli-gible impact on CH4emissions (Fig. 2a), and (2) the higher
temperature elevated CH4 emissions due to the accelerated
soil organic matter (SOM) decomposition and fermentation process (Fig. 2b). The results are in agreement with previous studies reported by other researchers (e.g., Cao et al., 1998). Four soil properties (SOC content, clay fraction, pH and bulk density) were investigated in the sensitivity test. The re-sults showed that (1) soil texture was the most sensitive factor due to its effects on the soil anaerobic status: the clay loam soil was more likely to produce more CH4 than the sandy
soil (Fig. 2c), and (2) SOC content was the second most sen-sitive factor due its effects on the soil DOC availability as well as the methanogen population (Fig. 2f). The modeled results in line with observations reported by other researchers (Yagi and Minami, 1990; Wassmann et al., 1998; Holzapfel-Pschorn and Seiler, 1986; Li et al., 2004).
In rice paddy, flooding regime, residue management and application rate of N-fertilizer are three major anthropogenic activities affecting not only rice productivity but also GHG emissions. Figure 2 shows that when the draining time du-ration for the mid-season drainage increased to 10 days, the CH4emission was reduced by 25 % (Fig. 2g). This trend has
been reported in many studies (Sass et al., 1992; Yagi et al., 1996; Li et al., 2006). In the test, crop straw incorporation
Fig. 2. Sensitivity tests of environment factors driving CH4 emis-sions from rice paddies.
didn’t show strong effect on CH4emission. The modeled
re-sults indicated that in the one-year simulation, the straw was incorporated at the end of the rice season when the soil was drained already (Fig. 2h). The variation in fertilizer applica-tion rate didn’t show strong impact on CH4 emission either
(Fig. 2i).
The sensitivity test provided crucial information for re-gional simulations as we learnt which input parameters could most sensitively affect the modeled results and hence should be paid with the greatest considerations.
2.4 Regional database
A geographic information system (GIS) database was con-structed to hold all the input information required for upscal-ing DNDC simulations to the Sanjinag Plain. The database included a rice field map, soil properties, daily weather data, and farming management practices. The rice map was ob-tained through remote sensing analysis.
To estimate the CH4emissions from the target domain, it
Table 4.The calibrated crop parameters of rice for regional simu-lation of DNDC.
Crop parameters Value
Total biomass (kg C ha−1) 4383.8
Grain fraction of total biomass (%) 47.0
Shoot fraction of total biomass (%) 43.0
Root fraction of total biomass (%) 10.0
C/N ratio for plant 58.3
C/N ratio for grain 55.0
C/N ratio for shoot (leaf + stem) 60.0
C/N ratio for root 70.0
Water demand (g water/g dry matter) 508.0
Maximum leaf area index 6.0
Maximum height of plant (m) 1.0
Temperature degree days for maturity (TDD) (◦C) 2300.0
N fixation index 1.0
Valscularity index (0–1) 1.0
the rice areas. In this study the Landsat thematic map-per (TM) imagery acquired from the EarthExplorer Interface (http://edcsns17.cr.usgs.gov/EarthExplorer/) were processed to extract the spatial distribution of rice paddies in the San-jiang Plain (Table 1). Total of 9 clear TM images covering the target domain acquired in the near-maturing stage of rice in 2006 were selected to extract a single class paddy rice with elaborately image preprocessing such as mosaicking, subset-ting and geometric correction at stepwise. Visual interpre-tation was applied for ensuring accurate delineation of rice paddies at the processing software environment of ArcGIS 9.0, although time-expensive. The vectorized rice paddy polygons then were segmented by soil data with cell size of 10 km×10 km. Within each cell, rice area was calculated for estimating CH4emissions seasonally conducted in following
sections. Due to the clear weather conditions and the distin-guished phenology features, the rice fields were successfully extracted from remote sensing data. The formed rice map had a high spatial resolution of 30 m. The data set provided a sound basis for delineating the rice paddies in the study region with a high accuracy and a high precision.
Daily climate data (maximum and minimum air tempera-ture, precipitation and mean wind speed) were acquired for 2004 and 2006 from seven weather stations (China Mete-orological Data Sharing Service System at http://data.cma. gov.cn/) within the target domain. Soil data were derived from the soil dataset developed by the Institute of Soil Sci-ence, Chinese Academy of Sciences, which was compiled based on the second national soil survey conducted in 1980– 1990s. The soil dataset contains multi-layer soil properties (e.g. organic matter, pH and bulk density), soil texture (sand, silt and clay) and other spatial information (Shi et al., 2004; Yu et al., 2007) with a resolution of 10 km×10 km. In this study, we adopted the top (0–10 cm) soil data derived from
805 paddy profiles within the domain to serve the DNDC simulations. Detailed management practices on rice cultiva-tion were investigated by communicating with a number of local agronomists and farmers. All the spatially differenti-ated input information was composed in the GIS database, which was then linked to DNDC through the DNDC’s re-gional mode interface.
DNDC was run for the Sanjiang Plain twice with 2004 and 2006 climate data, respectively. During the model runs, DNDC performed simulation for each grid cell twice with the maximum and minimum values of the soil properties, respec-tively. The two simulations produced a pair of CH4 fluxes
for each grid cell, which formed a range of CH4 emission
that was later used for quantifying the uncertainty generated from the upscaling (please refer Li et al., 2004 for details of the Most Sensitive Factor method). Based on the mod-eled CH4 emission rate and the rice field acreage for each
grid cell, the total CH4emissions from the cell could be
cal-culated. The regional emission was calculated by summing up the CH4emissions from all the grid cells within the
do-main. The Sanjiang Plain contains 23 counties; the county-level CH4emissions were also calculated for evaluating the
spatial patterns of CH4emissions in the plain.
3 Results
3.1 Paddy rice map of the Sanjiang Plain
With visual interpretation technique, the rice paddy cover in the domain in 2006 was mapped based on 9 clear TM im-ages (Fig. 1). The rice paddies were mainly distributed in the lowland areas along with the major rivers. The total area of paddy fields was 1.44 million ha in 2006, which was approx-imately 35 % higher than that in 2000. This result confirmed the census reports that rice paddies rapidly increased in the Sanjiang Plain in the past ten years.
3.1.1 Validation of simulated results
The measured CH4fluxes at the three treatments, C04-N60,
C04-N150 and C06-N150, were compared with modeled re-sults. Figure 3 shows the comparisons between the modeled CH4fluxes with observations. As a whole, the modeled
re-sults showed a fair agreement with observations although mi-nor discrepancies exist across the three treatments (Fig. 3a1, b1, c1). Regression analysis demonstrated that the simulated emissions explained over 85 % of the variation in observed emissions for all the three cases. The intercept of three re-gression lines is very closer to 0. The RMSE values for the three cases are 0.190, 0.304 and 0.344 for N60, C04-N150 and C06-C04-N150, respectively (Fig. 3a2, b2, c2). In the validation test, the significance test of difference in between modeled and observed CH4fluxes showed that all the
Fig. 3. Simulated vs. observed CH4fluxes in validation site with
three N-fertilizer application scenarios: 60 kg N ha−1(a1 and a2) and 150 kg N ha−1(b1 and b2) in 2004, and 150 kg N ha−1(c1 and c2) in 2006, respectively.
Table 5. Statistical analysis for comparison of the simulated and observed CH4fluxes in three case studies.
Mode Measurement Slope Intercept RMSE EF CD Number
C04-N60 24 0.908 0.058 0.190 0.870 1.058 C04-N150 24 0.826 0.056 0.304 0.837 1.227 C06-N150 35 0.903 −0.109 0.344 0.844 1.041
far larger than 0.05. It means that the differences in modeled and observed values are not significant at confidence level of 95 %. Furthermore, all three EF are positive (>0.8), and three CD are greater than 1 (Table 5). The results thus in-dicated that DNDC is capable of capturing the seasonal pat-terns as well as the magnitudes of CH4emissions from the
experimental site in the Sanjinag Plain.
3.2 Estimation of CH4emissions for the Sanjiang Plain
Linked to the GIS database, DNDC was run across the en-tire 1.44 million ha of rice fields in the Sanjiang Plain. The modeled results were summed up to produce regional CH4
emissions. The spatial and temporary patterns of CH4
emis-sions in the domain are discussed as follows.
Results from the regional simulations indicated that the total CH4 emissions from the Sanjiang Plain ranged from
Table 6. Simulated results of CH4emissions from paddies of the
Sanjiang Plain.
Mode C04-N60 C04-N150 C06-N150 Emission rates Mean 381.24 386.93 416.48 (kg CH4-C ha−1) Maximum 926.37 927.04 943.88
Minimum 32.30 32.23 38.59 Total emissions Mean 0.48 0.49 0.53 (Tg CH4-C) Maximum 0.52 0.53 0.58
Minimum 0.43 0.44 0.48
Fig. 4. Mean CH4 emission rates (a) and total emissions (b)
per year from paddy fields in the Sanjiang Plain at scale of 10 km×10 km grid-cell in 2006.
0.43 to 0.58 (or 0.51±0.07) Tg CH4-C yr−1. Figure 4 show
CH4emission rates and total emissions at the grid-cell scale.
The two maps showed clear spatial variations in CH4
emis-sions across the domain region. The emission rates varied between<40 and>900 kg CH4-C ha−1mainly driven by the
spatial variation in the soil properties (Fig. 4a; Table 6). In terms of sensitive analysis shown in Fig. 2, the spatial vari-ations in CH4 emission rates mainly are attributed to the
Most Sensitive Factor (MSF) soil properties (i.e., soil texture and SOC content). Statistical analysis showed that the low-est CH4flux (38.59 kg CH4-C ha−1) was located at three soil
However in those soil grids with the minimum of clay frac-tion (0.131 %), the CH4 flux was not necessarily the
high-est values (943.88 kg CH4-C ha−1). They occurred in those
with the highest SOC content (6.7 %). Consequently, the clay fraction in soil and SOC content was the most sensitive factor driving the CH4emission rates (Fig. 2). In contrast, other soil
properties like bulk density and soil pH, were less sensitive to the CH4emission from rice paddy.
The regional average was around 400 kg CH4-C ha−1
in 2006, which was higher than that (15–198 kg CH4
-C ha−1yr−1) observed in the Southeast China such as Taihu Lake region (Zhang et al., 2009a) and also higher than the default emission factors of 200 kg CH4-C ha−1season−1
sug-gested by the IPCC guidelines (IPCC, 1997). The simulated data attributed the high CH4emission rates to the SOC rice
soils (averagely 0.31 kg C kg−1soil) in combination with the
continuous flooding management in the Sanjiang Plain. Fol-lowing the SOC content trend, the modeled CH4 emission
rates gradually decreased from the southwest to the north-east of the region (Fig. 4a). The maximum CH4 emission
rates (∼944 kg CH4-C ha−1) were shown in five grid cells in
the southwestern part of the domain apparently related to the higher SOC contents in the region. Differing from the CH4
emission rate, the total CH4emission flux for each grid cell
was not only related to the emission rate but also the total rice area. In 2006, the total CH4 emissions over the
en-tire Sanjiang Plain were ranged from 0.48 to 0.58 Tg CH4
-C, the mean emission was 0.53 Tg CH4-C. In general, the
mid-northern and southeastern parts of the Sanjiang Plain had more expansive rice paddies and hence possessed higher CH4emissions (Fig. 4b).
The Sanjiang Plain contains 23 administrative counties, where a small population of farmer owes a large amount of agro-lands, and modern cultivation managements are very extensively practiced. Generally speaking, unlike the South China, only single season rice were grown in the Northeast China, and the management practices are relatively identical within the entire study area. The indistinctive differences in rice cultivation practices make less variation in CH4
emis-sions from rice paddy in this study area, which has been showed in sensitivity tests of environment factors driving CH4emissions (Fig. 2). Therefore, we assumed the general
(or average) management practices were identical cover the entire study area. The climate conditions are not homoge-neous but very similar cover the study area so that their ef-fects on CH4emission rate are negligible. The county-level
CH4emissions in 2006 are shown in Fig. 5. The high
emis-sion counties such as Fujin (FJ), Huachuan (HC) and Hulin (HL) are located either in mid-northern or southeastern parts of the domain. In contrast, the low emission counties such as Shuangyashan (SYS), Youyi (YY), Qitaihe (QTH), Jixi (JX), Muling (ML) and Hegang (HG) are located in either the central-southern or the northwestern areas of the plain (Fig. 5a). The highest CH4emission (81.8 Gg CH4-C) was
in the HC and HL Counties, and the lowest (0.683 Gg CH4
-Fig. 5.Total CH4emissions per year from rice paddies in the
San-jiang Plain at county-level scale. Where, (a)denotes the spatial distribution of total emissions in 2006, and(b)is the comparison
of CH4 emissions at three scenarios of C04-N60, C04N150 and
C06N150.
C) was in the ML County. Statistic results showed that the highest emission county emitted over 100 times higher than the lowest one per season (Fig. 5b). Such a huge difference in CH4emission was due to the variations in the total paddy
cultivation acreage as well as the CH4 emission rate
deter-mined by the soil properties (e.g. SOC content, clay fraction in soil, etc.).
In addition, attempt was also made to estimate the total CH4emissions in 2004 based on the assumption of same rice
areas as in 2006. Simulated results showed that at two sce-narios, C04-N60 and C04-N150, both of the emission rates and total emissions of each county were less than that in 2006 (Fig. 5b). The total emissions were very similar, mean of 0.48 and 0.49 Tg CH4-C was separately emitted for
2006, we found the average temperature in the 2006 growing season was 0.26◦C higher that that in 2004. The regional
simulations indicated that although the change in N-fertilizer application rate didn’t affect the regional CH4emissions very
much, it did increase the crop yields that could indirectly en-hance the CH4production.
4 Discussions
The Sanjiang Plain possesses 1.44 million ha of paddy rice in the very northeastern part of China in 2006 where the annual mean temperature is 2.2◦C, which is 10–15◦C lower than that in the majority rice producing areas in the southeastern or southwestern part of the country. Driven by the market demand for high quality rice in China, more upland crop-lands planted with corn or soybeans were converted to wet-land crops (mainly rice) in Northern China during the past decade. This kind of rapid land-use transformation could al-ter the national GHG inventory now and in the near future. Mapping the new land-use as well as the consequent GHG emissions should be an urgent task for the researchers.
DNDC was first utilized to estimate CH4emissions from
this high latitude rice fields. After the calibration and valida-tion against local observavalida-tions, DNDC simulated CH4fluxes
across the target domain. The modeled CH4emission rates
varied in a range of 100–800 kg C ha−1 per year, which is consistent with the CH4emission rates observed or modeled
in the southern rice regions in China. Our modeled results are supported by observations conducted in a number of high lat-itude wetlands where the researchers measured high fluxes of CH4from the cold, even frozen, wetland ecosystems. Our
re-sults confirmed the hypothesis that the high latitude wetlands could be an important CH4source maybe due to adaptation
of the methanogens to the low temperatures.
In this study, we utilized a remote sensing-derived crop map to drive a process-based biogeochemistry model to re-alize the regional quantification. The uncertainty produced from the upscaling has been estimated with the Most Sen-sitive Factor method developed by Li and his colleagues (Li et al., 2004). By including the maximum and mini-mum values of the most sensitive factors (i.e., soil texture and SOC content) into the GIS database, DNDC calculated two CH4 fluxes for each grid cell. The two extreme CH4
fluxes formed a range, within which the “real” flux should be located with a high probability. With this methodology, we concluded that the regional CH4 emission ranged
be-tween 0.43 and 0.58 Tg CH4-C; i.e., the standard deviation
was±14 %. According to the 2006 IPCC Guidelines, a base-line emission factor for no flooded fields for less than 180 days prior to rice cultivation and continuously flooded dur-ing the rice cultivation period without organic amendments (EFc) is used as a starting point (IPCC, 2006). The IPCC de-fault for EFc is 1.30 kg CH4ha day−1 which was estimated
by a statistical analysis of available field measurement data
(Yan et al., 2005). In the Sanjiang Plain, for 1.44 million ha of paddy fields in 2006, and a total of 106-day continuously flooded without organic amendments was assumed to prac-tice during the rice-growing season. Consequently, the total methane emissions in 2006 based on the IPCC default emis-sion factors were approximately 0.20 Tg CH4-C, which is
significantly lower than the modeled estimation in this study (0.53 Tg CH4-C). Explaining such large differences in CH4
emissions would become a continuously interesting research topic in the future on regional estimation of CH4emissions
from the rice-producing region with the highest latitude. Studies on greenhouse gas inventory and mitigation in China were started relatively later in comparison with some other countries. However, the new research campaigns in the direction are being rapidly developed in the country during the recent years driven by the social and research demands. The results reported in the paper is one of the attempts to try to absorb the world advanced techniques such as biogeo-chemical models, remote sensing mapping, uncertainty anal-ysis to serve the national environmental issues in China.
Acknowledgements. This work was funded by the frontier project of the Northeast Institute of Geology & Agroecology, Chinese Academy Sciences (No. KZCX3-SW-NA09-05), the Knowledge Innovation Project of The Chinese Academy of Sciences (KZCX2-YW-Q06-03) and National Natural Science Foundation of China (No. 41001202). The participation of Changsheng Li in the study was supported by NASA’s ROSE TE project “Modeling impacts of climate change on carbon dynamics in northern high latitude wetlands” (NNX09AQ36G).
Edited by: X. Wang
References
Aggarwal, P. K., Kalra, N., Chander, S., and Pathak, H.: InfoCrop: A generic simulation model for annual crops in tropical environ-ments, Indian Agricultural Research Institute, New Delhi, 2004. Anastasi, C., Dowding, M., and Simpson, V. J.: Future CH4 emis-sion from rice production, J. Geophys. Res., 97, 7521–7125, 1992.
Babu, Y. J., Li, C. S., Frolking, S., Nayak, D. R., Datta, A., and Adhya, T. K.: Modelling of methane emissions from rice-based production systems in India with the denitrification and decom-position model: field validation and sensitivity analysis, Curr. Sci., 89, 1904–1912, 2005.
Babu, Y. J., Li, C. S., Frolking, S., Nayak, D. R., and Adhya, T. K.: Field validation of DNDC model for methane and nitrous ox-ide emissions from rice-based production systems of India, Nutr. Cycl. Agroecosys., 74, 157–174, 2006.
Bachelet, D., and Neue, H. U.: Methane emission from wetland rice areas of Asia, Chemosphere, 26, 219-237, 1993.
Cai, Z. C., Xing, G. X., Shen, G. Y., Xu, H., Yan, X. Y., and Tsuruta, H.: Measurements of CH4and N2O emissions from rice paddies
in Fengqiu, China, Soil Sci. Plant Nutr., 45, 1–13, 1999. Cai, Z. C., Tsuruta, H., and Minami, K.: Methane emission from
rice fields in China: measurements and influencing factors, J. Geophys. Res., 105, 17231–17242, 2000.
Cai, Z. C., Sawamoto, S., Li, C. S., Kang, G., Boon-jawat, J., Mosier, A., and Wassmann, R.: Field validation of the DNDC model for greenhouse gas emissions in East Asian cropping systems, Global Biogeochem. Cy., 17, 1107, doi:10.1029/2003GB002046, 2003.
Cao, M., Dent, J. B., and Heal, O. W.: Modelling of methane emis-sion from rice paddies, Global Biogeochem. Cy., 9, 183–195, 1995a.
Cao, M., Dent, J. B., and Heal, O. W.: Methane emissions
from China’s paddyland, Agric. Ecosys. Environ., 55, 129–137, 1995b.
Cao, M., Gregson, K., Marshall, S., Dent, J. B., and Heal, O. W.: Global methane emissions from rice paddies, Chemosphere, 33, 879–897, 1996.
Cao, M., Gregson, K., and Marshall, S.: Global methane emissions from wetlands and its sensitivity to climate change, Atmos. Env-iron., 32, 3293–3299, 1998.
Cole, V., Cerri, C., Minami, K., Mosier, A., Rosenberg, N., and Sauerbeck, D.: Agricultural options for mitigation of greenhouse gas emissions, in: Climate Change 1995: Impacts, adaptations and mitigation of climate change: Scientific-Technical Analy-ses, edited by: Watson, R. T., Cambridge University Press, Cam-bridge, 1996.
Dlugokencky, E. J., Masarie, K. A., Lang, P. M., and Tans, P. P.: Continuing decline in the growth rate of the atmospheric methane burden, Nature, 393, 447–450, 1998.
Etheridge, D., Pearman, G., and Fraser, P.: Changes in tropospheric methane between 1841 and 1978 from a high accumulation-rate Antarctic ice core, Tellus, 44B, 282–294, 1992.
FAO: FAO statistical databases, available at: http://faostat.fao.org/ (verified 9 Feb. 2006), Rome, 2004.
Frolking, S., Qiu, J., S., B., Xiao, X., Liu, J., Zhuang, Y.,
Li, C. S., and Qin, X.: Combining remote sensing and
ground census data to develop new maps of the distribution of rice agriculture in China, Global Biogeochem. Cy., 16, 1091, doi:10.1029/2001GB001425, 2002.
Giltrap, D. L., Li, C. S., and Saggar, S.: DNDC: A process-based model of greenhouse gas fluxes from agricultural soils, Agric. Ecosys. Environ., 136, 292–230, 2010.
Holzapfel-Pschorn, A., and Seiler, W.: Methane emission during a cultivation period from an Italian rice paddy, J. Geophys. Res., 91, 11803–11814, 1986.
IPCC: Revised 1996 IPCC Guidelines for National Greenhouse Gas Inventories Workbook, Vol. 2, Intergovernmental Panel on Cli-mate Change, Cambridge University Press, Cambridge, 1997. IPCC: 2006 IPCC Guidelines for National Greenhouse Gas
Inven-tories, Vol. 4, Prepared by the National Greenhouse Gas Invento-ries Programme, edited by: Eggleston, H. S., Buendia, L., Miwa, K., Ngara, T., and Tanabe, K., the Institute for Global Environ-mental Strategies (IGES), Hayama, 2006.
IPCC: The physical science basis. In: Contribution of working group I to the fourth assessment report of the intergovernmen-tal panel on climate change, Intergovernmenintergovernmen-tal Panel on Climate
Change, Cambridge University Press, Cambridge, 2007. Kern, J. S., Gong, Z., Zhang, G., Zhuo, H., and Luo, G.: Spatial
analysis of methane emissions from paddy soils in China and the potential for emissions reduction, Nutr. Cycl. Agroecosys., 49, 181–195, 1997.
Khalil, M. A. K., Rasmussen, R. A., Wang, M. X., and Ren, L. X.: Methane emission from rice fields in China, Environ. Sci. Technol., 25, 979–981, 1991.
Le Toan, T., Ribbes, F., Wang, L. F., Nicolas, F., Ding, K. H., Kong, J. A., Fujita, M., and Kurosu, T.: Rice crop mapping and mon-itoring using ERS-1 data based on experiment and modeling re-sults, IEEE T. Geosci. Remote, 35, 41–56, 1997.
Li, C. S., Frolking, S., and Frolking, T. A.: A model of nitrous oxide evolution from soil driven by rainfall events. 2. Model applica-tions, J. Geophys. Res., 97, 9777–9783, 1992a.
Li, C. S., Frolking, S., and Frolking, T. A.: A model of nitrous oxide evolution from soil driven by rainfall events: I. Model structure and sensitivity, J. Geophys. Res., 97, 9759–9776, 1992b. Li, C. S., Frolking, S., and Harriss, R. C.: Modeling carbon
bio-geochemistry in agricultural soils, Global Biogeochem. Cy., 8, 237–254, 1994.
Li, C. S.: Modeling trace gas emissions from agricultural ecosys-tems, Nutr. Cycl. Agroecosys., 58, 259–276, 2000.
Li, C. S., Qiu, J., Frolking, S., Xiao, X., Salas, W., Moore III, B., Boles, S., Huang, Y., and Sass, R.: Reduced methane emis-sions from largescale changes in water management in China’s rice paddies during 1980–2000, Geophys. Res. Lett., 29, 1972, doi:10.1029/2002GL015370, 2002.
Li, C. S., Mosier, A., Wassmann, R., Cai, Z., Zheng, X., Huang, Y., Tsuruta, H., Boonjawat, J., and Lantin, R.: Modeling green-house gas emissions from rice-based production systems: sen-sitivity and upscaling, Global Biogeochem. Cy., 18, GB1043, doi:10.1029/2001GB001425, 2004.
Li, C. S., Salas, W., DeAngelo, B., and Rose, S.: Assessing alterna-tives for mitigating net greenhouse gas emissions and increasing yields from rice production in China over the next 20 years, J. Environ. Qual., 35, 1554–1565, 2006.
Matthews, R. B., Wassmann, R., and Arah, J.: Using a crop/soil simulation model and GIS techniques to assess methane emsis-sions from rice fields in Asia, I. Model development, Nutr. Cycl. Agroecosys., 58, 141–159, 2000.
Neue, H. U.: Methane emission from rice fields, Biosciences, 43, 466–474, 1993.
Oenema, O., Velthof, G., and Kuikman, P.: Technical and policy aspects of strategies to decrease greenhouse gas emissions from agriculture, Nutr. Cycl. Agroecosys., 60, 301–315, 2001. Pathak, H., Li, C., and Wassmann, R.: Greenhouse gas
emis-sions from Indian rice fields: calibration and upscaling using the DNDC model, Biogeosciences, 2, 113–123, doi:10.5194/bg-2-113-2005, 2005.
Ribbes, F. and Le Toan, T.: Rice field mapping and monitoring with RADARSAT data, Int. J. Remote Sens., 20, 745–765, 1999. Salas, W., Boles, S., Li, C. S., Babu, Y., Xiao, X., Frolking, S., and
Green, P.: Mapping and modeling of greenhouse gas emissions from paddies with satellite radar observations and the DNDC biogeochemical model, Aquat. Conserv., 17(3), 319–329, 2007. Sass, R. L., Fisher, F. M., Wang, Y. B., Turner, F. T., and Jund, M.
Scheehle, E. A. and Kruger, D.: Global anthropogenic methane and nitrous oxide emissions, Energy J., 22, 33–44, 2006.
Shi, X. Z., Yu, D. S., Warner, E. D., Pan, X. Z., Petersen, G. W., Gong, Z. G., and Weindorf, D. C.: Soil database of 1:1,000,000 digital soil survey and reference system of the Chinese genetic soil classification system, Soil Surv. Horiz., 45, 129–136, 2004. Sinha, S. K.: Methane emission from rice paddies: excellent
methodology but poor extrapolation, Curr. Sci., 68, 643–646, 1995.
Smith, P., Smith, J. U., Powlson, D. S., McGill, W. B., Arah, J. R. M., Chertov, O. G., Coleman, K., Franko, U., Frolking, S., Jenkinson, D. S., Jensen, L. S., Kelly, R. H., Klein-Gunnewiek, H., Komarov, A. S., Li, C., Molina, J. A. E., Mueller, T., Par-ton, W. J., Thornley, J. H. M., and Whitmore, A. P.: A compari-son of the performance of nine soil organic matter models using datasets from seven long-term experiments, Geoderma, 81, 153– 225, 1997.
Takeuchi, W., Yasuoka, Y., and Tamura, M.: Estimation of Mehtane Emission from Paddy Fields in Central Plain of Thailand by Scal-ing Technique. In: ProceedScal-ings of the 22nd Asian Conference on Remote Sensing, 5–9 November 2001, Singapore, 1, 422–427, 2001.
USEPA: Global anthropogenic non-CO2 greenhouse gas
emissions: 1990-2020 (June 2006 Revised), available at:
http://www.epa.gov/climatechange/economics/downloads/
GlobalAnthroEmissionsReport.pdf, Office of Atmospheric
Programs, USEPA, Washington, DC, 2006.
Van Bodegom, P. M. and Scholten, J. C. M.: Microbial processes of CH4production in a rice paddy soil: model and experimental
validation, Geochim. Cosmochim. Ac., 65, 2055–2066, 2001. Verburg, P. H. and Van Der Gon, H. A. C. D.: Spatial and
tempo-ral dynamics of methane emissions from agricultutempo-ral sources in China, Glob. Change Biol., 7, 31–47, 2001.
Verburg, P. H., van Bodegom, P. M., van der Gon, H. A. C. D., Bergsma, A., and van Breemen, N.: Upscaling regional emis-sions of greenhouse gases from rice cultivation: Methods and sources of uncertainty, Plant Ecol., 182, 89-106, 2006.
Wang, Y., Chen, W., Zhao, Z., and Gu, J.: Characteristics and esti-mation of CH4, N2O emission from cold paddy field in the
San-jiang Plain, Trans. CSAE, 24, 170–176, 2008. (in Chinese with English abstract)
Wassmann, R., Neue, H. U., and Bueno, C.: Methane production capacities of different rice soils derived from inherent and ex-ogenous substrates, Plant Soil, 203, 227–237, 1998.
Xiao, X., Boles, S., Liu, J., Zhuang, D., Frolking, S., Li, C., Salas, W., and Moore III, B.: Mapping paddy rice agriculture in south-ern China using multi-temporal MODIS images, Remote Sens. Environ., 95, 480–492, 2005.
Yagi, K. and Minami, K.: Effect of organic matter application on methane emission from some Japanese rice fields, Soil Sci. Plant Nutr., 36, 599–610, 1990.
Yagi, K., Tsuruta, H., Kanda, K., and Manami, K.: Effect of wa-ter management on methane emission from a Japanese rice field: Automated methane monitoring, Global Biogeochem. Cy., 10, 255–267, 1996.
Yan, X. Y., Yagi, K., Akiyama, H., and Akimoto, H.: Statisti-cal analysis of the major variables controlling methane emission from rice fields, Glob. Change Biol., 11, 1131–1141, 2005. Yao, H. and Chen, Z. L.: Effect of chemical fertilizer on methane
emission from rice paddies, J. Geophys. Res., 99, 16463–16470, 1994.
Yao, H., Zhuang, Y., and Chen, Z. L.: Estimation of methane emis-sion from rice paddies in Mainland China, Global Biogeochem. Cy., 10, 641–649, 1996.
Yu, D. S., Shi, X. Z., Wang, H. J., Sun, W. X., Chen, J. M., Liu, Q. H., and Zhao, Y. C.: Regional patterns of soil organic carbon stocks in China, J. Environ. Manage., 85, 680–689, 2007. Zhang, Y., Li, C., Zhou, X., and Moore III, B.: A simulation model
linking crop growth and soil biogeochemistry for sustainable agriculture, Ecol. Model., 151, 75–108, 2002.
Zhang, L., Yu, D., Shi, X., Weindorf, D., Zhao, L., Ding, W., Wang, H., Pan, J., and Li, C.: Quantifying methane emissions from rice fields in the Taihu Lake region, China by coupling a detailed soil database with biogeochemical model, Biogeosciences, 6, 739– 749, doi:10.5194/bg-6-739-2009, 2009a.
Zhang, Y., Wang, C., Wu, J., Qi, J., and Salas, A. W.: Map-ping paddy rice with multi-temporal ALOS PALSAR imagery in southeast China, Int. J. Remote Sens., 30, 6301–6315, 2009b. Zheng, X. H., Wang, M. X., Wang, Y. S., Shen, R. X., Shangguan, X. J., Heyer, J., Kogge, M., Papen, H., Jin, J. S., and Li, L. T.: CH4and N2O emissions from rice paddies in southeast China,