Preliminary communication UDC 332.14:330.34(4-67 EU)
The impact of EU accession on the economic
performance of the countries’ internal (NUTS 3)
regions
*1Vera Boronenko
2, Vladimirs Mensikovs
3, Olga Lavrinenko
4Abstract
The research objective of the presented study is to ind out the consequences of the EU accession on internal regions in terms of regional convergence or divergence. The conception of analysis is based on the convergence theory which states that all industrial systems would converge because of the determinant effects of technological development. The samples for empirical analysis include NUTS 3 regions within the “new” EU countries (the countries of the former socialist bloc that entered the EU in 2004 and 2007) and Croatia as a “control country”, the economic performance of which is measured by real GDP per capita for 2000-2011, the applied method – basic panel data analysis. The main indings of the research allow to argue that positively perceived trend of actual declining of economic performance’s interregional variation within the “new” EU countries is not the consequence of joining the EU. The basic conclusion with regard to the results of the research is that the “new” EU countries are undergoing a natural inverted U-shaped trend of changes of their economic performance’s interregional
* Received: 14-09-2014; accepted: 16-12-2014
1 This article is worked out with a support of the Marie Curie FP7-PEOPLE-2011-COFUND
program – NEWFELPRO (The new International Fellowship Mobility Programme for Experienced Researchers in Croatia) within the project “Rethinking Territory Development in Global Comparative Researches (Rethink Development)”, Grant Agreement No. 10.
2 PhD in Economics, Principal Researcher, Institute of Social Research, Daugavpils University,
1 Parades street, Daugavpils, LV-5401, Latvia; research fellow, Faculty of Economics, University of Rijeka, Ivana Filipovića 4, 51000 Rijeka, Croatia. Scientiic afiliation: regional economics. Phone: +371 29 538 031. E-mail: [email protected] (corresponding author).
3 Full Professor, Dr.sc.soc., Director of the Institute of Social Research, Daugavpils University,
1 Parades street, Daugavpils, LV-5401, Latvia. Scientiic afiliation: economic sociology. Phone: +371 29 151 759. E-mail: [email protected].
4 PhD in Economics, Principal Researcher, Institute of Social Research, Daugavpils University,
variation that depends both on the country average GDP’s per capita growth and on the length of the period of self-development under the conditions of market economy rather than on the factor of unionization as such within the EU.
Key words: “new” EU countries, internal regions, economic performance, regional convergence, regional divergence
JEL classiication: O11, O18, R58
1. Introduction
There are many empirical evidences in literature about the existence of cross-country convergence in economic performance (Barro, 1991; Barro and Sala-i-Martin, 1991; Ranjpour and Karimi, 2008; Sala-i-Sala-i-Martin, 1990, 1996). At the same time, the equality of the economic performance of countries’ internal regions as well as the role of the factor of countries’ unionization – for instance, within the European Union, has not been investigated carefully.
The present study is a result of both the systematic and rather extended scientiic interest of the researchers of the Institute of Social Research at Daugavpils University to the ield of convergence and divergence in the economic performance of the EU regions (Lavrinenko and Voronov, 2008; Lavrinenko, 2010; Lavrinenko et al., 2012, 2013; Voronov et al., 2014), which [economic performance of territories] in economic science is traditionally measured by GDP per capita (Ramkissoon, 2002; Simpson, 2014; Stiglitz et al., 2014). In this study, the authors are interested in so-called σ(sigma)-convergence that is deined as a reduction in the variation (inequality, differentiation, disproportions) of levels of economic performance of regions (in its turn, the opposite process is deined as σ-divergence).
The authors, having summarized the results of a number of the latest European studies (Dall’erba and Le Gallo, 2003; Paas et al., 2006; Forster et al., 2005; Ranjpour and Karimi, 2008) on σ-convergence at different territorial levels – among countries and among internal regions, concluded that for a quarter of a century there was convergence of the level of development between relatively poor and rich countries of the EU. The countries of Central and Eastern Europe that entered the EU have a higher level of regional differences in comparison to the “old” EU countries. In addition, the inequality among large and small regions in many “new” countries of the EU is increasing due to the rapid development of metropolitan regions and major towns in comparison to other, especially small, regions (Voronov et al., 2014).
development of the regions. This process can be illustrated by the inverted U-shape curve. The main argument of J. Williamson’s statement is the fact that at the early stages of self-development of national economy there are several growth poles in the country, where the capital and the qualiied labour force are concentrated. As a result of a more rapid growth in productivity, economic growth accelerates in these pole and leads to the increase of the regional differences (divergence). At the later stages of the development the costs in the growth poles rise, so that the capital is likely to low to other regions with lower labour costs. This fact along with the effects of equal transmission of knowledge may increase the reallocation of the productivity factors through the sectors of economy and regions; this leads to convergence of the levels of regional development.
Some researchers call the strengthening of regional divergence of economic performance at the early stages of countries’ self-development “a catalyst of economic development” (Gusev, 2014). At the same time, they note that the excessive economic inequality acts as a barrier for interregional investment lows. In this case, in developed administrative-territorial units, the capital “stagnates”, and their economic “take-off” from the deprived areas is getting more rapid. Practice shows that as the inequality between rich and poor regions is increasing, the opportunities for interregional capital inlow are reducing. Accordingly, the market mechanism to ensure the uniform development of the country is disrupted, and the government intervention becomes up-to-date. Moreover, the rates of economic growth have long-term negative effect. For example, the annual economic losses caused by the high regional economic differentiation in Russia is 3% of GDP (Hill and Gaddy, 2003; Mel’nikova, 2008).
Thus, on the basis of the results of the authors’ own and other scientiic researches in the ield of convergence of regional economic development, the authors forward out the hypothesis that needs for empirical evidence to be found in the present study: the countries in Central and Eastern Europe (the countries of former socialist bloc) that entered the EU in 2004 and 2007 are undergoing a natural inverted U-shaped trend of changes of their GDP’s per capita interregional variation that depends both on the GDP and on the length of the period of self-development in economy rather than on the factor of unionization as such within the EU. Hence, in terms of interregional variation, for the economic performance of the investigated countries’ internal (NUTS 3) regions the consequences of entering the EU are not direct, but indirect due to suficiently rapid economic growth of the countries under investigation after their entering the EU.
2. Literature review on territorial convergence of economic
performance
In the past decades, there are more and more studies devoted to the equalization of the levels of regional and state development, i.e. their convergence. The issue on the presence of convergence among the states and regions with different level of economic development emerged in the 1960s-1970s of the previous century after R. Solow had introduced his model of economic growth (Solow, 1957), which brought to a conclusion connected with a higher economic growth in the countries that are far from the stationary state (a state, when capitalization of labour remains steady) in comparison with those countries that are closer to it. Thus, the less developed economies are slowly catching up the developed ones; this makes the essence of the neo-classical hypothesis of β (beta)-convergence (Barro and Sala-i-Martin, 1992a). Among the scientists systematically engaged into the ield of convergence, who have made a large contribution into its study, there are the works by R.J. Barro and X. Martin (Sala-Martin, 1990, 1994, 1995, 1996; Barro, 1991; Barro and Sala-i-Martin, 1991, 1992a, 1992b, 1995, 1997; Barro et al., 1995), P.C. Cheshire and his colleagues (Cheshire and Hay, 1989; Cheshire and Carbonaro, 1995; Cheshire and Magrini, 2000, 2002), D. Quah (1993, 1996a, 1996b, 1996c, 1997), and others. In economic literature, there is no any uniied interpretation of convergence. The conceptions of β-convergence (“convergence in growth rates”) and σ-convergence (“spatial convergence”) are the most widely-spread. Taking into consideration that there are a lot of conducted investigations and published papers on territorial convergence and the fact that the given article is devoted to the study of σ-convergence of internal regions, the presented analysis of literature covers only the results of the studies on σ-convergence of economic performance of internal regions of different countries and groups of countries.
2012). Empirical researches have shown that in Russia the period of time between 1995 and 2009 was characterized by regional divergence – inequality more than doubled. However, this process was not homogeneous: some periods were characterized by convergence. In general, the presence of divergence over the period allowed testing the club convergence, i.e. analysing the presence of convergence clubs in Russia – groups of regions with inner convergence (Sabel’nikova, 2012). D.V. Zverev and J.A. Colomac (2010), who studied σ-convergence of economic performance of regions in Russia in the same period (1995 – 2006), analyze the gained results in more detail. They note that a slight decrease in the dispersion of the average GDP per capita was observed in Russian regions from the very beginning of the considered period up to 1998; this period was characterized by deep transformational recession. In the country, the recovery period and high growth rates were accompanied by an increase of productivity differentials in regional economies. Thus, Russia repeated the experience of many countries that demonstrated a widening of the distance in the development of its territories during the rapid economic growth.
The research methodology, presented in the next section of the article, is based on sound conceptual and methodical approaches to the latest theoretical-methodological and empirical researches carried out in the ield of σ-convergence. It is intended to ind out:
1) whether the increase in the interregional variation of economic performance in the “new” countries of the EU is persistent;
2) whether the above-mentioned increase in the differences between the regions in the “new” EU countries is the result of the entry of these countries into the European Union or the interregional variation of the economic performance in these countries is determined by the factors mentioned in the hypothesis of the present study (the end of Section 1).
3. Research methodology
not to confuse the process of regional (di)convergence, that belongs exactly to the internal regions of a country, with the process of (di)convergence of the levels of economic performance of the regions of different countries: for instance, in the European Union, which has also been studied by many researchers (Armstrong, 1995; Marques and Soukiazis, 1998; Paas et al., 2006; Magrini, 2004).
The subject of the given study is regional (di)convergence in the so-called “new” EU countries, i.e. in Central and Eastern European countries that joined the EU either in 2004 (the Czech Republic, Estonia, Hungary, Latvia, Lithuania, Poland, the Slovak Republic, Slovenia) or in 2007 (Bulgaria and Romania). The studied period is between 2000 and 2011, which covers some years before (4 years) and after (8 years) the reference countries entered the EU (except for Bulgaria and Romania). The study level of regional (di)convergence – regions NUTS 3 in the above-mentioned countries, i.e. that level of administrative and territorial division of each country, which marks territories of 150 000 – 800 000 people (European Communities, 2007). In the Czech Republic there are 14 such territories (Kraje), in Estonia – 5 (Groups of Maakond), in Hungary – 20 (Megyek+Budapest), in Latvia – 6 (Regioni), in Lithuania – 10 (Apskritys), in Poland – 66 (Podregiony), in the Slovak Republic – 8 (Kraje), in Slovenia – 12 (Statisticne regije) (European Communities, 2007), in Bulgaria – 28, in Romania – 42 (European Commission, 2014a). For comparison, the authors will consider the process of regional (di)convergence in Croatia, which entered the EU in 2013: for the same period and at the same level of NUTS 3 (Croatia has 21 such territories – European Commission, 2014a).
The countries chosen for the analysis share certain similarities that allow to group them together as an object of the present study:
1) they all (except for Bulgaria and Romania) have a 10-year experience of the EU membership that allows statistically correctly and reliably to analyze the processes of regional (di)convergence in these countries before and after they entered the EU, evaluating the consequences of entering the EU for the economic performance of the internal regions of these countries;
2) they all are the countries of former socialist bloc that survived suficiently long periods of administrative command economy and moved to market economy at the beginning of the 1990s, that predetermines a certain entity of the levels and tendencies of the development in their economies.
Croatia shares with the 10 countries under considerations the last similarity, though it has only a one-year experience of being a EU member, and thus, the process of regional (di)convergence in Croatia is interesting and useful for comparison.
σ-convergence = σt(Yt, ... ,Yn) / meant (Yt, ...,Yn) · 100, (1) where:
– σt is the standard deviation (the square root of the variance);
– Yt, ... , Yn denote real GDP per capita (or another indicator) in the considered regions (n is a number of regions);
– meant (Yt, ... , Yn) is an average value of the indicator in the regions gained in the same period of time.
σ-convergence is measured from 0 to 1, however, for clarity’s sake in graphical representations of calculations a number multiplied by 100 is often used (Tochickaya et al., 2008; Sala-i-Martin, 1996). The rule: the closer the index of σ-convergence is to zero the higher the convergence.
In contemporary economics, following the seminal contribution by J.A. Hausman and W.E. Taylor (1981), J. Heckman (1981), W.J. Baumol (1986) later reined by R. Barro (1991) and R. Barro and X. Sala-i-Martin (1991, 1992a, 1992b), a large number of studies has made use of cross-sectional growth regressions to see whether regions are converging towards steady state paths and, if so, at what speed (Swaine, 1998; Hoover and Perez, 2004). Later, in order to control for unobserved heterogeneities that bias conventional cross-sectional convergence regressions and to deal with endogeneity concerns, panel data methods have been adopted and widely used (Levin and Lin, 1993; Davies and Lahiri, 1995; Hsiao et al., 1999; Kumer and Ullah, 2000; Maddala, 2001; Bond et al., 2001; Magrini, 2004; Ratnikova, 2006; Dustmann and Rochina-Barrachina, 2007 and many others). Panel data refers to spatial microeconomic sample traced over time, i.e. panel data contain observations of the same economic units obtained in successive time periods (Ratnikova, 2006). Panel data comprise three dimensions: features – objects – time. Their usage gives a number of signiicant advantages, when estimating parameters of regression, since they allow both time series analysis and analysis of spatial samples.
According to Nobel Laureate 2000, J. Heckman, the creation of such databases is the main achievement of the 20th century (Heckman, 2001). The use of these sources
a serious displacement of aggregation. This was mentioned in the works of R.A. Fisher (1921), and C. Eisenhart (1947) – a long time before contemporary “wave” of using panel data.
Coming back speciically to the aim of the research methodology of the present study (that was presented in the article at the end of Section 2), the authors consider it necessary to make a clear empirical interpretation of the logical and mathematical statements:
– “there is (or there is not) a continuation in the trends of increase in the interregional variation of economic performance in the “new” EU countries”; – “growth (or reduction) of inequality between the regions in the “new” EU
countries is (or is not) a consequence of the accession of these countries to the European Union”.
To make a scientiic and statistically-grounded conclusion about the irst thesis, on the basis of existing statistics it is necessary (using the terms of the convergence theory) to calculate which of the two trends – regional convergence or regional divergence – can be found in the countries under study (2000-2011). It is essential: 1) to calculate the coeficients of interregional variation of the average GDP per
capita for NUTS 3 regions in the countries under study (2000-2011);
2) to calculate the percentage change and to state whether this change is directed to the increase or decrease of the coeficients of variation for each of the country at the end of the period under study (2011) in comparison to its beginning (2000) (Lavrinenko, 2010);
3) to characterize in details the identiied process of regional (di)convergence in the countries under study (2000-2011), paying attention to its stability and speed; 4) to compare the results with a “control” country, Croatia, that entered the EU
only a year ago.
In its turn, in order to determine whether the identiied growth (or reduction) of inequality between the regions in the “new” EU countries, i.e. the process of regional (di)convergence, is a consequence of the accession of these countries to the European Union or the interregional variation of the economic performance in these countries is indirectly determined by more rapid growth of the reference countries after their entry to the EU, the following steps should be taken:
2) to measure the inluence of the factor of unionization within the EU made on the country’s interregional variation of GDP per capita by calculating Kendall’s correlation coeficient between country’s interregional variation of GDP per capita (coeficient of variation) and entering the EU (yes or no);
3) to carry out the procedure of partial correlation between interregional correlation of GDP per capita and joining the EU, blocking the variable “GDP per capita” and by this having checked whether the changes in country’s interregional variation of economic performance are interconnected with its entering the EU.
4. Empirical data and analysis
Empirical basis for the calculations in this study: panel data of the European Commission’s Eurostat database on GDP at current market prices by NUTS 3 regions of ten “new” EU countries – Bulgaria (BG), the Czech Republic (CZ), Estonia (EE), Hungary (HU), Lithuania (LT), Latvia (LV), Poland (PL), Romania (RO), Slovenia (SL), the Slovak Republic (SK), as well as “control country” – Croatia (HR) – for the period of 2000-2011. Unfortunately, such panel data are not available for the period before 2000 and after 2011, and in this study it is certainly a weakness of the empirical analysis because it deals only with a 4-year period before the accession of most of the reference countries to the EU (which is not enough) and does not take into account 2012 and 2013. But still, in general, it allows the authors to answer the research question stated in this article: how did the EU accession of “new” countries inluence the average GDP per capita and its interregional variation? Thus, the main objective is to determine the impact of the EU accession on the economic performance of the countries’ internal regions.
Estimation of regional (di)convergence in the “new” countries of the EU.
The calculation of coeficients of interregional variation (which characterizes σ-convergence) of the average GDP per capita for NUTS 3 regions in the countries under study (2000-2011) was carried out in a traditional way – the ratio of the standard deviation to the mean of the sample (Sala-i-Martin, 1996; Marques and Soukiazis, 1998).
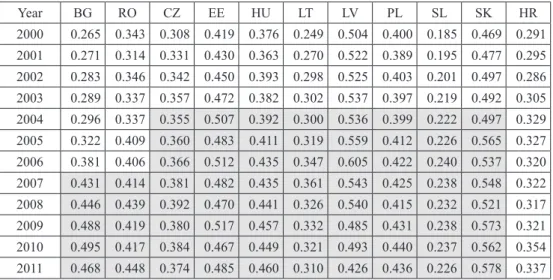
among the countries under study, having the lowest regional stratiication level of economic performance (in 2011, coeficient of interregional variation was 0.226), and the Slovak Republic had the irst position, having the highest coeficient of interregional variation – 0.578 (see Table 1).
Table 1: Panel data on coeficients of interregional variation of the average GDP per capita for NUTS 3 regions, "new" countries of the EU and Croatia*,
2000–2011
Year BG RO CZ EE HU LT LV PL SL SK HR
2000 0.265 0.343 0.308 0.419 0.376 0.249 0.504 0.400 0.185 0.469 0.291 2001 0.271 0.314 0.331 0.430 0.363 0.270 0.522 0.389 0.195 0.477 0.295 2002 0.283 0.346 0.342 0.450 0.393 0.298 0.525 0.403 0.201 0.497 0.286 2003 0.289 0.337 0.357 0.472 0.382 0.302 0.537 0.397 0.219 0.492 0.305 2004 0.296 0.337 0.355 0.507 0.392 0.300 0.536 0.399 0.222 0.497 0.329 2005 0.322 0.409 0.360 0.483 0.411 0.319 0.559 0.412 0.226 0.565 0.327 2006 0.381 0.406 0.366 0.512 0.435 0.347 0.605 0.422 0.240 0.537 0.320 2007 0.431 0.414 0.381 0.482 0.435 0.361 0.543 0.425 0.238 0.548 0.322 2008 0.446 0.439 0.392 0.470 0.441 0.326 0.540 0.415 0.232 0.521 0.317 2009 0.488 0.419 0.380 0.517 0.457 0.332 0.485 0.431 0.238 0.573 0.321 2010 0.495 0.417 0.384 0.467 0.449 0.321 0.493 0.440 0.237 0.562 0.354 2011 0.468 0.448 0.374 0.485 0.460 0.310 0.426 0.436 0.226 0.578 0.337
* Croatia is a „control country” in the empirical analysis of the present research.
Note: The period when each country under study entered the EU is presented in grey. Source: elaborated by the authors on the basis of the European Commission, 2014a
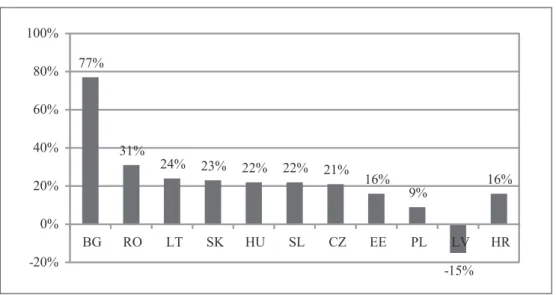
The next step of the empirical analysis is calculation of percentage change, considering whether this change is directed to the increase or decrease of the coeficients of variation for each of the country at the end of the period under study (2011) in comparison to its beginning (2000).
Figure 1: Percentage change of coeficient of interregional variation of GDP per capita in 2000 and 2011 in the “new” EU countries and Croatia
77%
31%
24% 23% 22% 22% 21% 16% 9%
-15% 16%
-20% 0% 20% 40% 60% 80% 100%
BG RO LT SK HU SL CZ EE PL LV HR
Source: elaborated by the authors on the basis of the European Commission, 2014a
Table 2: Panel data on annual change of coeficients of interregional variation of the average GDP per capita for NUTS 3 regions, “new” countries of the EU and Croatia, 2001–2011 (in comparison with the previous year)
Year BG RO CZ EE HU LT LV* PL SL SK HR
2001 0.006 -0.029 0.023 0.011 -0.013 0.021 0.018 -0.011 0.01 0.008 0.004 2002 0.012 0.032 0.011 0.02 0.03 0.028 0.003 0.014 0.006 0.020 -0.009 2003 0.006 -0.009 0.015 0.022 -0.011 0.004 0.012 -0.006 0.018 -0.005 0.019 2004 0.007 0.000 -0.002 0.035 0.01 -0.002 -0.001 0.002 0.003 0.005 0.024 2005 0.026 0.072 0.005 -0.024 0.019 0.019 0.023 0.013 0.004 0.068 -0.002 2006 0.059 -0.003 0.006 0.029 0.024 0.028 0.046 0.01 0.014 -0.028 -0.007 2007 0.05 0.008 0.015 -0.03 0.000 0.014 -0.062 0.003 -0.002 0.011 0.002 2008 0.015 0.025 0.011 -0.012 0.006 -0.035 -0.003 -0.01 -0.006 -0.027 -0.005 2009 0.042 -0.02 -0.012 0.047 0.016 0.006 -0.055 0.016 0.006 0.052 0.004 2010 0.007 -0.002 0.004 -0.050 -0.008 -0.011 0.008 0.009 -0.001 -0.011 0.033 2011 -0.027 0.031 -0.010 0.018 0.011 -0.011 -0.067 -0.004 -0.011 0.016 -0.017 Ave-rage
annual
change 0.018 0.010 0.006 0.006 0.008 0.006 -0.007 0.003 0.004 0.010 0.004
In relation to the average annual growth rate of interregional variation of economic performance in the countries under study, the data displayed in Table 2 allows to conclude that the most rapid process of regional divergence that happened during the decade under study took place in Bulgaria, which is followed then by Romania and the Slovak Republic. The data obtained by means of correlation analysis (based on the 10 countries under study) of two variables – initial coeficient of variation (2000) and its average annual change – show that there is no statistically signiicant interdependence between them (Pearson’s correlation: r = -0.132, p = 0.716), i.e. it is not possible to state that the lower the degree of interregional variation of economic performance in the country is, the more rapidly the process of regional divergence is, and vice versa. Nevertheless, it is rather interesting that Latvia is the only country out of the reference countries, where in the past decade there was observed a process of regional convergence of economic performance – at the starting point (in 2000) it had the highest level of stratiication between its internal regions.
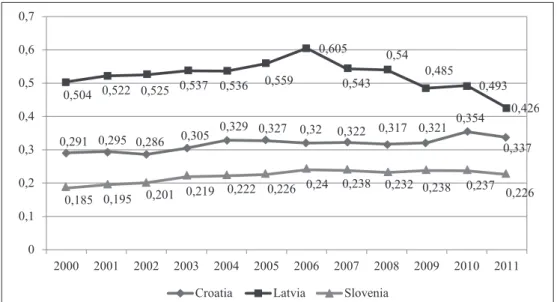
The next Figure presents a regional (di)convergence in “control country”, Croatia, which in the time period under study was not a member of the EU, but it has a lot common historical and socio-economic features shared with the reference countries (for more details see Section 3 of the present article).
Figure 2: Graphic visualization of the processes of regional (di)convergence in Croatia*
in comparison with Latvia and Slovenia, 2000–2011, coeficient of variation
0,291 0,295 0,286 0,305 0,329 0,327 0,32 0,322 0,317 0,321 0,354
0,337 0,504 0,522 0,525 0,537 0,536 0,559
0,605
0,543 0,54
0,485
0,493
0,185 0,195 0,201 0,219 0,222 0,226 0,24 0,238 0,232 0,238 0,237 0,226
0 0,1 0,2 0,3 0,4 0,5 0,6 0,7
2000 2001 2002 2003 2004 2005 2006 2007 2008 2009 2010 2011
Croatia Latvia Slovenia
0,426
* Croatia is a „control country” in the empirical analysis of the present research, in this Figure it
is compared with Latvia and Slovenia (two “new” countries of the EU), which respectively have the highest and the lowest level of stratiication of internal regions according to their economic performance.
As it is shown in Figures 1 and 2, and in Tables 1 and 2, in Croatia the past decade was marked by a process of regional divergence of economic performance (just in the same way as it happened almost in all countries under study). It reached its peak in 2010, and then turned to regional convergence – as in most of the reference countries.
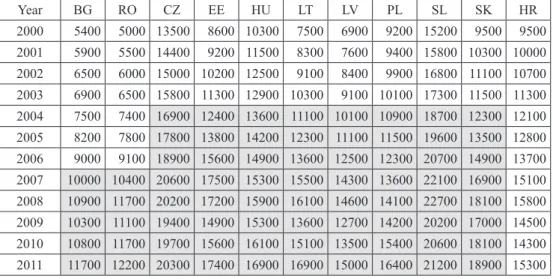
The next Table presents panel data on the average GDP per capita in the countries under study obtained in 2000-2011, i.e. before and after the entry of these countries to the EU. These data are crucial to estimate the consequences of joining the EU for countries’ economic performance and regional (di)convergence.
Table 3: Panel data on the average GDP at current market prices in the “new” EU countries and Croatia, in EUR by PPS per inhabitant, 2000–2011
Year BG RO CZ EE HU LT LV PL SL SK HR
2000 5400 5000 13500 8600 10300 7500 6900 9200 15200 9500 9500 2001 5900 5500 14400 9200 11500 8300 7600 9400 15800 10300 10000 2002 6500 6000 15000 10200 12500 9100 8400 9900 16800 11100 10700 2003 6900 6500 15800 11300 12900 10300 9100 10100 17300 11500 11300 2004 7500 7400 16900 12400 13600 11100 10100 10900 18700 12300 12100 2005 8200 7800 17800 13800 14200 12300 11100 11500 19600 13500 12800 2006 9000 9100 18900 15600 14900 13600 12500 12300 20700 14900 13700 2007 10000 10400 20600 17500 15300 15500 14300 13600 22100 16900 15100 2008 10900 11700 20200 17200 15900 16100 14600 14100 22700 18100 15800 2009 10300 11100 19400 14900 15300 13600 12700 14200 20200 17000 14500 2010 10800 11700 19700 15600 16100 15100 13500 15400 20600 18100 14300 2011 11700 12200 20300 17400 16900 16900 15000 16400 21200 18900 15300
Note: the period when each country under study entered the EU is presented in grey. Source: the European Commission, 2014a
variable “GDP per capita”. The results of the calculations obtained by using Kendall’s correlation coeficient are generalized in the next Table.
Table 4: Correlations between average GDP per capita, its interregional variation and countries’ joining the EU, 2000–2011, n = 10 countries
Country – the “new” EU member
Kendall’s correlation coeficient between country’s average GDP per capita (in EUR) and joining the EU (yes or no)
Kendall’s correlation coeficient between country’s interregional variation of GDP per capita (coeficient of variation) and joining the EU (yes or no)
Partial correlation between interregional variation of GDP per capita and joining the EU, with blocked variable “GDP per capita” Bulgaria r=0.728**, p=0.004 r=0.728**, p=0.004 r=0.628, p=0.039
Romania r=0.734**, p=0.004 r=0.734**, p=0.004 r=-0.252, p=0.454
Czech Republic r=0.696**, p=0.007 r=0.653*, p=0.011 r=-0.282, p=0.401
Estonia r=0.702**, p=0.006 r=0.609*, p=0.017 r=0.561, p=0.073
Hungary r=0.702**, p=0.006 r=0.658*, p=0.011 r=0.099, p=0.772
Lithuania r=0.702**, p=0.006 r=0.653*, p=0.011 r=0.269, p=0.424
Latvia r=0.696**, p=0.007 r=0.131, p=0.610 r=0.321, p=0.336
Poland r=0.696**, p=0.007 r=0.609*, p=0.017 r=0.052, p=0.880
Slovenia r=0.696**, p=0.007 r=0.707**, p=0.006 r=0.331, p=0.320
Slovak Republic r=0.702**, p=0.006 r=0.680**, p=0.008 r=0.369, p=0.263
* Correlation is signiicant at the 0.05 level (2-tailed)
** Correlation is signiicant at the 0.01 level (2-tailed)
Source: elaborated by the authors on the basis of Table 1 and 3
Table’s 4 data show that the average GDP per capita in the countries of Central and Eastern Europe correlates with the factor of their membership in the EU: the economic performance of the “new” EU countries before their accession to the EU was signiicantly lower, then after the accession. In its turn, the statistically signiicant and rather strong correlation interdependence between interregional variations of countries’ GDP per capita can be found only when the inluence of GDP per capita is not blocked irrespective whether the country is or is not a member of the EU. If to control, i.e. practically to neutralize, the inluence of the variable “GDP per capita” in partial correlation, the fact of the accession of a country into the EU and interregional variation of GDP per capita in this country are no longer interconnected.
experienced the same trend both average GDP per capita and its variation between internal regions as investigated “new” EU countries (compare Figure 3 with Figures from Appendix, see Table 3).
Figure 3: Trends of Croatian average GDP per capita and its variation* between
internal regions (NUTS 3) of Croatia, 2000–2011, % (2000=100%), n = 21 regions
– in percents – 2000 = 100
0 20 40 60 80 100 120 140 160 180
2000 2001 2002 2003 2004 2005 2006 2007 2008 2009 2010 2011 Average GDP per capita Interregional variation of GDP per capita
* Coeficient of variation, characterized σ-convergence and obtained by the ratio of the standard
deviation to the mean of the sample (Marques and Soukiazis, 1998).
Source: calculated and worked out by the authors on the basis of European Commission, 2014a
market economy from administrative command one, for the increase of its average GDP per capita in 2000s after its dramatic decrease in early 1990s. Croatia also shares this experience with the “new” EU countries due to its transition to market economy in 1990s.
5. Results and discussion
The results of the carried out research show that in terms of economic performance and its interregional variation a large increase in overall GDP per capita followed by strengthening of regional divergence of economic performance in the “new” EU countries for a irst glance turned out to be the main consequence of their accession to the EU. Though, comparing the “new” EU countries with Croatia, which was not EU member during the period under study, but had the similar trends of the average GDP per capita and its interregional variation as target countries investigated within this research, it becomes clear that real determinant of the growth of economic performance of the “new” EU countries is more than decade of self-development of these countries in market economy, which just synchronized with the entering of countries of Central and Eastern Europe in the EU.
How to explain these results and their economic signiicance? The authors agree with the opinion of J.G. Williamson, which has been repeatedly cited in this article, that due to the increased growth of metropolitan regions, which usually accompanies the general economic growth of a self-developing country, there is a regional divergence of economic performance. But over time, the economic cost of capital cities become too high, and the capital starts “spreading” into the regions. During the last year of the period under study (2011) in most of the reference countries, despite the continuing growth of average GDP per capita, there was the same trend of regional convergence (i.e. decrease of regional divergence) of economic performance observed (see Table 2), following the inverted U-shaped trend of regional divergence described by J.G. Williamson (1965), and we have the basis to expect the continuing of this trend in the future.
Taking into account the fact that economic inequality of internal regions is inevitable in parallel with economic growth of a country at early stages of moving to market economy, it is possible to assume the existence of a certain maximum (optimal) level of such inequality, which once being exceeded will have a negative impact on the economic growth. A.B. Gusev (2014) using econometric modelling, found minimum and maximum permitted values of economic inequality in regions, considering them a factor that stimulates the growth of GDP.
2008). There are several mechanisms, which brought trade integration to the equalization of the levels of the development in the EU countries, but it did not equalize the levels of economic performance of the regions in these countries. Due to a number of structural and institutional factors, in contrast to the rich regions, the poor regions could not use their competitive advantages, while the poor countries, competing with the rich ones could do it.
Thus, the viability (on political and social levels) of the policy regarding the equalization of the levels of economic performance between the internal regions of the countries, which enter the European Union (or any other union of states), depends on the ability to distribute fairly the beneits derived from the economic activity of the country within a new union between its internal regions. The practical result of the discussions of strengthening inequality in regional development of the EU countries was a signiicant increase of the cohesion policy budget, including exactly for regional convergence (European Commission, 2014b), as well as consolidation of the goal to equalize the level of economic performance of the regions in the irst section of the Single European Act. However, the results of several studies (Becker, 2012; Becker et al., 2010, 2012) show that these European funds remained mainly in the most economically developed regions (with a greater ability to attract these funds); this situation reinforced the processes of regional divergence in the “new” EU countries.
6. Conclusions
of each separate country, this problem can be solved. If the researcher turns to the data of national statistics, the processes of regional (di)convergence can be studied in more depth, but without any comparison with other EU countries. The quality of the economic growth in the “new” EU countries with a high level of regional divergence of economic performance is deicient, because it is achieved by economic ballooning of the traditionally prosperous economic regions against the backdrop of the increasing backlog of the deprived areas. Thus, another task for the future research in this area, as well as in the ield of regional economic policy in the “new” EU countries can be suggested: to ind and maintain an optimal level of the interregional variation of economic performance, the excess of which has a negative impact on the economic growth of the country in general. For regional economic and development policy of a country, which is either a candidate country for the EU accession or has recently become a EU member state, for instance, Croatia, the obtained results neither mean that it could expect from the unionization act some signiicant changes in trends of economic performance of a country as a whole nor in trends of interregional variation of economic performance within a country. As the research data show, all these changes – both positive and negative – are determined by the length of the period of independent development of a country under the conditions of market economy and general GDP growth rather than on the factor of unionization. So, nowadays an improvement of economic performance of a country as a whole and of its internal regions cannot be declared by policy-makers as the reason for joining any union of countries – for instance, the EU.
References
Armstrong, H.W. (1995) “An Appraisal of the Evidence from Cross-Sectional Analysis of the Regional Growth Process within the European Union”. In: Armstrong, H.W., Vickerman, R.W. eds. Convergence and Divergence among European Regions, London: Pion Ltd.
Barro, R.J. (1991) “Economic Growth in a Cross Section of Countries”, Quarterly Journal of Economics, Vol. 106, No. 2, pp. 407-443.
Barro, R.J., Sala-i-Martin, X. (1991) “Convergence across States and Regions”,
Brooking Papers on Economic Activity, Vol. 1, pp. 107-182.
Barro, R.J., Sala-i-Martin, X. (1992a) “Convergence”, Journal of Political Economy, Vol. 100, No. 2, pp. 223-251.
Barro, R.J., Sala-i-Martin, X. (1992b) “Regional Growth and Migration: a Japanese-US Comparison”, Journal of the Japanese and International Economy, Vol. 6, No. 4, pp. 312-346.
Barro, R.J., Sala-i-Martin, X. (1995) Economic Growth, New York: McGraw-Hill. Barro, R.J., Sala-i-Martin, X. (1997) “Technological Diffusion, Convergence, and
Barro, R.J., Mankiw, G.N., Sala-i-Martin, X. (1995) “Capital Mobility in Neoclassical Models of Growth”, American Economic Review, Vol. 85, No. 1, pp. 103-115. Baumol, W.J. (1986) “Productivity Growth, Convergence, and Welfare: What the
Long-Run Data Show”, American Economic Review, Vol. 76, No. 5, pp. 1072-1085.
Becker, S.O. (2012) EU Structural Funds: Do They Generate More Growth?
Available from: <http://www.chathamhouse.org/sites/iles/chathamhouse/ public/Research/International%20Economics/1212bp_becker.pdf> [Accessed August 31, 2014].
Becker, S.O., Egger, P.H., Ehrlich, M. (2010) “Going NUTS: The Effect of EU Structural Funds on Regional performance”, Journal of Public Economics, Vol. 94, No. 9-10, pp. 578-590.
Becker, S.O., Egger, P.H., Ehrlich, M. (2012) “Too Much of a Good Thing? On the Growth Effects of the EU’s Regional policy”, European Economic Review, Vol. 56, No. 4, pp. 648-668.
Bond, S., Hoefler, A., Temple, J. (2001) “GMM Estimation of Empirical Growth Models”, CERP Discussion Paper, No. 3048.
Cheshire, P.C., Hay, D.G. (1989) Urban Problems in Western Europe: An Economic Analysis, London: Unwin Hyman.
Cheshire, P.C., Magrini, S. (2000) “Endogenous Processes in European Regional Growth: Convergence and Policy”, Growth and Change, Vol. 31, No. 4, pp. 455-479.
Cheshire, P.C., Magrini, S. (2002) “The Distinctive Determinants of European Urban Growth: Does One Size Fit All?” Research Papers in Environmental and Spatial Analysis, No. 73, London School of Economics.
Cheshire, P.C., Carbonaro, G. (1995) “Convergence-Divergence in Regional Growth Rates: An Empty Black Box?” In: Armstrong, H.W., Vickerman, R.W. eds. Convergence and Divergence among EuropeanRegions, London: Pion Ltd. Cirkunov, D. (2010) “Trends of Convergence and Divergence in Social and
Economic Development of Countries of the Central and Eastern Europe: Empirical Analysis” [in Russian], Journal of International Law and International Relationships, Vol. 4, pp. 87-94.
Dall’erba, S., Le Gallo, J. (2003) “Regional Convergence and the Impact of the European Structural Funds Over 1989-1999: A Spatial Econometric Analysis”,
REAL Discussion Papers.
Davies, A., Lahiri, K. (1995) “A New Framework for Testing Rationality and Measuring Aggregate Shocks Using Panel Data”, Journal of Econometrics, Vol.
68, No. 1, pp. 205–227.
Dustmann, C., Rochina-Barrachina, M.E. (2007) “Selection Correction in Panel Data Models: An Application to the Estimation of Females’ Wage Equations”,
Eisenhart, C. (1947) “The Assumptions Underlying the Analysis of Variance,”
Biometrics, Vol. 3, pp.1-21.
European Commission. (2014a) “Gross Domestic Product (GDP) at Current Market Prices by NUTS3 Regions [nama_r_e3gdp]”, Eurostat Database [Internet]. Available from: <http://epp.eurostat.ec.europa.eu/portal/page/portal/statistics/ search_database> [Accessed August 31, 2014].
European Commission. (2014b) Cohesion Policy 2014-2020. [Internet]. Available from: <http://ec.europa.eu/regional_policy/what/future/index_en.cfm>[Accessed August 31, 2014].
European Communities. (2007) “Regions in the European Union. Nomenclature of Territorial Units for Statistics. NUTS 2006/EU-27”, Eurostat Methodologies and working papers [Internet]. Available from: <http://epp.eurostat.ec.europa. eu/cache/ITY_OFFPUB/KS-RA-07-020/EN/KS-RA-07-020-EN.PDF> [Accessed August 31, 2014].
Fisher, R.A. (1921) “On the Probable Error of a Coeficient of Correlation Deduced from a Small-Sample Mean,” Metron, Vol. 4, No. 1, pp. 3-32.
Forster, M., Jesuit, D., Smeeding, T. (2005) “Regional Poverty and Income Inequality in Central and Eastern Europe: Evidence from the Luxembourg Income Study”. In: Kanbur, R., Venables, A.J. eds. Spatial Inequality and Development, Oxford University Press.
Granberg, А., Zaiceva, J. (2003) Gross Regional Product: Interregional Comparison and Dynamics [in Russian], Мoscow: SОPS.
Gusev, A.B. (2014) Estimation of Inluence of Interregional Economic Inequality on Macroeconomic Growth [in Russian]. Available from: <http://riep.ru/upload/ iblock/6a9/6a944c3122097dd481a5ab53850cdaec.pdf> [Accessed August 31, 2014].
Hausman, J.A., Taylor, W.E. (1981) “Panel Data and Unobservable Individual Effects”, Econometrica, Vol. 49,pp. 1377-1398.
Heckman, J. (1981) “Statistical Models for Discrete Panel Data”. In: Manski, C.F., McFadden, D. eds. Structural Analysis of Discrete Data with Econometric Applications, Cambridge, MA: the MIT Press.
Heckman, J.J. (2001) “Micro Data, Heterogeneity and Evaluation of Public Policy. Nobel Lecture”, Journal of Political Economy, Vol. 109, pp. 673-748.
Hill, F., Gaddy, C. (2003) The Siberian Curse: How Communist Planners Left Russia out in the Cold, Washington: Brookings Institution Press.
Hoover, K.D., Perez, S.J. (2004) “Truth and Robustness in Cross-Country Growth Regressions”, Oxford Bulletin of Economics and Statistics, Vol. 66, No. 5, pp. 765-798.
Iodchin, А.А. (2010) “Econometric Modeling of Interregional Convergence in Russia” [in Russian], Dissertation of the Candidate in Economics, Moscow: Moscow State University named after M.V. Lomonosov.
Kumer, S., Ullah, A. (2000) “Semiparametric Varying Parametric Panel Data Models: An Application to Estimation of Speed of Convergence”, Advances in Econometrics, Vol. 14, pp. 109-128.
Lavrinenko, O., Voronov, V., Ozols, A. (2013) “Analysis and Evaluation Imbalances in the Development of EU Regions (1995 – 2011)”, Journal of Economic Sociology, Vol. 1, No.1, pp. 99-115.
Lavrinenko, O., Lavrinovica, I., Jeimovs, N. (2012) “Sustainable Development, Economic Growth and Differentiation of Incomes of Latvian Population”,
Journal of Security and Sustainability Issues, Vol. 2, No. 1, pp. 33-39.
Lavrinenko, О., Voronov, V. (2008) “Investigation of Inhabitants’ Incomes Polarization in Latvian Regions” [in Russian]. In: Ignasiak-Szulc, A., Kosiedowsky, W. eds. Problemy wspolpracy gospodarczej w regione baltyckim w kontekscie integracji europejskiej, Torun: Nicolaus Copernicus University. Lavrinenko, O. (2010) The Research on the Differences in Formation of the Living
Standard of Central and Eastern Europe Population by Regions, Summary of the Doctoral thesis, Daugavpils University.
Lavrovskiy, B.L. (1999) “Measuring of Regional Asymmetry on the Case of Russia” [in Russian], Issues of Economics, Vol. 3, pp. 23-39.
Levin, A., Lin, C. (1993) “Unit Root Tests in Panel Data: New Results”, Economics Working Paper Series, No. 93-56, University of California San Diego.
Maddala, G.S. (2001) Introduction to Econometrics (3rd edition), New York: Wiley. Magrini, S. (2004) Regional (Di)Convergence. In: Henderson, V.J., Thisse, J.F.
eds. Handbook of Regional and Urban Economics: Cities and Geography,
Amsterdam: Elsevier.
Marques, A., Soukiazis, E. (1998) “Per Capita Income Convergence across Countries and across Regions in the European Union. Some New Evidence”,
Paper presented during the 2nd International meeting of European Economy organized by CEDIN(ISEG) in Lisbon. Available from: <http://www4.fe.uc.pt/ ceue/working_papers/iconver.pdf> [Accessed August 31, 2014].
Martin, Ph. (2008) Geography of Inequality in Europe [in Russian]. Available from: <http://demoscope.ru/weekly/2009/0381/analit07.php>[Accessed August 31, 2014]. Mel’nikova, L.V. (2008) “About a Rhetoric of Regional Science and Regional
Policy”, A Region: Economics and Sociology, Vol. 1, pp. 76-104.
Postnikova, J., Shil’cin, J. (2007) “About Some Speciic Features of Regional Balance of Russia” [in Russian], A Region: Economics and Sociology, Vol. 2, pp. 47-69.
Quah, Danny Tyson. (1993) “Galton’s Fallacy and Tests of the Convergence Hypothesis”, Scandinavian Journal of Economics, Vol. 95, pp. 427-443.
--- (1996a) “Regional Convergence Clusters across Europe”, European Economic Review, Vol. 40, pp. 951-958.
--- (1996b) “Twin Peaks: Growth and Convergence in Models of Distribution Dynamics”, Economic Journal, Vol. 106, pp. 1045-1055.
--- (1996c) “Empirics for Economic Growth and Convergence”, European Economic Review, Vol. 40, pp. 1353-1375.
--- (1997) “Convergence Empirics across Economies with (Some) Capital Mobility”, Journal of Economic Growth, March, Vol. 1, pp. 95-124.
Ramkissoon, R. (2002) “Explaining Differences in Economic Performance in Caribbean Economies”. In: Proceedings of International Conference on “Iceland and the World Economy: Small Island Economies in the Era of Globalization”, 20 May, Cambridge, Center for International Development (CID), Harvard University.
Ranjpour, R., Karimi, T.Z. (2008) “Evaluation of the Income Convergence Hypothesis in Ten New Members of the European Union. A Panel Unit Root Approach”, Panoeconomicus, Vol. 2, pp. 157-166.
Ratnikova, Т.А. (2006) “Introduction into Econometric Analysis of Panel Data” [in Russian], Economic Journal of the Highest School of Economics, Vol. 2, pp. 267-316.
Sabel’nikova, J.М. (2012) Modelling of Processes of Regional Convergence in Russia [in Russian]. Available from: <http://lomonosov-msu.ru/archive/ Lomonosov_2012/1946/35013_109b.pdf> [Accessed August 31, 2014].
Sala-i-Martin, X. (1990) On Growth and States, Ph.D. thesis, Harvard University. Sala-i-Martin, X. (1995) “The Classical Approach to Convergence Analysis”,
Economics Working Paper, No. 117, Yale University, Universitat Pompeu Fabra.
Sala-i-Martin, X. (1996) “Regional Cohesion: Evidence and Theories of Regional Growth and Convergence”, European Economic Review, Vol. 40, pp. 1325-1352.
Sala-i-Martin, X. (1994) “Cross-Sectional Regressions and the Empirics of Economic Growth”, Economics Working Paper, No. 79. Available from: <http:// econ.upf.edu/docs/papers/downloads/79.pdf> [Accessed August 31, 2014]. Simpson, S.D. (2014) Macroeconomics: Economic Performance and Growth.
Solow, R.M. (1957) “Technical Change and the Aggregate Production Function”,
The Review of Economics and Statistics, Vol. 39, No. 3, pp. 312-320.
Stiglitz, J.E., Sen, A., Fitoussi, J.P. (2014) Report by the Commission on the Measurement of Economic Performance and Social Progress. Available from: <http://www.stiglitz-sen-itoussi.fr/documents/rapport_anglais.pdf> [Accessed August 31, 2014].
Swaine, D.G. (1998) “What Do Cross-Sectional Growth Regressions Tell Us about Convergence?” Working Papers Series, No. 98-4, Boston: Federal Reserve Bank of Boston.
Tochickaya, I. et al. (2008) General Trends and Perspective of Economic Development of Countries – Members of EuroAsianEU for a Middle-Term (2007—2010) [in Russian]. Available from: <http://case.com.pl/upload/publikacja_plik/20932248_ sa364.pdf> [Accessed August 31, 2014].
Voronov, V.V., Lavrinenko, O.Y., Stasane, Y.V. (2014) “Estimation of Dynamics of Interregional Differences (European Experience)” [in Russian], Sociological Researchs, Vol. 1, pp. 29-39.
Williamson, J.G. (1965) “Regional Inequality and the Process of National Development: A Description of the Patterns”, Economic Development and Cultural Change, Vol. 13, No. 4, pp. 3-45.
Posljedice ulaska zemalja u EU na gospodarsku uspješnost njihovih internih
regija (NUTS 3)
1Vera Boronenko2, Vladimirs Mensikovs3, Olga Lavrinenko4
Sažetak
Cilj istraživanja ovog rada je utvrditi posljedice ulaska zemalja u EU na interne regije u smislu regionalne konvergencije ili divergencije. Koncepcija analize temelji se na teoriji konvergencije u kojoj se tvrdi da industrijski sustavi konvergiraju zbog određenih učinaka tehnološkog razvoja. Uzorci za empirijsku analizu su NUTS 3 regije unutar „novih” zemalja EU-a (zemlje bivšeg socijalističkog bloka koje su ušle u EU 2004. i 2007.) i Hrvatska kao „kontrolna zemlja”, čiji se gospodarski učinak mjeri realnim BDP-om po stanovniku za period od 2000. do 2011., a primijenjena metoda je osnovna analiza panel podataka. Glavni rezultati istraživanja omogućuju da se pokaže da pozitivno percipirani trend stvarnog pada gospodarske uspješnosti u međuregionalnoj varijaciji unutar „novih” zemalja EU-a nije posljedica ulaska u Europsku uniju. S obzirom na rezultate istraživanja, osnovni zaključak jest da „nove” države EU-a prolaze kroz prirodni obrnuti U-trend promjena svojih gospodarskih razvojnih varijacija koje ovise o rastu prosječnog BDP-a po stanovniku i o dužini razdoblja samo-razvoja pod uvjetima tržišnog gospodarstva a ne o faktoru „unionizacije” unutar Europske unije.
Ključne riječi: „nove” EU zemlje, interne regije, gospodarska uspješnost, regionalna konvergencija, regionalna divergencija
JEL klasiikacija: O11, O18, R58
1 Ovaj rad je nastao uz potporu Marie Curie FP7-PEOPLE-2011-COFUND programa –
NEW-FELPRO (The new International Fellowship Mobility Programme for Experienced Researchers in Croatia – Novi međunarodni istraživački program mobilnosti za iskusne istraživače u Hrvat-skoj) u okviru projekta “Rethinking Territory Development in Global Comparative Researches/ Promišljanje teritorijalnog razvoja u globalnim komparativnim istraživanjima (Rethink Develop-ment/Promišljanje razvoja)”, Grant Agreement No. 10/ Sporazum o dodijeli sredstava br. 10.
2 Doktor ekonomskih znanosti, Glavni znanstveni istraživač, Institute of Social Research,
Daugavpils University, 1 Parades street, Daugavpils, LV-5401, Latvia; znanstveni suradnik, Ekonomski fakultet, Sveučilište u Rijeci, Ivana Filipovića 4, 51000 Rijeka, Hrvatska. Znanstveni interes: regionalna ekonomija. Tel.: +371 29 538 031. E-mail: [email protected] (autor – kontakt osoba).
3 Redoviti profesor, doktor sociologije, Direktor of the Institute of Social Research, Daugavpils
University, 1 Parades street, Daugavpils, LV-5401, Latvia. Znanstveni interes: ekonomska sociologija. Tel.: +371 29 151 759. E-mail: [email protected].
4 Doktor ekonomskih znanosti, Glavni znanstveni istraživač, Institute of Social Research,
Appendix
Figure 4: Trends of Bulgarian average GDP per capita and its variation* between
internal regions (NUTS 3) of Bulgaria, 2000–2011, % (2000=100%), n = 28 regions
0 50 100 150 200 250
2000 2001 2002 2003 2004 2005 2006 2007 2008 2009 2010 2011 Average GDP per capita Interregional variation of GDP per capita
* Coeficient of variation, characterized σ-convergence and obtained by the ratio of the standard
deviation to the mean of the sample (Marques and Soukiazis, 1998).
Source: calculated and worked out by the authors on the basis of European Commission, 2014a
Figure 5: Trends of Romanian average GDP per capita and its variation* between
internal regions (NUTS 3) of Romania, 2000–2011, % (2000=100%), n = 42 regions
0 50 100 150 200 250 300
2000 2001 2002 2003 2004 2005 2006 2007 2008 2009 2010 2011
Average GDP per capita Interregional variation of average GDP per capita
* Coeficient of variation, characterized σ-convergence and obtained by the ratio of the standard
deviation to the mean of the sample (Marques and Soukiazis, 1998).
Figure 6: Trends of Estonian average GDP per capita and its variation* between
internal regions (NUTS 3) of Estonia, 2000–2011, % (2000=100%), n = 5 regions
0 50 100 150 200 250
2000 2001 2002 2003 2004 2005 2006 2007 2008 2009 2010 2011
Average GDP per capita Interregional variation of average GDP per capita
* Coeficient of variation, characterized σ-convergence and obtained by the ratio of the standard
deviation to the mean of the sample (Marques and Soukiazis, 1998).
Source: calculated and worked out by the authors on the basis of European Commission, 2014a
Figure 7: Trends of Czecn average GDP per capita and its variation* between
internal regions (NUTS 3) of the Czech Republic, 2000–2011, % (2000=100%), n = 14 regions
0 20 40 60 80 100 120 140 160 180
2000 2001 2002 2003 2004 2005 2006 2007 2008 2009 2010 2011 Average GDP per capita Interregional variation of average GDP per capita
* Coeficient of variation, characterized σ-convergence and obtained by the ratio of the standard
deviation to the mean of the sample (Marques and Soukiazis, 1998).
Figure 8: Trends of Hungarian average GDP per capita and its variation* between
internal regions (NUTS 3) of Hungary, 2000–2011, % (2000=100%), n = 20 regions
0 20 40 60 80 100 120 140 160 180
2000 2001 2002 2003 2004 2005 2006 2007 2008 2009 2010 2011
Average GDP per capita Interregional variation of GDP per capita
* Coeficient of variation, characterized σ-convergence and obtained by the ratio of the standard
deviation to the mean of the sample (Marques and Soukiazis, 1998).
Source: calculated and worked out by the authors on the basis of European Commission, 2014a
Figure 9: Trends of Polish average GDP per capita and its variation* between internal regions (NUTS 3) of Poland, 2000–2011, % (2000=100%), n = 66 regions
0 20 40 60 80 100 120 140 160 180 200
2000 2001 2002 2003 2004 2005 2006 2007 2008 2009 2010 2011 Average GDP per capita Interregional variation of GDP per capita
* Coeficient of variation, characterized σ-convergence and obtained by the ratio of the standard
deviation to the mean of the sample (Marques and Soukiazis, 1998).
Figure 10: Trends of Slovenian average GDP per capita and its variation* between
internal regions (NUTS 3) of Slovenia, 2000–2011, % (2000=100%), n = 12 regions
0 20 40 60 80 100 120 140 160
2000 2001 2002 2003 2004 2005 2006 2007 2008 2009 2010 2011 Average GDP per capita Interregional variation of GDP per capita
* Coeficient of variation, characterized σ-convergence and obtained by the ratio of the standard
deviation to the mean of the sample (Marques and Soukiazis, 1998).
Source: calculated and worked out by the authors on the basis of European Commission, 2014a
Figure 11: Trends of Slovakian average GDP per capita and its variation*
between internal regions (NUTS 3) of Slovak Republic, 2000–2011, % (2000=100%), n = 8 regions
0 50 100 150 200 250
2000 2001 2002 2003 2004 2005 2006 2007 2008 2009 2010 2011 Average GDP per capita Interregional variation of GDP per capita
* Coeficient of variation, characterized σ-convergence and obtained by the ratio of the standard
deviation to the mean of the sample (Marques and Soukiazis, 1998).
Figure 12: Trends of Lithuanian average GDP per capita and its variation* between
internal regions (NUTS 3) of Lithuania, 2000–2011, % (2000=100%), n = 10 regions
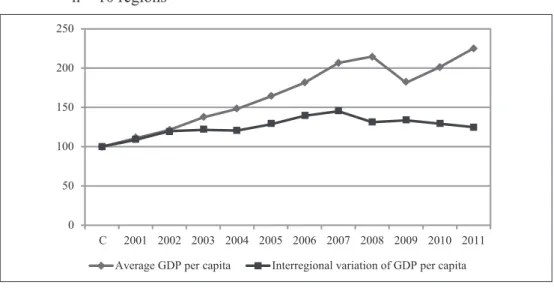
0 50 100 150 200 250
C 2001 2002 2003 2004 2005 2006 2007 2008 2009 2010 2011 Average GDP per capita Interregional variation of GDP per capita
* Coeficient of variation, characterized σ-convergence and obtained by the ratio of the standard
deviation to the mean of the sample (Marques and Soukiazis, 1998).
Source: calculated and worked out by the authors on the basis of European Commission, 2014a
Figure 13: Trends of Latvian average GDP per capita and its variation* between
internal regions (NUTS 3) of Latvia, 2000–2011, % (2000=100%), n = 6 regions
0 50 100 150 200 250
2000 2001 2002 2003 2004 2005 2006 2007 2008 2009 2010 2011
Average GDP per capita Interregional variation of GDP per capita
* Coeficient of variation, characterized σ-convergence and obtained by the ratio of the standard
deviation to the mean of the sample (Marques and Soukiazis, 1998).