_____________________________
*)
Corresponding author
:
[email protected]doi: 10.2298/SOS1302189D
UDK 677.017.5
Optoelectronic Properties Correlation to Preparation of
Au/La-oxide Nanocomposite Films
A. A. Dakhel
Department of Physics, College of Science, University of Bahrain, P.O. Box 32038,
Kingdom of Bahrain
Abstract:
Gold nanoparticles were grown in La-oxide thin films deposited on quartz and silicon substrates. These films were annealed in pure hydrogen gas atmosphere at 300 oC for different durations 15 min, 30 min, and 45 min and characterised by the X-ray fluorescence (XRF) and X-ray diffraction. The matrix La-oxide remained amorphous up to 400 °C. The fraction of Au in La-oxide host material was 7 % molar with crystallite size of 6.8 nm. The Au NPs slightly grew by annealing in H2 gas at 300 K. The samples were investigated by
UV-Vis-NIR absorption spectroscopy and dc-electrical measurements. They exhibit conducting properties and with H2 gas annealing, they showed red shifting of the bandgap with
remarkable reduction of optical absorption coefficient by ~25 % and remarkable increase in electrical conductivity ~124 %. A global study of the influence of low-temperature post annealing in H2 gas on the electrical, structural, optical, and optoelectronic properties was
conducted.
Keywords: Optical properties; Au-incorporated La oxide; Composite materials; Annealing in H2 gas, Gold plasmon.
1. Introduction
Composites including ceramics and cermets have various applications in different industrial fields. Such obtained nanocomposite materials has enabled obtaining exceptional effects of a good, for example, combination of mechanical -electric properties [1]. For instance, electrical components can get very hot, they need to behave like ceramics, but, since they also need to conduct electricity, it helps if they work like metals. Cermets are suitable to use in components such as resistors. Various oxides and ceramics that include metallic nanoparticles (NPs) have received much attention for their unique optical properties, which found a variety of applications as optical diodes, chemical gas sensors, etc [2-7] as well as used in transparent conducting oxide (TCO) applications [8-11]. For example, Au-incorporated ZnO nanomaterial was successfully used as sensor (electronic nose) for detection of volatile organic compounds [12]. Recently, gold NPs of sizes 3-6 nm supported on rare-earth oxide medium with a concentration of 1-2 %mol was prepared by chemical method and morphologically investigated [13]. The present work reports the optical and conduction properties of conductive gold NPs-incorporated lanthanum oxide films post-annealed in hydrogen atmosphere for different optical and electrical applications.
(without reduction) enhances the electrical conduction of many metal oxides like CdO, SnO2,
ZnO, and Al-doped ZnO [14-17]. This conduction enhancement was attributed to the reducing in the effect of depletion regions formed on grain and crystallite boundaries [17-19] rather than creation of H+ ions in the lattice of annealed oxide as was explained in Ref [20-22]. The present work investigates this point i.e. investigate the enhancement of electrical conduction of La-oxide films incorporated with Au NPs by annealing in H2 gas and its influence on the
structural and optical properties.
2. Experimental details
The starting materials were pure lanthanum element 99.9 % (from Fluka A. G.) and pure gold metal 99.99 % (from Aldrich Chem. Co.). The alternating thermal deposition (layer-by-layer, etc) method was used to deposit the starting materials on clean quartz (from SPI supplies, PA, USA) and silicon wafer substrates held at about 150 oC in a vacuum chamber of residual oxygen atmosphere of pressure about 1.3x10⁻² Pa. The evaporated masses were controlled with a piezoelectric microbalance crystal sensor (Philips FTM5) fixed close to the substrates. The as-grown films were totally oxidised and stabilised by flash annealing in pure dry O2-atmosphere at 400 oC for 1 h. The final film’s thickness was measured after
annealing by Gaertner L117 ellipsometer. The molar ratio (r) of Au relative to La were determined by energy dispersive X-ray fluorescence (EDX) technique using a setup with an X-ray beam obtained from a Cu-anode Philips tube (Philips PW-1710) operating at regime 15 kV, 5 mA, and an Amptek XR-100CR sensitive detector. The radiographic analysis method [23, 24] was used to determine r. It based on measuring of the integral intensity of La L
α
-signal excited by Cu Kα
-line and Au Lα
signal excited by the bremsstrahlung radiation. The reference samples were pure thin La2O3 and Au films. The structures of the films werestudied by θ-2θ X-ray diffraction (XRD) method using a Philips PW 1710 with Cu Kα
radiation (0.15406 nm) and step 0.01o. The spectral optical transmittance and reflectance were measured at normal incidence in UV-VIS-NIR spectral region (300-3000 nm) with a Shimadzu UV-3600 double beam spectrophotometer. The resistivity was measured by conventional two-lead method.
One set of films of 5%Au (molar) were found to be insulating of resistivity about 9.6
×
104 Ω.cm , which is lower than that of identically prepared pure La oxide of about 3.1×
107 [25]. However, second set of films of 7 %Au were found to be conducting of resistivity about 1.6.cm Ω
×
10-3 Ω.cm and TCC of 1.2×
10-3 K-1. This means that the electronic percolation threshold (EPT) should be around 6 % (in-between 5 % and 7 %molar). The variation of the resistivity is given in semilog graph as inset of Fig.2. The set of conductive films of 7 %Au were further processed by annealing in hydrogen atmosphere at 300 oC for 15 min (H15), 30 min (H30), and 45 min (H45) (H0 refers to the non-hydrogenated Au/La-oxide composite film).3. Results and discussions
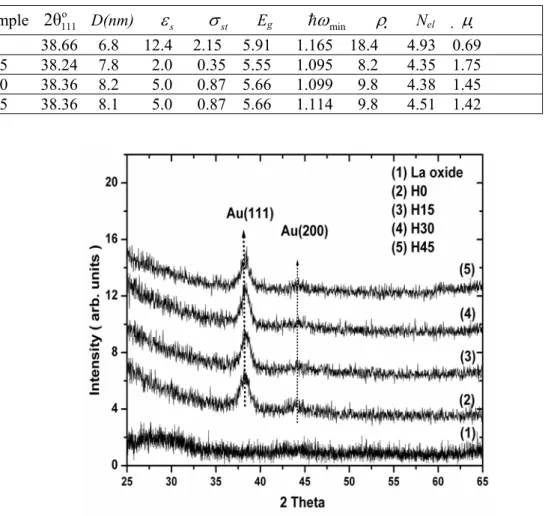
trigonal structure La2O3 when annealed at 600 oC. The intense (111) peak of Au NPs is
shifted as compared with that of pure Au due to the structural strain that was calculated and given in Table I with its corresponding compressive strain (the estimation was done by using the bulk modulus (B) given in ref.[27]). From Tab. I, one can observe that annealing in H2 gas
gradually removed the structural stress reaching minimum value in H15 film, and then approached a steady state value in H30 and H45 films.
Tab. I Au (111) X-ray reflection Bragg angle, ; average Au crystallite size, D (nm);
compressive structural strain of Au NPs, ; compressive stress on Au NPs,
o 111
2
θ
3
( 10 )
sε
×
−st
σ
(GPa); bandgap, Eg (eV); reflection threshold energy, hω
min(eV); resistivity,ρ
×
Ω.cm ); concentration of electrons, Nel (
×
cm-3); carrier mobility, andμ
(cm2/V.s)of the prepared H0, H15, H30, H45, Au/La-oxide nanocomposite films grown on quartz substrates.
Sample
2
θ
111o D(nm)ε
sσ
st Eg hω
minρ
Nel μ
H0 38.66 6.8 12.4 2.15 5.91 1.165 18.4 4.93 0.69 H15 38.24 7.8 2.0 0.35 5.55 1.095 8.2 4.35 1.75 H30 38.36 8.2 5.0 0.87 5.66 1.099 9.8 4.38 1.45 H45 38.36 8.1 5.0 0.87 5.66 1.114 9.8 4.51 1.42
Fig. 1. XRD patterns of H0, H15, H30, and H45 films together with that of a pure La oxide
film grown on quartz substrates. The radiation used was Cu K
α
- line.The 7 %Au/La-oxide nanocomposite film resistivity as a function of time duration of post annealing in H2 gas atmosphere is presented in Fig. 2. The hydrogenated samples have
Fig. 2. Dependence of resistibility of Au/La-oxide nanocomposite film on the time of
annealing in pure H2 gas atmosphere. The inset shows the variation of resistivity on % molar
Au content in Au/La-oxidenanocomposite film showing the I-to-M transformation near ~6%.
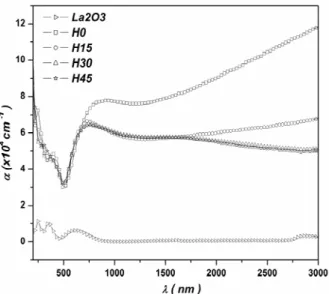
Fig. 3. Normal spectral absorption coefficient in the UV-Vis-NIR regions for H0, H15, H30,
and H4 films together with that of pure La oxide grown on quartz substrates.
The spectral absorption coefficient
α λ
( )
was calculated from the experimental data of normal transmittanceT
( )
λ
and reflectanceR
( )
λ
by [28]:α λ
( )
=
(1 / ) ln[(1
d
−
R
) / ]
T
, where d is the film thickness; 0.175μ
m
for 7%Au film and 0.24μ
m
for La-oxide film. The experimental data ofR
( )
λ
andT
( )
λ
were corrected due to the substrate effects according to the method given in Ref. [29], which needs to measure the reflectance from both sides of the film/substrate system. Fig.3. shows the spectral absorption coefficientα λ
( )
in the UV-Vis-NIR wavelength range for H0, H15, H30, and H45 films together with that of La-Oxide film grown on quartz substrates. A clear effect of annealing in H2 gas appears in Vis and NIRregions was observed, where both the transmittance and reflectance have increased with time-period of annealing in H2 gas. The precise investigation showed that the peaks observed on the
clearly observed only when the Au grain size ~ 3.5 nm or less [30].
Fig. 4. Tauc plot of vs. photon energy (E) for direct bandgap determination. The
inset shows the variation of bandgap with annealing time in H
2
(
α
E
)
2 gas atmosphere.
The absorption coefficient is related to the incident photon energy (E =h
ω
) by: ~ ( - )m [31], where Eg
E E E
α g is the band gap of the film material and the exponent m
depends on the type of transitions: m=1/2, 2 corresponding to the direct and indirect transitions, respectively. It was observed that the best value suitable to the obtained data of the present work is m=1/2. Thus, the extrapolating of the linear portion of the
plots to the energy axis, as shown in Fig. 4, give the values of E
2
(
α
E vs E
)
.
g that are tabulated in Table I.
The obtained values of Eg for all investigated samples are lower than that of pure La oxide:
6.18 eV [31] or 6.4 eV [32]. It was observed that the energy gap narrowed with low-temperature annealing in H2 gas, as shown in the inset of Fig. 4, so that the bandgap attains
the lowest value for sample H15 (for which the electrical resistivity attains the lowest value and the compression micro stress attains the minimum value.).
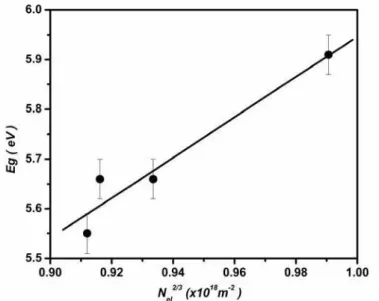
Fig. 5. The dependence of bandgap of H0, H15, H30, and H45 films on Nel2/3 according to
The red shift of principal absorption edge can be interpreted by the effect of Moss-Burstein (B-M). According to B-M model, the optical-absorption edge energy position is proportional to the free-electron density in conduction band (Nel) (determined from the
reflectance analysis) through the following relation [33,34]: ,
where is the Plank constant, and the reduced effective mass to free-electron mass.
Fig.5 shows the linear relationship
2 * 2
( / 2 ) (3 )
~
g el el
E h m π N 2 / 3
h *
el
m
2 / 3
vs. g el
E N following B-M model. Analogous results was
obtained for the H2-annealed ZnO:Al and CdO [16,35].
The reflectance spectra,
R
( )
λ
, for H0, H15, H30, and H45 films shown in Fig. 6. have a metal-like behaviour. The reflection is due to the gold nanoparticles. It shows almost linear increasing function ofλ
in NIR spectral region forλ
>1000 nm. However, the increasing of R withλ
for H30 and H45 films is stronger that that for H0 and H15. For the analysis, the energy dependence of the reflectance in the NIR spectral region was plotted as shown in the inset of Fig. 6.Fig. 6. Normal spectral reflectance in the UV-Vis-NIR regions for H0, H15, H30, and H45
films together with that of pure La oxide grown on quartz substrates. The inset shows the photon-energy dependence of the reflectance in the NIR regions for H0, H15, H30, and H45
films.
The minimum (threshold) of the reflectance spectrum occurs at slightly higher frequency than plasma
ω
p, and can be found by [36], where1/ 2
min p /( 1)
ω
=ω ε
∞ −ε
∞is thedielectric constant for the bound electrons of gold nanoparticles (not the surrounding medium) that caused the reflection behaviour, which is equal to 6.0 [37] or 6.9 [38]. Thus the plasmon energy for H0 is
h
ω
p≈
2.6
eV
orλ
p=
478
nm
which close to the usually found value for gold. The Drude free-electron plasma frequency is defined by [26, 39]:ω
p2 =N eel 2/mel*ε
0,where
N
elis the electronic concentration,ε
0is the permittivity of free space, and c is the free-space velocity of light. The electronic effective massm
el* is equal to (1±0.03)mel in Au, wheremel is the free-electron mass [40]. The experimental values of h
ω
minfor the nanocompositeel
μ
was calculated from the well-known relationμ
el=
(
e N
ρ
el)
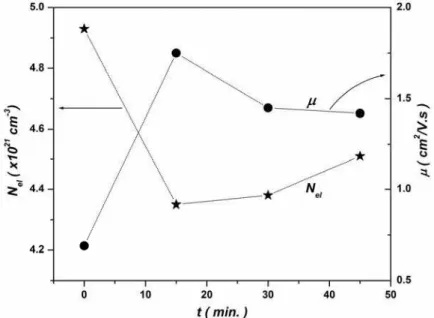
−1. The carrier concentration as well as the mobility was influenced by the annealing in H2 gas atmosphere as shown in Fig.7. In general, one can observe that sample annealed in H2 for 15 min attain a minimum
resistivity of 8.2
×
10-4Ω
.cm, largest mobility 1.75 cm2/V.s, and lowest carrier concentration of 4.35×
1021 cm-3.Fig. 7. Dependence of the carrier concentration and mobility of Au/ La-oxide nanocomposite
film on the time of annealing in H2 gas atmosphere.
The electrical conduction in composite systems comprising an intricate network of conducting and insulating phases is determined by two mechanisms, percolation in a continuous conducting network and/or tunneling between isolated conducting particles (grains, crystallites, etc.) [41,43]. For both cases, there is an electronic percolation (EPN) network necessary to conduct electricity by any mechanism including tunneling. This means that the conduction could be controlled by means of annealing in H2 gas, which affects the
physical properties of the electronic conducting network or tunneling network (TN) [43]. In general, one of the favourable roles of annealing in H2 gas is to reduce or passivity the effect
of depletion regions or potential barriers formed between Au grains and, therefore, enhance tunnelling and decreasing the grain boundary scattering, which finally improves the electrical conductivity, as mentioned in Ref.[16,44,45]. Furthermore, the hydrogenation process is related to the increase of electron transfer on Au NPs facilitating through the embedding amorphous medium [46].
4. Conclusions
It was established that La-oxide films incorporated with 7 %Au consist of Au-NPs (6.8 nm) embedded in amorphous La oxide and exhibit conducting properties. Annealing in H2 gas affects all structural, optical, and electrical properties. It enlarged the Au NPs, reduced
the compressive micro stresses on the Au NPs, and reduced the bandgap of the composite film material. Results show that with 15 min annealing in H2 gas, the transmittance in NIR region
that the conductivity and mobility have the highest value for H15 sample. The improving of conductivity and optical transmittance of the nanocomposite film under H2-annealing are
important action from TCO application point of view and suggests Au/La-oxide films to be used in TCO-like applications.
5. References
1. Z. Andjic, M. Korac, Z. Kamberovic, A. Vujovic, M. Tasic, Science of Sintering, 39 (2007) 145.
2. G. Teowee, K. C. McCarthy, T. J. Bukowski, T. P. Alexander, S. Motakef, D. R. Uhlmann, Ferroelectrics, ISAF ’96., Proceedings of the Tenth IEEE International Symposium on Applications of, Vol. 2, 1996, pp. 671-674.
3. P. R. Watekar, S. Ju, W. –T. Han, Colloids and Surfaces A: Physicochem. Eng. Aspects 313/314 (2008) 492.
4. S. Ju, V. L. Nguyen, P. R. Watekar, B. H. Kim, C. Jeong, S, Boo, W. –T. Han, J.Nano Sci. Nano Technol. 6 (2006) 1.
5. M. Menning, M. Schmitt, U. Becker, G. Jung, H. Schmidt, SPIE Sol-Gel Optics III, Vol. 2288, pp.130-139,1994.
6. D. Kundu, I. Honma, T. Osawa, H. Komiyama, J. Am. Ceram. Soc., 77 (1994) 1110. 7. S. Ogawa, Y. Hayashi, N. Kobayashi, T. Tokizaki, A. Nakamura, Jpn. J. Appl. Phys.
33 (1994) L331.
8. R. Maity, K. K. Chattopadhyay, Solar Energy Mater. & Solar Cells 90 (2006) 597. 9. S. Shu, Y. Yang, J. E. Medvedova, J. R. Ireland, A. W. Metz, J. Ni, C. R. Kannewurf,
A. J.Freeman, T. J. Tobin, J. American Chem. Soc. 126 (2004) 13787.
10. Yu. Yang, S. J. Shu, J. E. Medvedeva, J. R. Ireland, A. W. Metz, Ni Jun, M. C. Hersam, A. J. Freeman, T. J. Marks, J. Am. Chem. Soc. 127 (2005) 8796.
11. H. T. Cao, Z. L. Pei, J. Gong, C. Sun, R. F. Huang, L. S. Wen, Surface Coatings Technol. 184 (2004) 84.
12. C. Wongchoosuk, S. Choopun, A. Tuantranont, T. Kerdcharoen, Materials Research Innovations 13 (2009) 185
13. S. K. Bhargava, D. B. Akolekar, G. Foran, J. Molecular Catalysis A: Chemical 267 (2007) 57.
14. G. J. Exarhos, X. –D. Zhou, Thin Solid Films 515 (2007) 7025. 15. C. G. Van de Walle, Phys. Rev. Lett. 85 (2000) 1012.
16. E. A. Davis, S. F. J. Cox, R. L. Lichti, C. G. Van de Walle, Appl. Phys. Lett. 82 (2003) 592.
17. B. Y. Oh, M. C. Jeong, D. S. Kim, W. Lee, J. M. Myoung, J. Cryst. Growth 281 (2005) 475.
18. K. Zhang, F. Zhu, C. H. A. Huna, A. T. S. Wee, J. Appl. Phys. 86 (1999) 974. 19. S. Y. Myong, K. S. Lim, Appl. Phys. Lett. 92 (2003) 3026.
20. C. G. Van de Walle, J. Alloys Compounds 446-447 (2007) 48.
21. C. G. Van de Walle, Y. Bar-Yam, S. T. Pantelides, Phys. Rev. Lett. 60 (1988) 2761. 22. C. Herring, N. M. Johnson, C. G. Van de Walle, Phys. Rev. B 64 (2001) 125209. 23. S. Hayakawa, Jia Xiao-Peng, M. Wakatsuki, Y. Gohshi and T. Hirokawa, J. Crystal
Growth 210 (2000) 388.
24. E. F. Kaelble(ed.), Handbook of X-rays for Diffraction, Emission, Absorption, and Microscopy, McGraw-Hill, New York, 1967, p. 17-5.
25. A. A. Dakhel, J. Alloys Comp. 433 (2007) 6-10. 26. A. A. Dakhel, Mater. Chem. Phys.102 (2007) 266.
27. C. Kittel, Introduction to Solid State Physics, seventh edition, John Wiley & Sons,
28. W. Q. Hong, J. Phys. D: Appl. Phys. 22 (1989) 1384.
29.
M. Medles, N. Benramdane, A. Bouzidi, A. Nakrela, H. Tabet-Derraz, Z.
Kebbab, C. Mathieu, B.Khelifa, R. Deafeux, Thin Solid films 497 (2006) 58.
30. J. Siegel, O. Lyutakov, V. Rybka, Z. Kolska, V. Svorcík, Nanoscale Research Letters 6 (2011) 96
31. J. Tauc, Optical properties of Solids, Edited by F. abeles. North Holland, 1969. 32. J. –B. Cheng, A. –D. Li, Q. –Y. Shao, H. –Q. Ling, D. Wu, Y. Wang, Y. –J. Bao, M.
Wang, Z. –G. Liu, N. –B. Ming, Appl. Surf. Sci. 233 (2004) 91. 33. E. Burstein, Phys. Rev. 93 (1954) 632.
34. T. S. Moss, Proc. Phys. Soc. Lond. B67 (1954) 775.
35. A. A. Dakhel, Semicond. Sci. Technol. 23 (2008) 055017 (6pp) 36. R. E. Kroon, Infrared Physics & Technology 51 (2007) 31
37. X. Wang, K. -ping Chen, M. Zhao, D. D. Nolte, OpticsExpress 18 (2010) 24859. 38. I. N. Shklyarevskii, P. L. Pakhmov, USSR, Optika i Spektroskopiya 34 (1973)163,
MIT internet site: http://www.mit.edu/~6.777/matprops/gold.htm 39. Z. Qiao, C. Agashe, D. Mergel, Thin Solid Films 496 (2006) 520 40. J. Szczyrbowski, J. Phys. D: Appl. Phys. 19 (1986) 1257.
41. D. Toker, D. Azulay, N. Shimoni, I. Balberg, O. Millo, Phys. Rev. B 68 (2003) 041403(R) (4 pages)
42. P. Sheng, E. K. Sichel, J. I. Gittleman, Phys. Rev. Lett. 40 (1978) 1197. 43. E.K. Sichel, J.I. Gittleman, P. Sheng, Phys. Rev. B 18 (1978) 5712.
44. M. L. Addonizio, A. Antonaia, G. Cantele, C. Privato, Thin Solid Films 349 (1999) 93.
45. T. Tsuji, M. Hirohashi, Appl. Surf. Sci. 157 (2000) 47. 46. S. Pramanik , S. Pal, G. De, J. Mater. Chem. 20 (2010) 9081.
Са р а: -
La-.
300 oC 15, 30, 45
. La-o
400 °C. Au La- 7 %
6,8 nm. Au H2 300 K.
UV-Vis-NIR dc- .
H2,
~25 % ~124 %.
- H2
, , .
К учн р чи: ; La Au;