www.atmos-meas-tech.net/8/4475/2015/ doi:10.5194/amt-8-4475-2015
© Author(s) 2015. CC Attribution 3.0 License.
An analytical system for the measurement of stable hydrogen
isotopes in ambient volatile organic compounds
T. Meisehen, F. Bühler, R. Koppmann, and M. Krebsbach
Institute for Atmospheric and Environmental Research, University of Wuppertal, Wuppertal, Germany
Correspondence to:T. Meisehen ([email protected])
Received: 1 May 2015 – Published in Atmos. Meas. Tech. Discuss.: 10 July 2015 Revised: 23 September 2015 – Accepted: 2 October 2015 – Published: 23 October 2015
Abstract. Stable isotope measurements in atmospheric volatile organic compounds (VOCs) are an excellent tool to analyse chemical and dynamical processes in the at-mosphere. While up to now isotope studies of VOCs in ambient air have mainly focussed on carbon isotopes, we herein present a new measurement system to investigate hydrogen isotope ratios in atmospheric VOCs. This sys-tem, consisting of a gas chromatography pyrolysis iso-tope ratio mass spectrometer (GC-P-IRMS) and a pre-concentration system, was thoroughly characterised us-ing a VOC test mixture. A precision of better than 9 ‰ (in δ2H) is achieved forn-pentane, 2-methyl-1,3-butadiene (isoprene),n-heptane, 4-methyl-pentane-2-one (4-methyl-2-pentanone), methylbenzene (toluene), n-octane, ethylben-zene, m/p-xylene and 1,2,4-trimethylbenzene. A compari-son with independent measurements via elemental analy-sis shows an accuracy of better than 9 ‰ for n-pentane,n -heptane, 4-methyl-2-pentanone, toluene andn-octane. Above a minimum required pre-concentrated compound mass the obtained δ2H values are constant within the standard devi-ations. In addition, a remarkable influence of the pyrolysis process on the isotope ratios is found and discussed. Reliable measurements are only possible if the ceramic tube used for the pyrolysis is sufficiently conditioned, i.e. the inner surface is covered with a carbon layer. It is essential to verify this conditioning regularly and to renew it if required. Further-more, influences of a necessary H+3 correction and the pyrol-ysis temperature on the isotope ratios are discussed. Finally, the applicability to measure hydrogen isotope ratios in VOCs at ambient levels is demonstrated with measurements of out-side air on 5 different days in February and March 2015. The measured hydrogen isotope ratios range from−136 to
−105 ‰ for n-pentane, from −86 to −63 ‰ for toluene,
from−39 to−15 ‰ for ethylbenzene, from−99 to−68 ‰ form/p-xylene and from−45 to−34 ‰ foro-xylene.
1 Introduction
Isotope effects in nature providefingerprintsof physical and chemical processes, which are often difficult to quantify. The ratios of stable isotopes in trace constituents in the atmo-sphere are altered in almost all processes they are involved in, such as chemical reactions, thermodynamic equilibration, diffusion, phase transitions, photolytic processes and isotope exchange reactions. The large variety of possible applications ranges from the reconstruction of past climates to the inves-tigation of current physical and chemical processes in the at-mosphere.
inves-tigate physical and chemical processes on a wide range of temporal and spatial scales (micro-scale processes, exchange processes between different atmospheric regions, both hor-izontally and vertically, large-scale transport processes and interdependencies between different compartments of the Earth system). Such studies provide valuable information on the dominant processes on these scales, since VOCs have highly variable atmospheric lifetimes (hours to months) and different sources (biogenic, anthropogenic, chemical re-actions in the atmosphere) (Rudolph, 2007). Furthermore, VOCs are useful tracers to investigate reactions that are not directly accessible to current measurement techniques or as probes to visualisetransport and mixing processes (also in case of rapid mixing) in the atmosphere or across atmo-spheric boundaries.
However, to our knowledge up to now almost all stud-ies concerning ambient VOCs concentrated on carbon iso-tope ratios. In principle, the investigation of isoiso-tope ratios of other elements can further improve our understanding of at-mospheric processes by adding additional pieces of informa-tion. Measurements of2H/1H would be especially promis-ing. Hydrogen isotope effects will be more pronounced than carbon isotope effects because of the larger mass ratio of 2H/1H than that of13C/12C leading to larger kinetic iso-tope effects (KIEs) of hydrogen compared to carbon (Ian-none et al., 2004, 2005; Gensch et al., 2014).
Owing to the much lower isotope abundances of 2H (0.015 %; De Biévre et al., 1984) compared to 13C (1.1 %; De Biévre et al., 1984), significant larger sample volumes (∼200 L, instead of ∼20 L for carbon) are needed to ob-tain adequate signal-to-noise ratios in the isotope ratio mass spectrometer. Regarding the expected δ2H values of atmo-spheric VOCs (−290 to−140 ‰) based on published stud-ies of source rocks, crude oil, sediments, plant waxes and aerosol particles (Xiong et al., 2005; Liu et al., 2006; Yeh and Epstein, 1981; Duan et al., 2011; Bi et al., 2005; Ya-mamoto and Kawamura, 2010; Greule et al., 2012) and the few known KIEs (∼10 to ∼100 ‰; Iannone et al., 2004, 2005), stable hydrogen isotope ratios should at least be mea-sured with a precision (in terms ofδ-values) of 10–20 ‰ to identify isotope effects. For measurements of hydrogen iso-tope ratios in atmospheric VOC at ambient concentrations, the currently available sample preparation techniques have to be modified to allow for the analysis of a large volume whole air samples. Furthermore, it has to be ensured that the analysis can be done with sufficient sensitivity and precision to identify changes in hydrogen isotope ratios occurring in atmospheric processes.
Recently, two studies were published using bothδ13C and
δ2H measurements of selected VOCs under specific con-ditions (von Eckstaedt et al., 2011a, b). The authors ap-plied a gas chromatograph pyrolysis isotope ratio mass spec-trometer (GC-P-IRMS) to investigate stable isotope ratios in emissions from biomass combustion, the exhaust from diesel and petrol cars, and from an aluminium industry stack.
They obtained δ2H values for a variety of VOCs, but ob-viously at rather high concentrations compared to atmo-spheric conditions. Theirδ2H values ranged from−280 to
+30 ‰. Another very recent study concerning benzene and methylbenzene (toluene) emissions from cars (Kikuchi and Kawashima, 2013) obtainedδ2H values in these compounds ranging from−159.5 to−25.6 and−59.2 to−19.3 ‰, re-spectively. They compared their source measurements with ambient samples taken at a roadside. Here they foundδ2H values of−174.4 to−74.9 and−134.7 to−35.0 ‰ for ben-zene and toluene, respectively, which indicates an impact of the sources to the ambient values. These measurements seem to be the only availableδ2H values of VOCs in ambient air so far. Another study on ambient VOCs is reported by Rice and Quay (2009). However, their study solely focusses on formaldehyde. These studies showed that it is generally pos-sible to measureδ2H values of VOCs with considerable pre-cision. To our knowledge, there are no other measurements of stable hydrogen isotope ratios in atmospheric VOCs reported up to now.
In this paper we describe a method for measurements of
δ2H of atmospheric VOCs based on a modification of ex-isting methods for the measurement ofδ13C in atmospheric VOCs (see Iannone et al., 2007; Wintel et al., 2013).
2 Experimental set-up
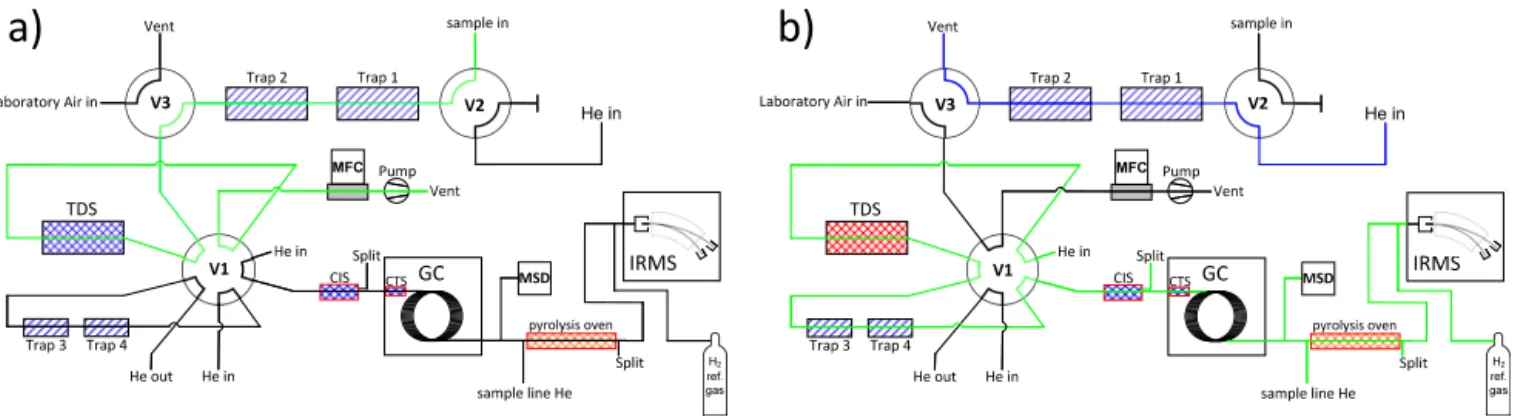
Hydrogen isotope ratios were measured by a GC-P-IRMS in continuous flow mode. The system consists of four main components: (1) a pre-concentration unit designed for high volume whole air samples, (2) a gas chromatograph coupled to a quadrupole mass spectrometer, (3) a pyrolysis unit, and (4) an isotope ratio mass spectrometer. Figure 1 schemati-cally shows the set-up of the GC-P-IRMS. The total anal-ysis time for one measurement is 180 min for VOCs pre-concentrated from a volume of 50 L of air for the charac-terisation measurements.
2.1 Sample preparation
lo-✁ ✂✄☎ ✆ ✝✞ ✟
✠✡ ☛☞✌ ✍ ✎✏✑
Figure 1.Schematic of the measurement system in the pre-concentration mode(a): the sample volume is drawn through traps 1+2 (reduction of water) and TDS, where the VOCs are trapped. A sample gas stream is represented by the green line. System in transfer mode(b): the sample is desorbed from TDS through traps 3+4 (water reduction) to CIS and CTS for cryogenic focussing. After desorption from the CTS the VOCs are chromatographically separated and detected in the MSD as well as in the IRMS after passing the pyrolysis oven. The sample gas stream is represented as a green line, whereas the blue line shows a helium flow for purging the TDS and traps 1+2 after desorption. See text for more detail.
cated inside the gas chromatography (GC) oven. It allows for a rapid cooling and heating (12 K s−1) of a 5 cm long sec-tion of the capillary. To avoid wall losses, the TDS and all traps are Sulfinert® coated (Restek GmbH, Bad Homburg, Germany). All temperatures are individually controlled by a combination of cooling by liquid nitrogen and electrical heating.
During the experiments, two different configurations of the TDS were tested. In the first configuration (A), the TDS was packed with glass beads (60/80 mesh), on which the VOCs were cryogenically trapped. In this configuration TDS temperatures were set to 103 and 503 K for adsorption and desorption, respectively. In the second configuration (B) the VOCs were extracted from the sample using Tenax®TA (Sigma-Aldrich Chemie GmbH, Taufkirchen, Germany). In this configuration temperatures were set to 272 and 573 K for adsorption and desorption, respectively. The advantage of Tenax®TA is the very low break through volume for wa-ter and especially for CO2(Helmig and Vierling, 1995) and therefore it has widely been used for sampling atmospheric VOCs (see for example Rudolph et al., 1990). This reduces significantly the amount of CO2in the pre-concentrated sam-ple, thus preventing the CTS from freezing over which was frequently observed when VOCs where pre-concentrated on glass beads.
In both configurations the sample is drawn through traps 1 and 2 and the TDS for 50 min with a mass flow of 1000 mL min−1using a rotary pump. The sample volume can be altered by varying the time of the pre-concentration step or the flow rate. The volume of the whole air sample for all char-acterisation measurements presented here was∼50 L. Traps 1 and 2 are used to reduce water from the atmospheric sam-ples at 253 K prior to pre-concentrating the VOCs on the ad-sorbent within the TDS at the respective adsorption temper-ature (depending on the packing material). Valves 1, 2 and 3
are inpre-concentration positionat this step (cf. Fig. 1a). In configuration A, H2O and CO2are also partially trapped be-cause of the low TDS temperature; in configuration B CO2 and most of H2O are mainly exhausted with the bulk air. In the next step, valve 2 is switched to thetransfer position
to flush the TDS with helium for 2 min. After this, valves 1 and 3 are also switched to transfer position and the desorbed VOCs pass through two additional traps (traps 3 and 4) to the CIS (cf. Fig. 1b). At that time the TDS is heated up to the re-spective desorption temperature (depending on the packing material) at a rate of 40 K min−1. The VOCs are desorbed for 20 min with a helium flow rate of 110 mL min−1and fo-cussed on the CIS at 103 K. Traps 3 and 4 are set to 243 K and used to further reduce H2O following the pre-concentration step (Thompson, 2003). To avoid any wall losses all transfer lines in the TDSG-L are held at 393 K. In a last focussing step the VOCs are desorbed in a splitless mode from the CIS with a flow rate of 4 mL min−1by heating it to 523 K at a rate of 12 K s−1and trapped on the CTS at 103 K. After 3 min the VOCs are desorbed by heating the CTS to 503 K at a rate of 12 K s−1, which marks the start of the chromatographic sep-aration.
2.2 Gas chromatograph and mass selective detector The VOCs are separated by gas chromatography (GC 7890A, Agilent Technologies Inc., Santa Clara, CA, USA) using a two-column combination consisting of a non-polar Rtx®−1 (Restek GmbH) column (105 m, 0.32 mm ID, 3 µm df) fol-lowed by a mid-polarity Crossbond®phase Rxi®-624Sil MS (Restek GmbH) column (60 m, 0.32 mm ID, 1.8 µm df). Us-ing helium as the carrier gas, the initial GC temperature is 233 K (cooled with LN2 and held isothermal for 12 min) and increased at a rate of 4 K min−1 to a temperature of 473 K (held for 1 min). The oven temperature is then finally increased to 503 K at a rate of 20 K min−1. The flow rate through the columns is kept constant at 4 mL min−1 dur-ing the whole temperature programme. Followdur-ing separation, a minor part of the eluent is directed to the mass selective de-tector, the major part to the pyrolysis oven and the isotope ratio mass spectrometer (IRMS) (split ratio approx. 1:9).
A mass selective detector (MSD; quadrupole mass anal-yser 5975C, Agilent Technologies Inc., Santa Clara, CA, USA) allows for identification and quantification of the com-pounds. The MSD is operated at a measurement frequency of about 7 Hz and a mass range of 15–200 u. The quadrupole was kept at a temperature of 423 K, the source temperature was kept at 503 K. While the MSD is currently only used for identification during the characterisation measurements it will also be used to quantify substances when measuring unknown air samples.
2.3 Pyrolysis oven
In the pyrolysis oven (GC 5, Isoprime Ltd., Manchester, UK), the VOCs are decomposed and the hydrogen atoms re-combine to hydrogen molecules. During first tests, we used a quartz tube (ID ∼0.5 mm) packed with chromium pel-lets, operated at 1273 K, for pyrolysis of the VOCs. Because the quartz tube was blocked obviously with elemental car-bon after only a few measurements, it was replaced by a ce-ramic tube (ID ∼0.5 mm) which is operated at a ture of 1723 K. This turned out to be the optimum tempera-ture with respect to reproducible isotope ratio measurements (see Sect. 3.3.2). The resulting1H2and1H2H molecules are then transferred to the (sector field) IRMS via an open split and a 1 m deactivated fused silica capillary (0.1 mm ID). To maintain a constant flow through the pyrolysis oven and to avoid back diffusion, an additional helium flow (sample line helium) of approximately 1 mL min−1 is added to the flow through the ceramic tube.
2.4 Isotope ratio mass spectrometer
The isotope ratio measurements are performed with the Iso-prime 100 IRMS (IsoIso-prime Ltd.). After ionisation the ions pass through the electric and magnetic fields and are col-lected by Faraday cups. The resulting signals yield two
chro-matograms, one of1H2(major signal) and one of1H2H (mi-nor signal). From these data theδ2H values of the individual VOCs are determined with respect to the H2 working ref-erence gas (Air Liquide GmbH, Düsseldorf, Germany) with aδ2H of −261 ‰ vs. Vienna Standard Mean Ocean Water (VSMOW). The working reference gas is connected to the IRMS via a reference gas injector box (Isoprime Ltd.) and a second open split. It allows supplying working reference gas peaks at certain times. For this purpose a pneumatic valve controlled by the IRMS software is opened for 30 s for each working reference gas peak.
Theδ2H values are determined as follows. For each peak, major and minor signals are integrated automatically by the software IonVantage Continuous Flow Data Processing (CFDP v. 1.4.9.0), correcting for the H+3 contribution (also see Sect. 3.4) (Sessions et al., 2001a, b). If necessary, the integration parameterspeak startandpeak endare adjusted manually. Finally, for each peak the ratios of mass 3 (1H2H) to mass 2 (1H2) are calculated and converted to δ2H val-ues with regard to VSMOW considering the working refer-ence gas2H/1H ratio by Eqs. (1) and (2), where21HH
sample
and 21HH
ref. are the calculated mass ratios of the sample peak and the working reference gas peaks, respectively, and
δ2Href.-VSMOWis the knownδ2H value of the working refer-ence gas with regard to VSMOW.
δ2Hraw=
2H 1H
sample−
2H 1H
ref.
2
H
1H
ref.
(1)
δ2H=δ2Hraw+δ2Href.-VSMOW+δ2Hraw·δ2Href.-VSMOW (2)
2.5 VOC test mixture
For the characterisation experiments a test mixture with known VOC mixing and isotope ratios is needed. We pre-pared a VOC test mixture by injecting 16 VOCs (see Table 1) from the liquid phase through a septum into a gas cylinder (Messer Industriegase GmbH), which was finally pressurised with N2to 60 bar. The final mixing ratios of the compounds range from 92 to 523 ppbV. As the mixing ratios of the VOCs in this test mixture are much higher than ambient levels, the VOC test mixture is diluted with purified synthetic air (purity
1323 K. As internal laboratory standards three water sam-ples covering the scale from 0 to−100 ‰ were used which were calibrated with International Atomic Energy Agency -Standard Mean Ocean Water (IAEA-SMOW), International Atomic Energy Agency -Greenland Ice Sheet Precipitation (IAEAGISP) and International Atomic Energy Agency -Standard Light Antarctic Precipitation (IAEA-SLAP).
Using the VOC test mixture our analytical system was thoroughly tested, especially with respect to possible frac-tionation effects during sample pre-concentration and analy-sis. In addition the measuredδ2H values were compared to the results obtained by Agroisolab.
3 Results of the characterisation experiments
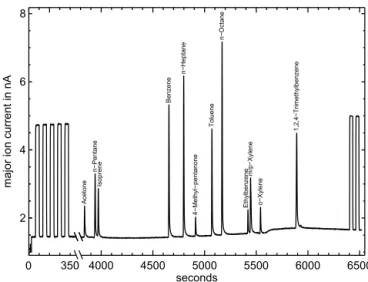
The system as described above was characterised with re-spect to (1) the suitability of the adsorbent material in the TDS, (2) reproducibility, stability, linearity and detection limit, (3) an influence of the pyrolysis on the δ2H values and (4) an influence of the H+3 correction on theδ2H values. All measurements described in the following were performed with the VOC test mixture diluted with purified synthetic air (dilution 1:76). An example of a typical chromatogram measured by the IRMS is shown in Fig. 2. At the beginning of each chromatogram, five measurements of the working refer-ence gas were performed. At the end of each chromatogram, the working reference gas was measured again (2 peaks). Using the GC programme described above, we are able to analyse 10 of the 16 compounds contained in the VOC test mixture for hydrogen isotope ratios. Methanol, acetone, pen-tanal, propanal and hexanal cannot be analysed due to too small peak areas or to an influence by a water background at retention times lower than 3800 s. Moreover, no isotope values for benzene are presented because Tenax®TA pro-duces a significant benzene background. This effect was al-ready observed in previous studies (De Bortoli et al., 1992). With the exception of n-pentane and isoprene the peaks of all other compounds presented here were baseline separated with peak areas of 5 to 50 nAs (major signal) and can thus reliably be analysed. All results presented in the following are mean values calculated from a set of individual measure-ments. Furthermore, the standard deviations are calculated and corrected with the t factor considering Student’st dis-tribution because of the limited number of individual data points.
3.1 Adsorbent material in the TDS
As stated above, two different configurations of the TDS were used. Initially, we used the TDS packed with glass beads (configuration A). However, when analysing ambient air, measurements using the TDS in this configuration are limited to a sample volume of about 30 L because of the high amount of CO2(at 400 ppmV this corresponds to 24 mg
350
0 4000 4500 5000 5500 6000 6500
seconds 2
4 6 8
majorl
ionl
current
linl
nA
A
cet
one
n
−
P
ent
ane
Isoprene
B
enzene
n
−
Hept
ane
4
−
Met
hyl
−
pent
anone
T
oluene
n
−
O
ct
ane
E
thylbenzene
m/
p
−
X
ylene
o
−
X
ylene
1,
2,
4
−
T
rimet
hylbenzene
Figure 2.Example of an IRMS chromatogram (major signal) of the VOC test mixture. Working reference gas peaks are added at the beginning (5 peaks) and the end (2 peaks) of every chromatogram.
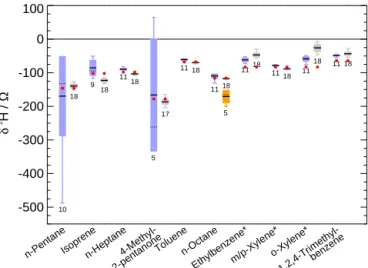
CO2), which freezes out in the CIS and blocks the liner. As the2H/1H analysis of ambient VOCs needs sample volumes of about 200 L (160 mg CO2at 400 ppmV) this configuration is no longer suitable for measurements of ambient air. There-fore, we changed the adsorbent material from glass beads to Tenax®TA (configuration B). Theδ2H values of the VOC test mixture (CO2-free) were determined in both configurations (Fig. 3). Although for some compounds (isoprene,n-heptane, xylenes) slight differences between both configurations were observed, there is a good agreement within the standard de-viations. When evaluating the differences, it should be noted that part of this deviation is obviously due to a change in the H+3 factor because of a necessary renewal of the filament be-tween both measurement series. Moreover, the standard devi-ations (size of the boxes) indicate that the measurements us-ing Tenax®TA show a higher precision than those using glass beads. First test measurements of ambient air (see Sect. 3.5) showed that using configuration B measurements of sample volumes up to 200 L are possible without difficulty.
3.2 Reproducibility, stability, linearity and detection limit
differ-Table 1.Compounds contained in the VOC test mixture, volumes of the liquids injected into the gas cylinder and final mixing ratios. For comparison the hydrogen isotope ratios and standard deviations obtained by our GC-P-IRMS as well as the results of EA (Agroisolab) of the pure liquids are shown. Furthermore, the minimum compound mass to yield stable isotope ratios is given in ng.
Compounds Volume in µL Mixing ratio in ppb δ2H / ‰ Agroisolab Minimum
compound mass in ng
n-Pentane 6.73 306±19 −139.7±7.6 −146.6±1.3 150
n-Heptane 9.35 406±34 −103.2±2.1 −98.4±1.1 360
Toluene 8.60 508±42 −69.7±2.5 −68.9±0.5 310
1,2,4-Trimethylbenzene 11.21 373±58 −43.1±5.4 −64.0±0.5 500 4-Methyl-2-pentanone 9.35 n/a −186.5±8.7 −178.1±1.2 n/a
Xylenes+Ethylbenzene∗ 9.91 −83.8±1.1
m/p-Xylene 263±15 −87.6±2.2 190
o-Xylene 104±11 −26.1±12 120
Ethylbenzene 92±8 −46.9±7.1 110
Isoprene 6.36 401±24 −123.1±5.4 −102.8±0.9 240
n-Octane 10.66 401±24 −117.4±1.3 −116.2±0.9 310
∗Xylenes and ethylbenzene are one liquid mixture and thus only oneδ2H value can be measured by EA.
-500 -400 -300 -200 -100 0 100
δ
2H / ‰
n-Pentane Isoprene n-Heptane 4-Methyl- 2-pentanone
Toluene n-Octane
Ethylbenzene* m/p-Xylene* o-Xylene*
1,2,4-Trimethyl- benzene 10
9 11
5 11
11
11 11 11
11
18 18
18
17 18
18 18
18
18 18
5
Figure 3.Compound-specificδ2H in different VOCs adsorbed on glass beads (blue boxes) and Tenax®TA (grey boxes), respectively. The size of each box represents the standard deviation, minimum and maximum values are indicated by the whiskers, solid and dashed black lines mark the mean and median value, respectively. The numbers below the boxes indicate the corresponding number of measurements. The values obtained by Agroisolab are represented as red dots. The orange box represents the mean value and standard deviation of δ2H ofn-octane measured while a degrading of the conditioning of the ceramic tube in the pyrolysis oven is observed (see Sect. 3.3.1) (*not comparable to the results of Agroisolab); see text for more detail.
ent pressure levels resulting in different peak heights (0.3 to 5 nA in the major signal). The variation of the calculatedδ2H values is lower than 0.4 ‰ nA−1.
Following the verification that Tenax®TA is a suitable ad-sorbent the reproducibility and linearity of the complete
sys-tem was verified by several individual measurements of the VOC test mixture.
In case of the reproducibility test, 18 individual measure-ments of the diluted VOC test mixture were performed. The obtained standard deviations in δ2H values are better than 2.5 ‰ forn-heptane, toluene,n-octane, andm/p-xylene, and better than 9 ‰ for all other compounds except o-xylene (12 ‰). These results show (at least for the compounds in-vestigated) that the system is well-suited to achieve the pre-cision necessary to identify hydrogen isotopic effects in am-bient VOCs. Comparison of the mean δ2H values and the
δ2H values obtained by the bulk analysis of the primary com-pounds by Agroisolab shows a good agreement within the standard deviations of our measurements and the uncertain-ties given by Agroisolab for n-pentane, 4-methyl-pentane-2-one (4-methyl-2-pentanone), toluene, andn-octane (Fig. 3 and Table 1). The uncertainties given by Agroisolab are the standard deviation of the measurements and the uncertainties of three secondary standards used for the calibration. The dif-ferences between both mean values are lower than 5 ‰ for
n-heptane, toluene, andn-octane and lower than 9 ‰ forn -pentane and 4-methyl-2-pentanone. A larger difference of 15 and 20 ‰ is only evident for 1,2,4-trimethylbenzene and iso-prene, respectively. A direct comparison ofδ2H values of the xylenes and ethylbenzene is not possible because only a mix-ture of these compounds was at our disposal. Thus, using EA, Agroisolab could only determine the bulkδ2H value of this mixture.
0 10 20 30 peak8area8in8nAs -125
-120 -115 -110 -105 -100 -95
δ
2H8
/8
‰
-125 -120 -115 -110 -105 -100 -95
preconcentrated compound8mass in8ng:
100 200 310 410 510 610 710 810 910
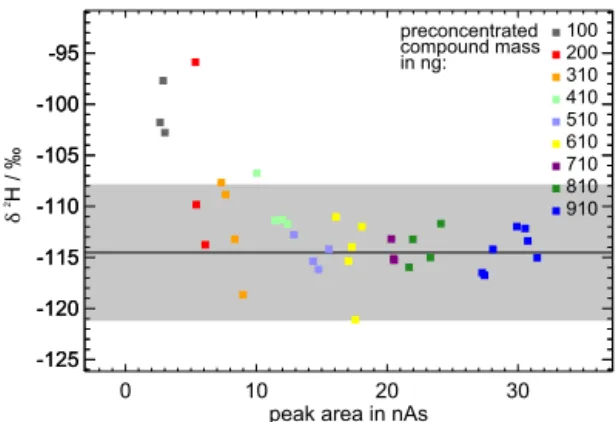
Figure 4.In order to estimate the required minimum mass of the substances to yield stable isotope ratios, the isotope ratios are plot-ted against the peak area (here using the example ofn-octane). Mean value and 3σinterval calculated by using values with stable isotope ratios (here above 8 nAs) are represented as black solid line and grey shaded area, respectively. The pre-concentrated mass ofn-octane is colour coded. Forn-octane the minimum required mass is estimated to 310 ng corresponding to about 50 ng hydrogen.
minimum peak area can be estimated. Using the example of n-octane this peak area is about 8 nAs (cf. Fig. 4). With lower peak areas, the calculated isotope ratios begin to ap-pear outside of the grey shaded area, which remarks the 3σ
interval of the mean value. This mean value and standard deviation is calculated using only values corresponding to peak areas larger than 8 nAs. Finally, the minimum mass of the substance to yield stable isotope ratios can be derived from the respective stage of dilution and mixing ratio in the VOC test mixture. In the case ofn-octane the minimum mass is about 310 ng. This procedure is done for every measured compound and the required minimum masses are given in Ta-ble 1. Furthermore, the minimum mass of hydrogen required to yield stable isotope ratios can be calculated resulting in about 50 ng hydrogen.
3.3 Influence of the pyrolysis system (ceramic tube) on theδ2H values
3.3.1 Carbon conditioning
During the pyrolysis of VOCs, 1H2 and1H2H are formed and elemental carbon is deposited on the inner surface of the pyrolysis tube. This carbon layer seems to be essential for an efficient production of1H2and1H2H. According to the recommendation of the manufacturer (Isoprime) the ce-ramic tube has to be carbon conditioned before the first use by flushing the tube with a light hydrocarbon in order to coat the inner surface with carbon. Following this first condition-ing step, this carbon layer resultcondition-ing from repeated measure-ments of VOCs, was said to be sufficient to sustain the condi-tioning of the pyrolysis tube. The first condicondi-tioning was per-formed using propane added to the sample line helium, but in contrast to the recommendation, the conditioning seems
-250 -200 -150 -100
δ
2H
/
‰
Figure 5.A step inδ2H values was apparent after 6 measurements, when the ceramic tube was conditioned for 5 min, after 10 measure-ments, when conditioned for 10 min, and after 20 measuremeasure-ments, when conditioned for 20 min. The measurements after conditioning for 5 min are represented by red dots, measurements after condition-ing for 10 min by blue triangles and measurements after 20 min by green squares. The grey bar shows the value obtained by elemental analysis (EA) (Agroisolab), where the thickness of the bar is equal to the uncertainty given by Agroisolab. This effect is observed for all measured substances and shown here forn-octane as an example.
Our observations are in contrast to the observations re-ported by Brass and Röckmann (2010), who state that an ex-tensive carbon conditioning may even have a negative effect on the formation of hydrogen molecules, and repeated mea-surements of VOCs are sufficient to condition the pyrolysis tube. The reason for this obviously different behaviour may be due to the different pyrolysis tubes used (silica vs. alu-minium oxide). In any case, these details should be subject of further investigations.
Brass and Röckmann (2010) also report on the influence of H2O on the pyrolysis of methane. Our results confirm this ob-servation. When measuring ambient air the step inδ2H val-ues is observed much earlier (after only four measurements, when conditioning for 20 min) most probably due to a higher amount of water entering the system and the ceramic tube. A possible process reducing the carbon layer is that oxygen atoms from water molecules react with the carbon to CO and CO2. Because H2O is also a source of protonation and can lead to an increase in H+3 formation, we therefore changed the chromatographic method to avoid that any H2O enters the pyrolysis oven. It turned out that the conditioning is sustained for many more measurements when applying this method.
Kornexl et al. (1999) reported on reactions of oxygen from the ceramic tube with sample compounds because of an oxygen self-diffusion in Al2O3. If these reactions affect the abundance of 1H2and1H2H, this could be an explana-tion of the observed variaexplana-tion inδ2H values when the carbon layer is degrading. Another source of oxygen, which is un-avoidable when analysing ambient VOCs, is the presence of oxygenated compounds. However, due to the low amount of these compounds, this effect may be of minor importance, but still has to be verified in the future.
In order to get an impression of the carbon layer, we in-spected the surface condition of parts of a used ceramic tube at different positions (outside and inside the heated area) us-ing a scannus-ing electron microscope (SEM). The part of the tube located outside of the hot area shows the typical struc-ture of a more or less clean Al2O3surface (cf. Fig. 6a). The part located inside the hot area shows a different texture in-dicating a carbon layer covering the Al2O3 surface. How-ever, also some of the carbon seems to have been deposited in soot-like structures which obviously do not cover the ceramic surface completely (cf. Fig. 6b). At present, we do not have a definite interpretation of the pictures. The pictures show, however, that the carbon layer is either not as uniform as ex-pected or changes dramatically during the use of the pyroly-sis tube.
3.3.2 Pyrolysis temperature
A further source for errors in the stable isotope ratios of hy-drogen in VOCs is the potential formation of methane during the pyrolysis process. Burgoyne and Hayes (1998) reported on the formation of methane as an intermediate product in the pyrolysis of VOCs depending on the pyrolysis temperature.
They investigated the methane formation during the pyroly-sis of propane and showed that formation of methane starts at a temperature of about 530 K, peaks at about 700 K and stops at temperatures above 1100 K. A methane production would directly affect the ratio of2H/1H and thus distort the stable isotope ratios of the investigated VOCs. Furthermore, methane is a source for protonation. Any methane getting in the ion source of the IRMS may lead to higher H3+ pro-duction, which again influences the calculated isotope ratios (Brand, 2004). Therefore, we determined the optimum tem-perature for the pyrolysis process to allow for a quantitative conversion of the hydrogen atoms of the VOCs to hydrogen molecules with a specific measurement series.
Because the recommended temperature for the pyrolysis process in the ceramic tube (Al2O3) is 1723 K, we performed measurements at pyrolysis temperatures of 1173, 1273, 1473 and 1723 K, respectively. Temperatures were not set to values higher than 1723 K to avoid operating the oven too close to its maximum temperature of 1773 K. In this measurement series 1H2and1H2H signals were measured andδ2H values were derived. In a second step the IRMS was tuned to the mass of CH4to measure the methane signal at the temperatures given above. The results are shown in Fig. 7 using a normalisation for better comparison. For each compound the peak areas at all temperatures are summarised to a total peak area. For each compound and each temperature the corresponding peak area is normalised to this total peak area. The grey (CH4) and blue (1H2) bars cover the range of results for all measured com-pounds including their standard deviations. As a specific ex-ample, the values ofn-octane are presented as black squares. The methane signal peaks in the temperature range between 1173 and 1273 K, whereas the1H2signal has a maximum in the temperature range between 1673 and 1723 K. Thus, our results are very similar to those obtained by Burgoyne and Hayes (1998). At 1723 K the methane signal was below the lower limit of detection. Below 1173 K no1H2is produced and thus no1H2signal is detectable. Furthermore, at a pyrol-ysis temperature of 1723 K theδ2H values of all compounds are very stable with the standard deviations presented above.
3.4 Influence of H+3 onδ2H values
Figure 6.Scanning electron microscope (SEM) pictures of the inner surface of a ceramic tube at two different positions.(a)shows a part located outside of the hot area, where the typical structure of Al2O3(ceramic) can be seen.(b)shows a part located inside the hot area (1723 K), where the ceramic is obviously partly covered with structures that might originate from carbon. Both pictures are taken with a magnification of 750.
1000 1150 1300 1450 1600 1750
pyrolysis temperature in K 0.1
0.2 0.3 0.4 0.5
relative peak area
Figure 7.1H2(blue bars) and CH4 (grey bars) signals measured with the IRMS are shown in relative units (see text for more de-tail) for different pyrolysis temperatures. The bars represent results for all measured compounds including standard deviations. As an example results ofn-octane are shown by black squares including standard deviation (error bars).
to the1H2H signal can be determined by comparing the in-crease in both signals with increasing pressure of the working reference gas. One of the basic requirements is that this factor is stable (variation of only 0.1). During the measurement se-ries reported here the determined H+3 factor ranged from 5.1 to 5.7 and thus was not as constant as expected. To analyse to what extent theδ2H values were affected by this variation when using CFDP, the same measurement series was anal-ysed using H+3 factors of 5.0, 5.3 and 5.8. As can be seen from Fig. 8,δ2H values change with larger H+3 factors, be-cause a larger factor means that a larger part of the mass 3 signal is assumed to originate from H+3 ions. Thus, the ratios of2H/1H become smaller and consequently theδ2H values change depending on the size and corrections of the working reference gas and sample signals (cf. Eq. 1). The use of the
-250 -200 -150 -100 -50 0
δ
2 H / ‰
n-Pentane Isoprene n-Heptane 4-Methyl- 2-pentanone
Toluene n-Octane
Ethylbenzene* m/p-Xylene* o-Xylene*
1,2,4-Trimethyl- benzene 9
9 9
8 9
9 9
9 9
9
9 9
9
8 9
9 9
9 9
9
9 9
9
8 9
9 9
9 9
9
Figure 8.The same measurement series was analysed 3 times us-ing H+3 factors of 5.0 (grey boxes), 5.3 (blue boxes) and 5.8 (green boxes). For comparison the results of EA (Agroisolab) are presented as red dots. The whisker plot is as in Fig. 3 (*not comparable to the results of Agroisolab); see text for more detail.
different H+3 factors results in differences in the mean δ2H values from 2 ‰ (n-octane) to 10 ‰ (m/p-xylene), which is slightly larger than the standard deviations presented above. Thus, this influence has to be taken into account when con-sidering uncertainties.
3.5 First test measurements of ambient air
days in February and March 2015 from outside the institute’s building through a PFA tube connected to the sample inlet of the TDSG-L. The university campus is located in the centre of Wuppertal and one of the major sources of VOCs is ob-viously vehicle exhaust. Focussing on the compounds con-tained in the VOC test mixture, the required peak areas in ambient air can be achieved with sample volumes of 200 L at least forn-pentane, toluene, ethylbenzene, ando- andm/p -xylene. Regarding the required peak areas, six measurements were selected and further analysed using the same method as for the characterisation measurements. The obtainedδ2H values range from−136 to−105 ‰ forn-pentane, from−86 to−63 ‰ for toluene, from−39 to−15 ‰ for ethylbenzene, from−99 to−68 ‰ form/p-xylene, and from−45 to−34 ‰ foro-xylene. It should be noted that theseδ2H values result from a sampling time of 145 min per measurement. As men-tioned before, to our knowledge the only other publishedδ2H values of atmospheric VOCs at ambient levels were reported by Kikuchi and Kawashima (2013). They measuredδ2H val-ues in benzene and toluene in roadside air ranging from
−174.4 to−74.9 ‰ and from−134.7 to−35.0 ‰, respec-tively. Compared to their results, ourδ2H values of toluene fit into the range given by Kikuchi and Kawashima (2013). The smaller range of our results may be attributed to different sources and production processes of the fuel used in Japan and Europe. We can further compare our results to the mea-surements of toluene, ethylbenzene,m-xylene, ando-xylene in car emissions by von Eckstaedt et al. (2011a). They mea-suredδ2H values of different VOCs in diesel and petrol car emissions. Their results for diesel car emissions are (−3±8), (−70±14), and (−49±12) ‰ for toluene,m-xylene, ando -xylene, respectively. The results for petrol car emissions are (−65±3), (−47±4), (−61±3) and (−48±4) ‰ for toluene, ethylbenzene,m-xylene ando-xylene, respectively. Ourδ2H values of toluene (−86 to −63 ‰), ethylbenzene (−39 to
−15 ‰) and the xylenes (−99 to−68 ‰ form/p-xylene and
−45 to−34 ‰ foro-xylene) are comparable to the results of this source study, confirming that emissions from vehicle exhaust dominated the composition of our samples. In sum-mary, our first measurements demonstrate the suitability of our instrumental set-up for the measurements ofδ2H values of VOCs at ambient conditions.
4 Summary and outlook
We set up and successfully characterised a new measurement system consisting of a GC-P-IRMS and a pre-concentration system to measure 2H/1H ratios in atmospheric VOCs at ambient levels. Using a test mixture the system was char-acterised concerning reproducibility and linearity. The ob-tained standard deviations calculated from 18 individual measurements are<9 ‰ inδ2H values forn-pentane, 1,2,4-trimethylbenzene, 4-methyl-2-pentanone, ethylbenzene and isoprene and even≤2.5 ‰ forn-heptane, toluene,n-octane
andm/p-xylene. Thus, this system is suitable to identify am-bient hydrogen isotopic effects. In addition, a comparison with results obtained by elemental analysis of the pure com-pounds shows a good agreement within our standard devi-ations forn-pentane, toluene, 4-methyl-2-pentanone andn -octane. Moreover, linearity experiments showed that repro-ducible measurements ofδ2H values are possible with a pre-concentrated mass of about 50 ng hydrogen per substance. Furthermore, a pyrolysis temperature of 1723 K was found to be suitable regarding sufficient1H2and1H2H production as well as prevention of methane production which would affect the measuredδ2H values. The characterisation mea-surements showed a considerable influence of the pyrolysis process onδ2H values. The ceramic tube (Al2O3) used for the pyrolysis process has to be regularly re-conditioned with a light hydrocarbon after a certain number of measurements to sustain a carbon layer on the inner surface of the tube. Otherwise considerable fluctuations inδ2H values occur. It is therefore necessary to verify the conditioning regularly with a test mixture when measuring unknown air samples. Con-sidering this effect, first test measurements of ambient air were performed demonstrating the applicability of the sys-tem when using Tenax®TA for VOC adsorption in the ther-mal desorption system of the pre-concentration unit. With sample volumes of 200 L, which in this case were necessary to provide enough mass of hydrogen in order to meet the re-quired detection limits, the measuredδ2H values range from
−136 to −105 ‰ for n-pentane, from −86 to−63 ‰ for toluene, from−39 to−15 ‰ for ethylbenzene, from−99 to
−68 ‰ form/p-xylene and from−45 to−34 ‰ foro-xylene. For prospective interpretation of ambient air measure-ments hydrogen kinetic isotope effects as well as model cal-culations concerning hydrogen isotope ratios are necessary. With a combination of stable hydrogen and stable carbon iso-tope ratios of atmospheric VOCs it may then be possible to reduce uncertainties in stable isotope studies of atmospheric VOCs.
Acknowledgements. Part of this work was funded by the German Sciences Foundation (DFG) under grant number KO 2340/4-1. We thank R. Kurtenbach and M. Gallus (chemistry department, atmospheric chemistry group, University of Wuppertal) for their help to prepare our VOC test mixture and for the mea-surements of the mixing ratios in this gas mixture. We further thank D. Lützenkirchen-Hecht (physics department, condensed matter group, University of Wuppertal) for his assistance to take SEM pictures of the ceramic tube. We thank Agroisolab, Jülich, Germany, for their measurements ofδ2H values in the VOCs by elemental analysis.
References
Archbold, M. E., Redeker, K. R., Davis, S., Elliot, T., and Kalin, R. M.: A method for carbon stable isotope analysis of methyl halides and chlorofluorocarbons at pptv concentrations, Rapid Commun. Mass Sp., 19, 337–342, doi:10.1002/rcm.1791, 2005. Bi, X., Sheng, G., Liu, X., Li, C., and Fu, J.:
Molecu-lar and carbon and hydrogen isotopic composition of n-alkanes in plant leaf waxes, Org. Geochem., 36, 1405–1417, doi:10.1016/j.orggeochem.2005.06.001, 2005.
Brand, W. A.: Mass spectrometer hardware for analyzing stable isotope ratios, in: Handbook of Stable Isotope Analytical Tech-niques, edited by: Groot, P. A. D., Elsevier, Amsterdam, chap. 38, 835–856, doi:10.1016/B978-044451114-0/50040-5, 2004. Brass, M. and Röckmann, T.: Continuous-flow isotope ratio mass
spectrometry method for carbon and hydrogen isotope measure-ments on atmospheric methane, Atmos. Meas. Tech., 3, 1707– 1721, doi:10.5194/amt-3-1707-2010, 2010.
Brenninkmeijer, C. A. M., Janssen, C., Kaiser, J., Röckmann, T., Rhee, T. S., and Assonov, S. S.: Isotope effects in the chemistry of atmospheric trace compounds, Chem. Rev., 103, 5125–5162, doi:10.1021/cr020644k, 2003.
Burgoyne, T. W. and Hayes, J. M.: Quantitative production of H2 by pyrolysis of gas chromatographic effluents, Anal. Chem., 70, 5136–5141, doi:10.1021/ac980248v, 1998.
De Biévre, P., Gallet, M., Holden, N. E., and Barnes, I. L.: Isotopic abundances and atomic weights of the elements, J. Phys. Chem. Ref. Data, 13, 809–891, doi:10.1063/1.555720, 1984.
De Bortoli, M., Knöppel, H., Pecchio, E., Schauenburg, H., and Vissers, H.: Comparison of tenax and carbotrap for VOC sam-pling in indoor air, Indoor Air, 2, 216–224, doi:10.1111/j.1600-0668.1992.00004.x, 1992.
Duan, Y., Wu, B., Xu, L., He, J., and Sun, T.: Characterisation of n-alkanes and their hydrogen isotopic composition in sedi-ments from Lake Qinghai, China, Org. Geochem., 42, 720–726, doi:10.1016/j.orggeochem.2011.06.009, 2011.
Gensch, I., Kiendler-Scharr, A., and Rudolph, J.: Isotope ratio stud-ies of atmospheric organic compounds: principles, methods, ap-plications and potential, Int. J. Mass Spectrom., 365–366, 206– 221, doi:10.1016/j.ijms.2014.02.004, 2014.
Goldstein, A. H. and Shaw, S. L.: Isotopes of volatile or-ganic compounds: an emerging approach for studying atmo-spheric budgets and chemistry, Chem. Rev., 103, 5025–5048, doi:10.1021/cr0206566, 2003.
Greule, M., Huber, S. G., and Keppler, F.: Stable hydrogen-isotope analysis of methyl chloride emitted from heated halophytic plants, Atmos. Environ., 62, 584–592, doi:10.1016/j.atmosenv.2012.09.007, 2012
Helmig, D. and Vierling, L.: Water adsorption capacity of the solid adsorbents Tenax TA, Tenax GR, Carbotrap, Carbotrap C, Car-bosieve SIII, and Carboxen 569 and water management tech-niques for the atmospheric sampling of volatile organic trace gases, Anal. Chem., 67, 4380–4386, doi:10.1021/ac00119a029, 1995.
Hembeck, L.: Aufbau und Charakterisierung eines dynamischen Gasmischsystems zur Kalibrierung eines Gaschromatograph-Isotopenverhältnis-Massenspektrometers (GC-IRMS), Bachelor Thesis, University of Wuppertal, Wuppertal, Germany, 49 pp., 2008.
Iannone, R., Anderson, R., Vogel, A., Rudolph, J., Eby, P., and Whiticar, M.: Laboratory studies of the hydrogen Kinetic Isotope Effects (KIES) of the reaction of non-methane hydrocarbons with the OH radical in the gas phase, J. Atmos. Chem., 47, 191–208, doi:10.1023/B:JOCH.0000021035.49613.f7, 2004.
Iannone, R., Anderson, R., Vogel, A., Eby, P., Whiticar, M., and Rudolph, J.: The hydrogen kinetic isotope effects of the reac-tions of n-alkanes with chlorine atoms in the gas phase, J. Atmos. Chem., 50, 121–138, doi:10.1007/s10874-005-2365-1, 2005. Iannone, R., Koppmann, R., and Rudolph, J.: A technique for
at-mospheric measurements of stable carbon isotope ratios of iso-prene, methacrolein, and methyl vinyl ketone, J. Atmos. Chem., 58, 181–202, doi:10.1007/s10874-007-9087-5, 2007.
Kikuchi, N. and Kawashima, H.: Hydrogen isotope analysis of ben-zene and toluene emitted from vehicles, Atmos. Environ., 72, 151–158, doi:10.1016/j.atmosenv.2013.02.029, 2013.
Kornexl, B. E., Gehre, M., Höfling, R., and Werner, R. A.: On-line
δ18O measurement of organic and inorganic substances, Rapid Commun. Mass Sp., 13, 1685–1693, doi:10.1002/(SICI)1097-0231(19990830)13:16<1685::AID-RCM699>3.0.CO;2-9, 1999. Liu, J., Geng, A., and Xiong, Y.: The application of stable carbon and hydrogen isotopic compositions of individual n-alkanes to Paleozoic oil/source rock correlation enigmas in the Huanghua depression, China, J. Petrol. Sci. Eng., 54, 70–78, doi:10.1016/j.petrol.2006.07.003, 2006.
Redeker, K. R., Davis, S., and Kalin, R. M.: Isotope values of atmo-spheric halocarbons and hydrocarbons from Irish urban, rural, and marine locations, J. Geophys. Res.-Atmos., 112, D16307, doi:10.1029/2006JD007784, 2007.
Rice, A. L. and Quay, P.: Isotopic composition of formalde-hyde in urban air, Environ. Sci. Technol., 43, 8752–8758, doi:10.1021/es9010916, 2009.
Rudolph, J.: Gas chromatography-isotope ratio mass spectrometry, in: Volatile Organic Compounds in the Atmosphere, edited by: Koppmann, R., chap. 10, Blackwell Publishing Ltd, Oxford, UK, 388–466, ISBN:978-1-4051-3115-5, 2007.
Rudolph, J., Müller, K., and Koppmann, R.: Sampling of or-ganic volatiles in the atmosphere at moderate and low pollu-tion levels, Anal. Chim. Acta, 236, 197–211, doi:10.1016/S0003-2670(00)83313-9, 1990.
Rudolph, J., Lowe, D. C., Martin, R. J., and Clarkson, T. S.: A novel method for compound specific determination ofδ13C in volatile organic compounds at ppt levels in ambient air, Geophys. Res. Lett., 24, 659–662, doi:10.1029/97GL00537, 1997.
Rudolph, J., Czuba, E., Norman, A., Huang, L., and Ernst, D.: Sta-ble carbon isotope composition of nonmethane hydrocarbons in emissions from transportation related sources and atmospheric observations in an urban atmosphere, Atmos. Environ., 36, 1173– 1181, doi:10.1016/S1352-2310(01)00537-4, 2002.
Rudolph, J., Anderson, R., Czapiewski, K., Czuba, E., Ernst, D., Gillespie, T., Huang, L., Rigby, C., and Thompson, A.: The sta-ble carbon isotope ratio of biogenic emissions of isoprene and the potential use of stable isotope ratio measurements to study pho-tochemical processing of isoprene in the atmosphere, J. Atmos. Chem., 44, 39–55, doi:10.1023/A:1022116304550, 2003. Saito, T., Tsunogai, U., Kawamura, K., Nakatsuka, T., and
photochemical ages, J. Geophys. Res.-Atmos., 107, ACH 2–1– ACH 2–9, doi:10.1029/2000JD000127, 2002.
Saito, T., Kawamura, K., Tsunogai, U., Chen, T.-Y., Mat-sueda, H., Nakatsuka, T., Gamo, T., Uematsu, M., and Hue-bert, B. J.: Photochemical histories of nonmethane hydrocar-bons inferred from their stable carbon isotope ratio measure-ments over east Asia, J. Geophys. Res.-Atmos., 114, D11303, doi:10.1029/2008JD011388, 2009.
Sessions, A. L., Burgoyne, T. W., and Hayes, J. M.: Determination of the H3factor in hydrogen isotope ratio monitoring mass spec-trometry, Anal. Chem., 73, 200–207, doi:10.1021/ac000488m, 2001a.
Sessions, A. L., Burgoyne, T. W., and Hayes, J. M.: Cor-rection of H+3 contributions in hydrogen isotope ratio monitoring mass spectrometry, Anal. Chem., 73, 192–199, doi:10.1021/ac000489e, 2001b.
Thompson, A. E.: Stable Carbon Isotope Ratios of Nonmethane Hydrocarbons and Halocarbons in the Atmosphere, PhD thesis, York University Toronto, Toronto, Ontario, 299 pp., 2003. Tsunogai, U., Yoshida, N., and Gamo, T.: Carbon isotopic
com-positions of C2-C5 hydrocarbons and methyl chloride in ur-ban, coastal, and maritime atmospheres over the western North Pacific, J. Geophys. Res.-Atmos., 104, 16033–16039, doi:10.1029/1999JD900217, 1999.
von Eckstaedt, C. V., Grice, K., Ioppolo-Armanios, M., Chid-low, G., and Jones, M.:δD andδ13C analyses of atmospheric volatile organic compounds by thermal desorption gas chro-matography isotope ratio mass spectrometry, J. Chromatogr. A, 1218, 6511–6517, doi:10.1016/j.chroma.2011.06.098, 2011a. von Eckstaedt, C. V., Grice, K., Ioppolo-Armanios, M., and
Jones, M.:δ13C andδD of volatile organic compounds in an alu-mina industry stack emission, Atmos. Environ., 45, 5477–5483, doi:10.1016/j.atmosenv.2011.06.064, 2011b.
Wintel, J., Hösen, E., Koppmann, R., Krebsbach, M., Hofzumahaus, A., and Rohrer, F.: Stable carbon isotope ratios of toluene in the boundary layer and the lower free troposphere, Atmos. Chem. Phys., 13, 11059–11071, doi:10.5194/acp-13-11059-2013, 2013. Xiong, Y., Geng, A., Pan, C., Liu, D., and Peng, P.: Character-ization of the hydrogen isotopic composition of individual n-alkanes in terrestrial source rocks, Appl. Geochem., 20, 455–464, doi:10.1016/j.apgeochem.2004.09.014, 2005.
Yamamoto, S. and Kawamura, K.: Compound-specific stable car-bon and hydrogen isotopic compositions of n-alkanes in urban atmospheric aerosols from Tokyo, Geochem. J., 44, 419–430, 2010.