www.nat-hazards-earth-syst-sci.net/13/65/2013/ doi:10.5194/nhess-13-65-2013
© Author(s) 2013. CC Attribution 3.0 License.
and Earth
System Sciences
The modification of the typhoon rainfall climatology model
in Taiwan
C.-S. Lee1,2, L.-R. Huang1,2, and D. Y.-C. Chen1
1Taiwan Typhoon and Flood Research Institute, National Applied Research Laboratories, Taiwan 2Department of Atmospheric Sciences, National Taiwan University, Taipei, Taiwan
Correspondence to:D. Y.-C. Chen ([email protected])
Received: 30 March 2012 – Revised: 14 November 2012 – Accepted: 27 November 2012 – Published: 18 January 2013
Abstract.This study is focused on the modification of a ty-phoon rainfall climatological model, by using the dataset up to 2006 and including data collected from rain gauge sta-tions established after the 921 earthquake (1999). Subse-quently, the climatology rainfall models for westward- and northward-moving typhoons are established by using the ty-phoon track classification from the Central Weather Bureau. These models are also evaluated and examined using depen-dent cases collected between 1989 and 2006 and independepen-dent cases collected from 2007 to 2011. For the dependent cases, the average total rainfall at all rain gauge stations forecasted using the climatology rainfall models for westward- (W-TRCM12) and northward-moving (N-(W-TRCM12) typhoons is superior to that obtained using the original climatologi-cal model (TRCM06). Model W-TRCM12 significantly im-proves the precipitation underestimation of model TRCM06. The independent cases show that model W-TRCM12 pro-vides better accumulated rainfall forecasts and distributions than model TRCM06. A climatological model for accom-panied northeastern monsoons (A-TRCM12) for special ty-phoon types has also been established. The current A-TRCM12 model only contains five historical cases and var-ious typhoon combinations can cause precipitation in differ-ent regions. Therefore, precipitation is likely to be signifi-cantly overestimated and high false alarm ratios are likely to occur in specific regions. For example, model A-TRCM12 significantly overestimates the rainfall forecast for Typhoon Mitag, an independent case from 2007. However, it has a higher probability of detection than model TRCM06. From a disaster prevention perspective, a high probability of detec-tion is much more important than a high false alarm ratio. The modified models can contribute significantly to opera-tional forecast.
1 Introduction
The island of Taiwan is situated on one of the main west-ern North Pacific typhoon paths. Significant changes often occur to typhoon structures as they cross the island. One of the biggest challenges to numerical weather prediction is quantitative precipitation forecasting (QPF), especially the forecasting of orographically induced heavy precipitation. Taiwan has recently experienced increasingly damaging ty-phoons (Emanuel, 2005; Liu et al., 2009). To reduce damage from typhoons, torrential rain, and floods, appropriate meth-ods must be adopted in addition to currently available engi-neering solutions. Thus, QPF is important for non-structural damage mitigation methods. From a disaster reduction per-spective, the threat of severe rainfall over a short period is the same as that of continuous rainfall. Taiwan is a small is-land approximately 140 km wide and 394 km long. The aver-age elevation of the Central Mountain Range (CMR) exceeds 2000 m (Yushan Main Peak is 3952 m). The CMR reduces the intensity of direct typhoon damage and creates favorable conditions for the orographic lifting mechanism (Chiao and Lin, 2003). This mountainous terrain provides an extremely strong terrain-blocking effect.
Acronym Model description
TRCM06 Taiwan Typhoon Rainfall Climatology Model; Lee et al. (2006) W-TRCM12 The modified model for the westward moving typhoons N-TRCM12 The modified model for the northward moving typhoons
A-TRCM12 The modified model for the typhoon accompanied with the northeasterly monsoon
accuracy varies, significantly reducing the value of the mod-els for real-time applications.
The tools used to provide 0- to 24-h QPF include numer-ical model, climatology rainfall model, and the persistence method. Because of the time delay for model simulation, nu-merical products for real-time forecasts are only available for 9- to 24-h forecasts, whereas climatology rainfall model can provide rainfall predictions at short lead times and require fewer computations. Based on the assumption that rainfall is highly related to typhoon central position, climatology rain-fall model can be developed using historical typhoon track and observation rainfall data (Chang et al., 1993).
For the previous climatological model, Lee et al. (2006) (acronym as TRCM06, Table 1) used typhoon track data from 1989 to 2002 obtained from the Central Weather Bureau (CWB) and hourly precipitation data collected from 371 rain gauge stations. Lee et al. (2006) used this data to calcu-late the mean, maximum, and standard deviation of hourly precipitation, how frequently hourly precipitation exceeded 15 mm and 50 mm, and how often a typhoon passed each of the 0.5×0.5◦ grids between 118–126◦E and 19–27◦N of the 61 typhoons that hit Taiwan over the years. Using Barnes objective analysis, average precipitation data were interpo-lated into 0.1×0.1◦ grids to obtain a set of grid data with spatially uniform distributions for forecasting typhoon rain-falls. Basic assumptions were that the rainfall in a given area was affected by the distance from that area to the center of typhoon and by the direction of the typhoon (Chang et al., 1993). Therefore, combined with hourly precipitation data from a specific station, historical typhoon paths data can be used to create typhoon precipitation distribution maps for that station. For applications, the predicted path of a typhoon is adopted with the rainfall distribution map acquired from a specific station to provide a QPF for that station during a typhoon landfall. The climatological model captures rainfall enhancement details associated with the complex terrain.
Lee et al. (2006) and Cheung et al. (2008) evaluated TRCM06. Their results showed that the model captures rain-fall patterns during a typhoon period, but often underesti-mates rainfall amount, which is an essential feature of the climatology model. The development of the TRCM06 was based on all the typhoon cases available in the database. Thus, the unique rainfall patterns associated with westward and northward moving storms were mixed, resulting in less than ideal rainfall statistics; the rainfall amount was therefore
underestimated. To modify the model, this study divides the climatology model results according to typhoon tracks (west-ward or north(west-ward moving track) or environment (accompa-nied by a northeasterly monsoon). This study uses the same model setup as Lee et al. (2006) and Cheung et al. (2008), but uses more recent data (updated to 2006).
This paper is organized as follows: Sect. 2 explains the data quality control process; Sect. 3 describes the develop-ment of the typhoon rainfall climatology model; Sect. 4 dis-cusses the results; and Sect. 5 presents a summary of the study.
2 Data
Typhoon track and rain gauge data are used to develop the model. The position of each typhoon at 3-h intervals is ob-tained from official reports of the CWB of Taiwan. The Akima interpolation scheme is used to interpolate the 3-h track data to obtain the hourly positions. Based on previous studies (Lee et al., 2006), the rain gauge data is updated to 2006 and new rain gauge stations are included (408 stations in total). The number of historical typhoon cases in the de-velopmental database increased to 92.
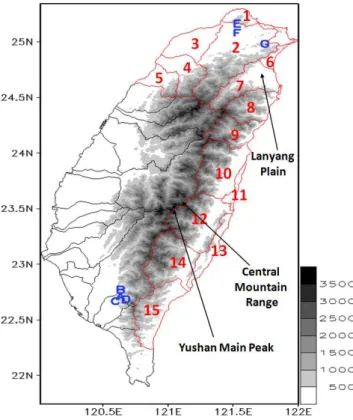
Fig. 1.Topography (m, gray shading), river basins (region in black with red line) and the stations (A–G). The basins selected for the accompanied climatological rainfall model are (1) river basins of the northern coast, (2) Danshui River basin, (3) river basins along the Taoyuan coast, (4) Toucian River basin, (5) river basins along the Zhunan coast, (6) river basins along the Toucheng coast, (7) Lanyang river basin, (8) river basins along the Nanao coast, (9) river basins around Taroko, (10) Hualien river basin, (11) river basins along the Fengbin coast, (12) Siouguluan river basin, (13) river basins of east of the coastal mountains, (14) Beinan river basin and (15) river basins of the southern Taitung river. The stations are (A) Sandimen (C0R15), (B) Guxia (C1R11), (C) LongCyuan (C1R20), (D) Majia (C1R14), (E) Zhuzihu (01A42), (F) Wudu (01B03), (G) Huoshaoliao.
This section describes an actual quality control process. When Typhoon Haitang hit Taiwan in 2005, the automatic rain gauge station (C0R15) in Sandimen (Fig. 1 Station A) recorded eight instances of missing data records within 12 h from 23:00 LST, 18 July. The observed hourly precipitations were 124.0 mm, 17.5 mm, and 113.5 mm at 04:00, 07:00 and 09:00 on 19 July, respectively. The original data indi-cated that the precipitation record at 04:00 on 19 July re-flected precipitation which had accumulated over 6 h (trans-mission of the five previous hourly precipitation values had failed) and precipitation records at 07:00 and 09:00 re-flected precipitation which had accumulated over 3 h and 2 h, respectively. Therefore, data collected from nearby sta-tions with similar terrain features are used for weighting to reconstruct data through interpolation. Time-dependent
Fig. 2. Rainfall data collected by the Sandimen (C0R15), Guxia (C1R11), Long-Cyuan (C1R20), and Majia (C1R14) stations be-tween 23:00 LST, 18 July and 09:00 LST, 19 July.
precipitation data (Fig. 2) were collected from three stations near Sandimen station: Guxia (C1R11, Station B in Fig. 1), Long-Cyuan (C1R20, Station C), and Majia (C1R14, Station D). The results indicate that Guxia and Long-Cyuan stations had similar precipitation distributions during the same time intervals, but Majia station recorded heavier precipitation, which was probably caused by topographical factors. Data collected at the Guxia station are selected as the weighting standard because it has a geographical environment similar to that of Sandimen. Figure 2 shows the precipitation back-stepping results.
3 Methodology
3.1 Model description
This study used a model domain between 19–27◦N, 118– 126◦E with 0.5×0.5◦grid. Typhoon track data are catego-rized into each grid box. Therefore, for a given rain gauge station, the average value, maximum value, and standard de-viation of rainfall data for a typhoon passing over a certain grid box can be calculated. The interpolation scheme devel-oped by Barnes (1973) (radius of influence: 200 km and con-vergence parameter: 0.3) is used to increase the grid reso-lution from 0.5×0.5◦to 0.1×0.1◦(approximately 11 km). Thus, a rainfall climatology map is obtained for each rain gauge station. In real-time applications, the forecast track (official data issued by the CWB) is interpolated into hourly positions. The hourly rainfall data for each station are ob-tained from the rainfall climatology map. Rainfall data along the forecast track are accumulated to calculate 3-h, 6-h, or daily rainfall.
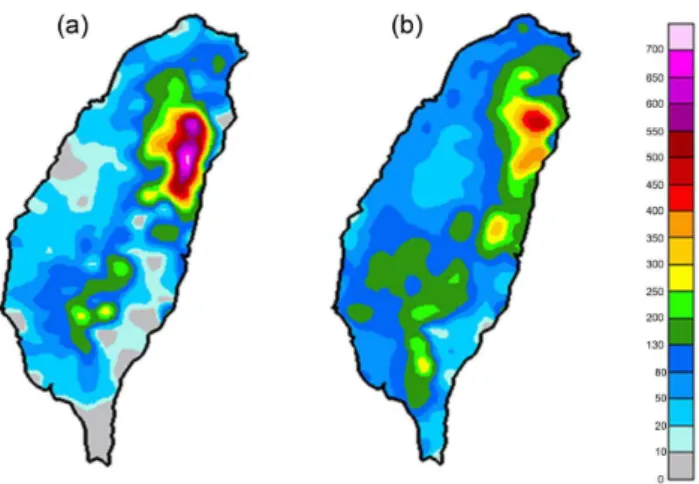
Fig. 3.The accumulated rainfall for Typhoon Longwang: (a) ob-served (05:30 LST, 1 October–08:30 LST, 3 October); and(b)the rainfall distribution estimated using TRCM06.
distribution of observed rainfall (Fig. 3a) and the rainfall es-timated using TRCM06 (Fig. 3b) during the land warning pe-riod for Typhoon Longwang. As shown in Fig. 3, TRCM06 estimates the general northeastern and southern mountain-ous locations where heavy rainfall may occur, however, mi-nor differences exist between local regional precipitation and distribution. Model TRCM06 cannot provide estimations on special typhoon types, such as typhoons accompanied by northeastern monsoons or southwestern monsoons. There-fore, climatological models for special typhoon types, con-ceptual models that use advanced observation techniques (e.g. satellite and radar) and dynamic simulation must be es-tablished to improve model application.
All typhoon cases are classified according to their move-ment direction and climatological rainfall models are es-tablished for westward- and northward-moving typhoons. Westward- and northward-moving typhoons are defined ac-cording to the typhoon tracks classification published by the CWB. Based on these definitions, 35 of the 92 ty-phoons that hit Taiwan between 1989 and 2006 are classi-fied as westward-moving typhoons and 34 are classiclassi-fied as northward-moving typhoons. The selected typhoons are used to establish climatological rainfall models for westward- (W-TRCM12) and northward-moving (N-(W-TRCM12) typhoons. A special climatological rainfall model is also developed for accompanied cases that interact with the environment (A-TRCM12). Previous studies (Chu and Chen, 1988; Chou et al., 2001; Lee et al., 2007; Wu et al., 2009) have shown that typhoons accompanied by northeastern monsoons are likely to cause more rainfall in northern and eastern Taiwan. Dur-ing autumn or early winter, the typhoon outer core circu-lation interacts with the monsoonal northeasterlies and cre-ates a frontal-type system. Because of the terrain blocking effect, the accompanied system brings enormous rainfall to certain areas in northern or eastern Taiwan. These typhoon
area. Results show that from 1987 to 2011, eight typhoons (their centers are located in the selected domain) interacted significantly with the northeastern monsoon. A typical ex-ample of this scenario is Typhoon Lynn (Lee et al., 2007). Typhoon Lynn moved westward and turned northwestward, when the typhoon passed through northern Luzon Island; a cold front also occurred in northern Taiwan. Lee et al. (2007) analyzed the rainfall accompanying these types of typhoons and found that in addition to the accompanied effects of ty-phoon circulation and northeastern monsoons, the terrain-lifting effect still produced huge rainfall. For example, con-sidering Typhoon Zeb, which brought heavy rain to northern Taiwan in 1998, in addition to the mid-latitude trough, some of the rainfall could have been caused by the typhoon circu-lation; terrain also played a crucial role in the heavy rainfall (Chou et al., 2001). The accompanied effects of the interac-tion between outer-core circulainterac-tions and large-scale flow can also cause heavy rain, even if the typhoon center is located far from northern Taiwan (a distance of greater than approxi-mately 400–500 km) (Lee et al., 2007). Chu and Chen (1988) analyzed the precipitation features of six typhoons accompa-nied by northeastern monsoons and found that these types of typhoons are likely to form three major rainfall centers in northern Taiwan: the Datun mountainous areas (Zhuzihu, Station E in Fig. 1); the area between Wudu (Station F) and Huoshaoliao (Station G); and the western mountainous areas of the Lanyang Plain. According to Wang (1970), rainfall dis-tributions caused by these types of typhoons are different, be-cause of various high-pressure locations and typhoon paths.
Therefore, a rainfall database is created for northern and eastern Taiwan (river basin indicated by the red line in Fig. 1) by considering the rainfall characteristics of typhoons ac-companied by northeastern monsoons. Data from all the ty-phoons that hit Taiwan between 1989 and 2006 are still used for other basins. The available historical data (1989 to 2006) include five typhoons accompanied by northeastern mon-soons. These five cases are selected to establish a climato-logical rainfall model for typhoons accompanied by north-eastern monsoons (A-TRCM12).
Table 2.The typhoon list for the independent cases.
Westward moving typhoons 2007 Pabuk, 2007 Wutip, 2007 Sepat, 2007 Wipha, 2007 Krosa, 2008 Kalmaegi, 2008 Fung-wong, 2008 Sinlaku, 2008 Jangmi, 2009 Morakot,
2010 Namtheun, 2010 Fanapi, 2011 Nanmadol Northward moving typhoons 2010 Lionrock, 2010 Meranti, 2010 Megi The typhoon accompanied with
the northeasterly monsoon
2007 Mitag, 2009 Parma, 2010 Megi
Megi 2010
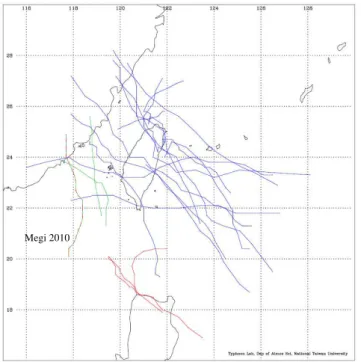
Fig. 4.The track for the independent cases. Blue lines: westward moving typhoon; green lines: northward moving typhoon; and red lines: the typhoon accompanied with the northeasterly monsoon.
3.2 Verification method
This study conducts a contingency table analysis to calcu-late rainfall forecast accuracy in order to evaluate the mod-ified climatological rainfall models. The four combinations of forecasts (above or below the threshold) and observations (above or below the threshold), called joint distributions, are:
hit: event forecast to occur and did occur, meaning that the forecasted rainfall at a given station is greater than the thresh-old value, and the observed rainfall at that station is also greater than the threshold value;miss: event forecast not to occur, but did occur; false alarm: event forecast to occur, but did not occur; and correct negative: event forecast not to occur, and did not occur. The rainfall rate definition es-tablished by the CWB is used to set the thresholds as fol-lows:heavy rain: 24-h accumulated rainfall exceeds 50 mm with at least 1 h of 15 mm or above; extremely heavy rain: 24-h accumulated rainfall exceeds 130 mm;torrential rain:
24-h accumulated rainfall exceeds 200 mm; and extremely torrential rain: 24-h accumulated rainfall exceeds 350 mm. The forecasted rainfalls are examined based on the contin-gency table by calculating five evaluation indices: the bias score (BS), probability of detection (POD), false alarm ra-tio (FAR), threat score (TS) and equitable threat score (ETS).
Bias=hits+false alarms
hits+misses (1)
POD= hits
hits+misses (2)
FAR= false alarms
hits+false alarms (3)
TS= hits
hits+misses+false alarms (4) ETS= hits−hitsrandom
hits+misses+false alarms−hitsrandom,where
hitsrandom=(hits+misses) (hits+false alarms)
total (5)
These analyses enable understanding of the typhoon rain-fall forecasting performance of the climatological models at different rainfall thresholds.
Statistical parameters are also calculated to validate these models. The following statistical parameters are calculated (assuming that observed rainfall isOi, forecasted rainfall is Fi, and the number of data points isN):
– Average Rainfall Rate: average rainfall rate for the ob-served and predicted rainfall at all rainfall gauge sta-tions.
¯
O=
N
P
i=1
Oi
N ,
¯
F =
N
P
i=1
Fi
N (6)
– Maximum Rainfall Rate: observed and predicted maxi-mum rainfall.
– Mean Absolute Error
MAE= 1
N N
X
i=1
RMSE=
v u u t1
N N
X
i=1
(Fi−Oi)2 (8)
– Correlation Coefficient
r=
P F−F
O−O q
P
F−F2
q P
O−O2
(9)
The average and maximum rainfall rates mainly reflect the differences between the overall observed and forecasted rain-fall values. The mean absolute error, root mean square error, and correlation coefficient mainly reflect the differences be-tween the observed and forecasted rainfall distributions.
4 Results
4.1 Westward- and northward-moving typhoons
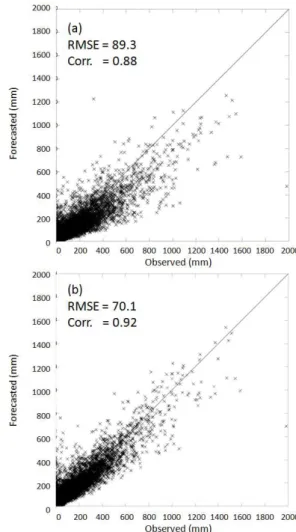
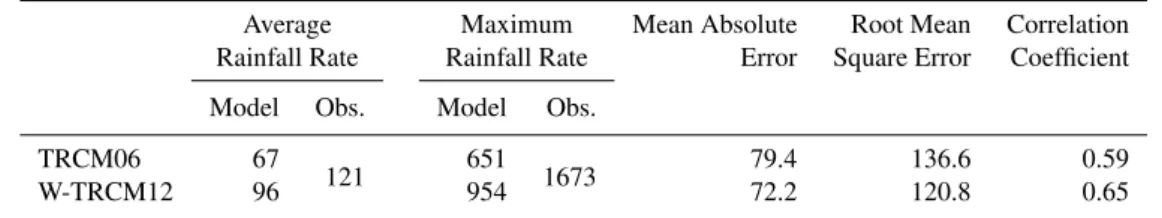
Figure 5 shows the forecasted rainfall accumulation (y-axis) compared to the observed rainfall accumulation (x-axis) for all dependent case rain gauge stations using mod-els TRCM06 and W-TRCM12. The validation results for ac-cumulated rainfall indicate that the correlation coefficients of the forecasted and observed rainfall values for each sta-tion are 0.88 for TRCM06 and 0.92 for W-TRCM12. Us-ing W-TRCM12 significantly reduces rainfall underestima-tion. Independent cases are also validated. Table 3 shows the validation results for various statistical parameters for rain gauge stations. Regarding average and maximum rain-fall rates, W-TRCM12 is better than TRCM06 at estimating rainfall amount and at identifying rainfall distribution (the mean absolute error and correlation coefficient).
Table 4 shows the results of the forecasted precipitation scores with different threshold values for all rain gauge sta-tions using contingency table analysis. Forecasts made us-ing TRCM06 rapidly change from a slight underestimation (BS=0.84; threshold value=50 mm) to a severe underesti-mation (BS=0.07; threshold value=350 mm) as the thresh-old value increases. By comparison, forecasts made using W-TRCM12 change from a slight overestimation (BS=1.01; threshold value=50 mm) to an underestimation (BS=0.36; threshold value=350 mm). Regardless of threshold values, W-TRCM12 is better at POD than TRCM06. However, the FAR of W-TRCM12 is slightly greater than that of TRCM06. Model W-TRCM12 has a better TS and ETS than model TRCM06, particularly when the rainfall threshold is higher than 200 mm in 24-h. Therefore, the model performance validation results show that W-TRCM12 performs better than TRCM06 as the rainfall threshold increases. However, when the rainfall threshold increases to 350 mm in 24-h, both models perform poorly. The validation results using the
Fig. 5.The forecasted (y-axis) and observed (x-axis) rainfall ac-cumulations of the dependent westward-moving typhoons (from 1989 to 2006) for all rain gauge stations:(a)TRCM06; and(b) W-TRCM12.
independent cases show that W-TRCM12 performs better with heavier rains. However, this model also has a higher FAR than TRCM06.
Table 3.Validation results for the statistical parameters of independent westward-moving typhoons that hit Taiwan in 2007–2011.
Average Maximum Mean Absolute Root Mean Correlation Rainfall Rate Rainfall Rate Error Square Error Coefficient
Model Obs. Model Obs.
TRCM06 67
121 651 1673 79.4 136.6 0.59 W-TRCM12 96 954 72.2 120.8 0.65
Table 4.Validation results for the statistical parameters of indepen-dent westward-moving typhoons that hit Taiwan in 2007–2011 us-ing contus-ingency table analysis.
Criteria (mm day−1)
Score Models 50 130 200 350
BS TRCM06 0.84 0.51 0.30 0.07 W-TRCM12 1.01 0.85 0.69 0.36
POD TRCM06 0.67 0.39 0.22 0.04 W-TRCM12 0.80 0.60 0.44 0.21
FAR TRCM06 0.19 0.24 0.28 0.38 W-TRCM12 0.20 0.29 0.36 0.42
TS TRCM06 0.58 0.34 0.20 0.04 W-TRCM12 0.67 0.48 0.35 0.18
ETS TRCM06 0.31 0.23 0.15 0.04 W-TRCM12 0.38 0.33 0.27 0.16
Typhoon Meranti was generated in the ocean east of Taiwan and then moved southwestward, south of Taiwan. After pass-ing 120◦E, Meranti turned northward. Typhoon Megi was on a northward-moving track and was also accompanied by the northeasterly monsoon. All three independent cases are atypical of northward-moving typhoons. Because of the lim-ited database, the verification results show that N-TRCM12 is not better than TRCM06. Model N-TRCM12 should be verified using more comprehensive data.
4.2 Typhoons accompanied by northeasterly monsoons
Figure 7 shows the forecasted rainfall accumulation com-pared to that of the observed values for all dependent case rain gauge stations using TRCM06 and A-TRCM12. The results indicate that the correlation coefficients of the fore-casts for each rain gauge station are 0.87 using TRCM06 and 0.95 using A-TRCM12. Model TRCM06 underestimates rainfall significantly more than model A-TRCM12. Model A-TRCM12 also produces a significantly lower root mean square.
Figure 8 shows the rainfall estimations for Typhoon Mitag from 14:00 LST, 26 November to 11:00 LST, 27 November, forecast using TRCM06 (Fig. 8b) and A-TRCM12 (Fig. 8c); Fig. 8a shows the observed rainfall amount. Results show that both models forecast the major rainfall area caused by Typhoon Mitag in eastern Taiwan. However, TRCM06
Fig. 6.The forecasted (y-axis) and observed (x-axis) rainfall ac-cumulations of the dependent northward-moving typhoons (from 1989 to 2006) for all rain gauge stations:(a)TRCM06; and(b) N-TRCM12.
underestimates the rainfall amount and A-TRCM12 signif-icantly overestimates the rainfall amount caused by Typhoon Mitag in eastern Taiwan. Both models also underestimate the rainfall in western Taiwan.
Average Maximum MeanAbsolute Root Mean Correlation Rainfall Rate Rainfall Rate Error Square Error Coefficient
Model Obs. Model Obs.
TRCM06 30
28 384 437 28.1 48.1 0.31
N-TRCM12 27 266 27.0 46.3 0.27
Fig. 7.The forecasted (y-axis) and observed (x-axis) rainfall ac-cumulations of the dependent typhoons accompanied with north-eastern monsoons (from 1989 to 2006) for all rain gauge stations:
(a)TRCM06; and(b)A-TRCM12.
However, the maximum rainfall rate and correlation co-efficient of A-TRCM12 is better than TRCM06. Table 8 shows the contingency table analysis results. Rainfall fore-cast using TRCM06 shifted from a slight underestimation (BS=0.73; threshold value=50 mm) to a severe underes-timation (BS=0.07; threshold value=350 mm) when the threshold value increased. By contrast, A-TRCM12 over-estimated rainfall regardless of threshold value. Estimated
Table 6.Validation results for the statistical parameters of indepen-dent northward-moving typhoons that hit Taiwan in 2007–2011 us-ing contus-ingency table analysis.
Criteria (mm day−1)
Score Models 50 130 200 350
BS TRCM06 0.97 0.79 0.91 1.00 N-TRCM12 0.87 0.56 0.50 –
POD TRCM06 0.38 0.12 0.07 0.00 N-TRCM12 0.33 0.11 0.05 –
FAR TRCM06 0.61 0.84 0.93 1.00 N-TRCM12 0.62 0.80 0.91 –
TS TRCM06 0.24 0.07 0.03 0.00 N-TRCM12 0.22 0.07 0.03 –
ETS TRCM06 0.13 0.06 0.03 0.00 N-TRCM12 0.12 0.06 0.03 –
Fig. 8.The accumulated rainfall amount associated with Typhoon Mitag (2007) accumulated from 14:00 LST, 26 November, to 11:00 LST, 27 November:(a) observed;(b) the rainfall amount forecasted using the TRCM06; and (c)the rainfall amount fore-casted using the A-TRCM12 (mm).
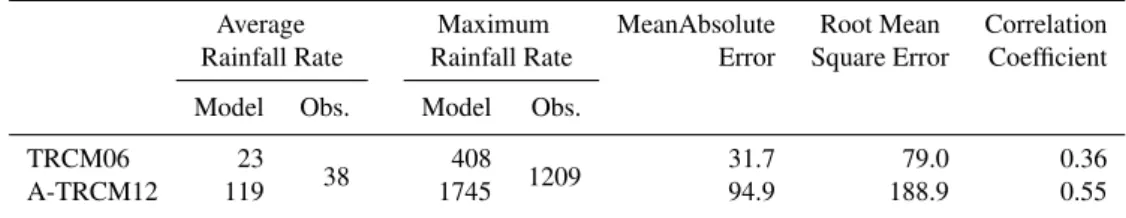
Table 7.Validation results for the statistical parameters of independent accompanied typhoons that hit Taiwan in 2007–2011.
Average Maximum MeanAbsolute Root Mean Correlation Rainfall Rate Rainfall Rate Error Square Error Coefficient
Model Obs. Model Obs.
TRCM06 23
38 408 1209 31.7 79.0 0.36 A-TRCM12 119 1745 94.9 188.9 0.55
Table 8.Validation results for the statistical parameters of inde-pendent accompanied typhoons that hit Taiwan in 2007–2011 using contingency table analysis.
Criteria (mm day−1)
Score Models 50 130 200 350
BS TRCM06 0.73 0.32 0.14 0.07 A-TRCM12 2.50 2.85 3.76 8.15
POD TRCM06 0.46 0.11 0.01 0.00 A-TRCM12 0.81 0.80 0.84 0.65
FAR TRCM06 0.37 0.67 0.90 1.00 A-TRCM12 0.67 0.72 0.78 0.92
TS TRCM06 0.36 0.09 0.01 0.00 A-TRCM12 0.30 0.26 0.21 0.08
ETS TRCM06 0.28 0.07 0.00 0.00 A-TRCM12 0.14 0.20 0.18 0.07
The validation results for the independent cases in 2007– 2011 show that A-TRCM12 performs better with heavy rain, but the model also has a larger FAR. Model A-TRCM12 in-cludes only five historical cases and typhoons accompanied by monsoons cause rainfall in different regions. Thus, severe overestimations and high FARs probably occur in certain re-gions. The accompanied effects of interaction between ty-phoon outer-core circulation and northeastern monsoons are usually restricted to a small region. Furthermore, the regions affected by the accompanied effects of various typhoons may differ. Hence, if A-TRCM12 is only used for forecasting, changes in the accompanied effects can lead to underesti-mating rainfall in regions affected by the accompanied ef-fects, and overestimating rainfall in other regions. The vari-ous effects of typhoons accompanied by monsoons must be analyzed to identify the regions significantly affected by the accompanied effects to improve typhoon rainfall forecasts. Therefore, this model should be used cautiously.
5 Summary and conclusion
This study extends the climatological model developed by Lee et al. (2006) using an updated database to 2006 to increase model stability. All typhoons that affected Tai-wan between 1989 and 2006 are also classified using the typhoon track classification created by the CWB to
establish climatological rainfall models for westward- (W-TRCM12) and northward-moving (N-(W-TRCM12) typhoons. Five typhoons accompanied by monsoons are also selected to develop accompanied climatological rainfall models (A-TRCM12). The dependent typhoons that occurred between 1989 and 2006 and the independent typhoons that occurred in 2007–2011 are used to validate established climatological rainfall models.
For the dependent cases, the results show that W-TRCM12 and N-TRCM12 perform better than TRCM06. Model W-TRCM12 significantly improved rainfall underestimations by TRCM06. However, underestimations are still provided by N-TRCM12. The models are further validated using in-dependent cases from 2007 to 2011. The results indicate that W-TRCM12 is better at forecasting rainfall amount (average and maximum rainfall rates) and rainfall distribution (mean absolute error and correlation coefficients) than TRCM06. Contingency table analysis is used to calculate the accuracy of precipitation forecasts. The results indicate that model W-TRCM12 provides better 24-h rainfall accumulation fore-casts for rain gauge stations during heavy rain. However, this model also has a larger FAR than TRCM06. Due to the lim-ited database for northward-moving cases, and because all in-dependent cases are not typical northward-moving typhoons. The validation results between N-TRCM12 and TRCM06 are not significant. However, N-TRCM12 has potential for rainfall forecasting and future cases should be verified using N-TRCM12.
Model A-TRCM12 performs better for the dependent cases. The model significantly reduces rainfall underestima-tions of TRCM06. The model is further validated using in-dependent cases from 2007 to 2011; the results indicate that the maximum rainfall rate and correlation coefficient of A-TRCM12 are better than TRCM06. The precipitation score calculated using the contingency table shows that although A-TRCM12 performs better (higher POD) with heavy rain, it also has a larger FAR.
variations between cases must be noted. The results of this study indicate that selecting similar types of typhoons can improve rainfall forecasting. For future study, the modifica-tion will be placed on river basins, and typhoons with similar properties (according to analogical concepts) will be used in order to forecast rainfall for various river basins using dif-ferent rainfall thresholds. It is anticipated that this approach can compensate for the severe underestimations provided by TRCM06 and the high FARs of the special models.
Acknowledgements. Comments and suggestions from John Knaff and the other anonymous reviewer improved the manuscript substantially, and are much appreciated. We are grateful to the Data Bank for Atmospheric Project, Taiwan Typhoon and Flood Research Institute, National Applied Research Laboratories for their atmospheric research data. This research was supported by the National Science Council of the Republic of China (Taiwan) under Grants NSC 101-2625-M-492-001.
Edited by: A. Mugnai
Reviewed by: J. Knaff and one anonymous referee
References
Barnes, S. L.: Mesoscale objective analysis using weighted time-series observations, NOAA Tech. Memo. ERL NSSL-62, National Severe Storms Lab., Norman OK 73069, 60 pp. [NTISCOM-73-10781], 1973.
Chang, C. P., Yeh, T. C., and Chen, J. M.: Effects of terrain on the surface structure of typhoons over Taiwan, Mon. Weather Rev., 121, 734–752, 1993.
Cheung, K. K. W., Huang, L.-R., and Lee, C.-S.: Characteristics of rainfall during tropical cyclone periods in Taiwan, Nat. Hazards Earth Syst. Sci., 8, 1463–1474, doi:10.5194/nhess-8-1463-2008, 2008.
cally enhanced precipitation event associated with tropical storm Rachel over Taiwan, Weather Forecast., 18, 325–344, 2003. Chou, K.-H., Wu, C.-C., and Yen, T.-H.: The evolution of Typhoon
Zeb in a non-hydrostatic mesoscale model, Atmos. Sci., 29, 291– 314, 2001 (in Chinese with an English abstract).
Chu, K.-K. and Chen, C.-K.: A study of heavy rainfall caused by typhoon Lynn, Atmos. Sci., 16, 253–262, 1988 (in Chinese with an English abstract).
Emanuel, K. A.,: Increasing destructiveness of tropical cyclones over the past 30 years, Nature, 436, 686–688, 2005.
Lee, C.-S., Huang, L.-R., Shen, H.-S., and Wang, S.-T.: A Clima-tology Model for Forecasting Typhoon Rainfall in Taiwan, Nat. Hazards, 37, 87–105, 2006.
Lee, C.-S., Luo, Y.-Z., and Chang, L.-Y.: A Study on the Heavy Rainfall Due to the Interactions of Typhoon Lynn (1987) and the Northeasterly Monsoon, Atmos. Sci., 35, 13–33, 2007 (in Chi-nese with an English abstract).
Lin, Y.-L., Sen, C., Wang, T.-A., Kaplan, M. L., and Weglarz, R. P.: Some Common Ingredients for Heavy Orographic Rainfall, Weather Forecast., 16, 633–660, 2001.
Liu, S. C., Fu, C., Shiu, C.-J., Chen, J.-P., and Wu, F.: Tempera-ture dependence of global precipitation extremes, Geophys. Res. Lett., 36, L17702, doi:10.1029/2009GL040218, 2009.
Wang, S.-T.: On the synoptic features associated with three to six consecutive rainy days in Taiwan during cold season, Meteorol. Bull., 16, 18–31, 1970 (in Chinese with an English abstract). Wang, S.-T.: An Integrated Study of the Impact of the Orography in
Taiwan on the Movement, Intensity, Structure, Wind and Rain-fall Distribution of Invading Typhoons, Technical Report 80–73, S&T of the Multiple Hazards Mitigation Program, NSC, Taiwan, 285 pp., 1992 (in Chinese).