ACPD
11, 19477–19506, 2011Reactive processing of formaldehyde and
acetaldehyde
Z. Li et al.
Title Page
Abstract Introduction
Conclusions References
Tables Figures
◭ ◮
◭ ◮
Back Close
Full Screen / Esc
Printer-friendly Version Interactive Discussion
Discussion
P
a
per
|
Dis
cussion
P
a
per
|
Discussion
P
a
per
|
Discussio
n
P
a
per
|
Atmos. Chem. Phys. Discuss., 11, 19477–19506, 2011 www.atmos-chem-phys-discuss.net/11/19477/2011/ doi:10.5194/acpd-11-19477-2011
© Author(s) 2011. CC Attribution 3.0 License.
Atmospheric Chemistry and Physics Discussions
This discussion paper is/has been under review for the journal Atmospheric Chemistry and Physics (ACP). Please refer to the corresponding final paper in ACP if available.
Reactive processing of formaldehyde and
acetaldehyde in aqueous aerosol mimics:
surface tension depression and
secondary organic products
Z. Li, A. N. Schwier, N. Sareen, and V. F. McNeill
Department of Chemical Engineering, Columbia University, New York, NY, 10027, USA
Received: 15 June 2011 – Accepted: 4 July 2011 – Published: 7 July 2011
Correspondence to: V. F. McNeill (vfm2103@columbia.edu)
ACPD
11, 19477–19506, 2011Reactive processing of formaldehyde and
acetaldehyde
Z. Li et al.
Title Page
Abstract Introduction
Conclusions References
Tables Figures
◭ ◮
◭ ◮
Back Close
Full Screen / Esc
Printer-friendly Version Interactive Discussion
Discussion
P
a
per
|
Dis
cussion
P
a
per
|
Discussion
P
a
per
|
Discussio
n
P
a
per
|
Abstract
The reactive uptake of carbonyl-containing volatile organic compounds (cVOCs) by aqueous atmospheric aerosols is a likely source of particulate organic material. The aqueous-phase secondary organic products of some cVOCs are surface-active. There-fore, cVOC uptake can lead to organic film formation at the gas-aerosol interface and
5
changes in aerosol surface tension. We examined the chemical reactions of two abun-dant cVOCs, formaldehyde and acetaldehyde, in water and aqueous ammonium sul-fate (AS) solutions mimicking tropospheric aerosols. Secondary organic products were identified using Aerosol Chemical Ionization Mass Spectrometry (Aerosol-CIMS), and changes in surface tension were monitored using pendant drop tensiometry.
Hemiac-10
etal oligomers and aldol condensation products were identified using Aerosol-CIMS. A hemiacetal sulfate ester was tentatively identified in the formaldehyde-AS system. Acetaldehyde depresses surface tension to 65(±2) dyn cm−1in pure water and 62(±1)
dyn cm−1in AS solutions. Surface tension depression by formaldehyde in pure water is negligible; in AS solutions, a 9 % reduction in surface tension is observed. Mixtures of
15
these species were also studied in combination with methylglyoxal in order to evaluate the influence of cross-reactions on surface tension depression and product formation in these systems. We find that surface tension depression in the solutions containing mixed cVOCs exceeds that predicted by an additive model based on the single-species isotherms.
20
1 Introduction
Organic material is a ubiquitous component of atmospheric aerosols, making up a major fraction of fine aerosol mass, but its sources and influence on aerosol proper-ties are still poorly constrained (Kanakidou et al., 2005; Jimenez et al., 2009). Many common organic aerosol species are surface-active (Shulman et al., 1996; Facchini
25
ACPD
11, 19477–19506, 2011Reactive processing of formaldehyde and
acetaldehyde
Z. Li et al.
Title Page
Abstract Introduction
Conclusions References
Tables Figures
◭ ◮
◭ ◮
Back Close
Full Screen / Esc
Printer-friendly Version Interactive Discussion
Discussion
P
a
per
|
Dis
cussion
P
a
per
|
Discussion
P
a
per
|
Discussio
n
P
a
per
|
hydrophobic groups to avoid contact with water while hydrophilic groups remain in so-lution. In an aqueous aerosol particle, they may partition to the gas-aerosol interface, reducing aerosol surface tension and potentially acting as a barrier to gas-aerosol mass transport (Folkers et al., 2003; McNeill et al., 2006). Depressed aerosol surface tension due to film formation may lead to a decrease in the critical supersaturation required for
5
the particle to activate and grow into a cloud droplet as described by K ¨ohler Theory (Kohler, 1936). The surface tension of atmospheric aerosol samples tends to be lower than that predicted based on the combined effects of the individual surfactants identi-fied in the aerosol (Facchini et al., 1999). This is in part because some surface-active aerosol organics remain unidentified. Additionally, the effects of interactions among
10
these species under typical aerosol conditions (i.e. supersaturated salt concentrations, acidic, multiple organic species) are generally unknown.
The adsorption of volatile organic compounds (VOCs) to aqueous aerosol and cloud droplet surfaces has been proposed as a route for the formation of organic surface films (Djikaev and Tabazadeh, 2003; Donaldson and Vaida, 2006). There is also growing
ev-15
idence that the reactive uptake of the carbonyl-containing VOCs (cVOCs) methylglyoxal and glyoxal by cloud droplets or aerosol water, followed by aqueous-phase chemistry to form low-volatility products, is a source of secondary organic aerosol material (Er-vens and Volkamer, 2010; Lim et al., 2010). We recently showed that methylglyoxal suppresses surface tension in aqueous aerosol mimics (Sareen et al., 2010).
20
Formaldehyde and acetaldehyde, two abundant, highly volatile aldehydes, can be directly emitted from combustion and industrial sources or generated in situ via the oxi-dation of other VOCs (Seinfeld and Pandis, 1998). In aqueous solution, both formalde-hyde and acetaldeformalde-hyde become hydrated and form acetal oligomers, similar to methyl-glyoxal and methyl-glyoxal (Loudon, 2009). Nozi `ere and coworkers showed that acetaldehyde
25
ACPD
11, 19477–19506, 2011Reactive processing of formaldehyde and
acetaldehyde
Z. Li et al.
Title Page
Abstract Introduction
Conclusions References
Tables Figures
◭ ◮
◭ ◮
Back Close
Full Screen / Esc
Printer-friendly Version Interactive Discussion
Discussion
P
a
per
|
Dis
cussion
P
a
per
|
Discussion
P
a
per
|
Discussio
n
P
a
per
|
processing of these species in aqueous aerosol mimics, alone and in combination with other cVOCs, is of interest, but has not been thoroughly studied to date.
We investigated the chemical reactions of formaldehyde and acetaldehyde in pure water and concentrated ammonium sulfate (AS) solutions mimicking aerosol water. The potential of these species to alter aerosol surface tension was examined, and
5
secondary organic products were identified using Aerosol Chemical Ionization Mass Spectrometry (Aerosol-CIMS).
2 Experimental methods
Aqueous solutions containing varying concentrations of organic compounds (acetalde-hyde, formaldehyde and/or methylglyoxal) with near-saturation concentrations (3.1 M)
10
of AS were prepared in 100 mL Pyrex vessels using Millipore water. The concentra-tion of acetaldehyde was 0.018 M–0.54 M. In the preparaconcentra-tions, 5 mL ampules of 99.9 wt% acetaldehyde (Sigma Aldrich) were diluted to 1.78 M using Millipore water imme-diately after opening in order to minimize oxidization. Varying amounts of this stock solution were used to prepare the final solutions within 30 min of opening the
am-15
pule. Formaldehyde and methylglyoxal (MG) were introduced from 37 wt% and 40 wt% aqueous solutions (Sigma Aldrich), respectively. The pH value of the reaction mixtures, measured using a digital pH meter (Accumet, Fisher Scientific), was 2.7–3.1. The surface tension of each sample was measured 24 h after solution preparation using pendant drop tensiometry (PDT). Pendant drops were suspended from the tip of
20
glass capillary tubes using a 100 µl syringe. The images of the pendant drops were captured and analyzed to determine the shape factor,H, and equatorial diameter,de,
as described previously (Sareen et al., 2010; Schwier et al., 2010). These parameters were used to calculate the surface tension according to:
σ=∆ρgd
2
e
H (1)
ACPD
11, 19477–19506, 2011Reactive processing of formaldehyde and
acetaldehyde
Z. Li et al.
Title Page
Abstract Introduction
Conclusions References
Tables Figures
◭ ◮
◭ ◮
Back Close
Full Screen / Esc
Printer-friendly Version Interactive Discussion
Discussion
P
a
per
|
Dis
cussion
P
a
per
|
Discussion
P
a
per
|
Discussio
n
P
a
per
|
whereσis surface tension,∆ρis the difference in density between the solution and the gas phase, andg is acceleration due to gravity (Adamson and Gast, 1997). Solution density was measured using an analytical balance (Denver Instruments). The drops were allowed to equilibrate for 2 min before image capture. Each measurement was repeated 7 times.
5
Aerosol-CIMS was used to detect the organic composition of the product mixtures as described in detail previously (Sareen et al., 2010; Schwier et al., 2010). Mixtures of formaldehyde, acetaldehyde-MG, and formaldehyde-MG in water and 3.1 M AS were prepared. Total organic concentration ranged from 0.2–2 M. All the AS solutions were diluted at 24 h with Millipore water until the salt concentration was 0.2 M. The
solu-10
tions were aerosolized in a stream of N2 using a constant output atomizer (TSI) and flowed through a heated 23 cm long, 1.25 cm ID PTFE tube (maintained at 135◦C) at RH>50 % before entering the CIMS, in order to volatilize the organic species into the gas phase for detection. The time between atomization and volatilization (≤3.5 s) is
too short for detectable quantities of the expected reaction products to form, therefore
15
the detected molecules are most likely formed in the bulk aqueous solutions. The solu-tions were tested in both positive and negative ion mode, using H3O+·(H2O)nand I−as
reagent ions, respectively. The applicability of this approach to the detection of acetal oligomers and aldol condensation products formed by dicarbonyls in aqueous aerosol mimics has been demonstrated previously (Sareen et al., 2010; Schwier et al., 2010).
20
The average particle concentration was∼4×104cm−3 and the volume weighted geo-metric mean diameter was 414(±14) nm.
The Pyrex vessels shielded the reaction mixtures from UV light with wavelengths <280 nm (Corning, Inc.), but the samples were not further protected from visible light. We previously showed that exposure to visible light in identical vessels does not impact
25
ACPD
11, 19477–19506, 2011Reactive processing of formaldehyde and
acetaldehyde
Z. Li et al.
Title Page
Abstract Introduction
Conclusions References
Tables Figures
◭ ◮
◭ ◮
Back Close
Full Screen / Esc
Printer-friendly Version Interactive Discussion
Discussion
P
a
per
|
Dis
cussion
P
a
per
|
Discussion
P
a
per
|
Discussio
n
P
a
per
|
3 Results
3.1 Surface tension measurements 3.1.1 Single-organic mixtures
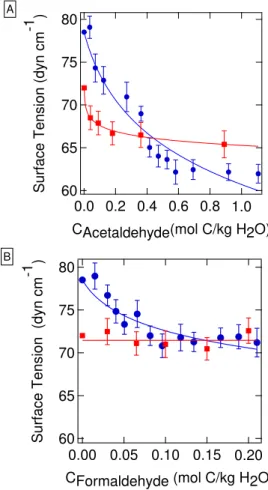
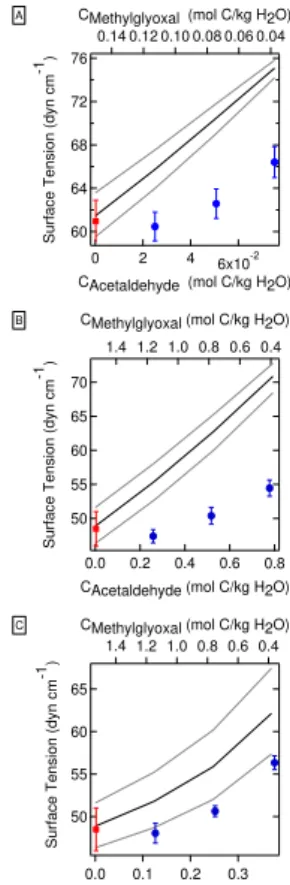
Results of the PDT experiments (Fig. 1) show that both formaldehyde and acetalde-hyde depress surface tension in 3.1 M AS solution, but the formaldeacetalde-hyde mixture
5
is less surface-active than that of acetaldehyde. The formaldehyde-AS solutions reach a minimum surface tension of 71.4±0.4 dyn cm−1 at 0.082 mol C (kg H2O)
−1 . This represents a 9 % reduction in surface tension from that of a 3.1 M AS solution (78.5±0.3 dyn cm−1). The acetaldehyde-AS solutions showed more significant sur-face tension depression. The sursur-face tension of the solutions reached a minimum
10
of 62±1 dyn cm−1 when the acetaldehyde concentration exceeded 0.527 mol C kg
(H2O)
−1
(20.6 % reduction compared to 3.1 M AS solution). Compared to the sur-face tension of the acetaldehyde in 3.1 M AS, the sursur-face tension depression of ac-etaldehyde in water is less significant. The surface tension of acac-etaldehyde in water decreases rapidly and reaches a minimum value of 65±2 dyn cm−1 at 0.89 mol C kg
15
(H2O)
−1
. Formaldehyde does not show any detectable surface tension depression in water in the absence of AS.
The surface tension data can be fit using the Szyszkowski-Langmuir equation:
σ=σ0−aTln(1+bC) (2)
where σ and σ0 are surface tension of the solution with and without organics, T is
20
ACPD
11, 19477–19506, 2011Reactive processing of formaldehyde and
acetaldehyde
Z. Li et al.
Title Page
Abstract Introduction
Conclusions References
Tables Figures
◭ ◮
◭ ◮
Back Close
Full Screen / Esc
Printer-friendly Version Interactive Discussion
Discussion
P
a
per
|
Dis
cussion
P
a
per
|
Discussion
P
a
per
|
Discussio
n
P
a
per
|
3.1.2 Binary mixtures
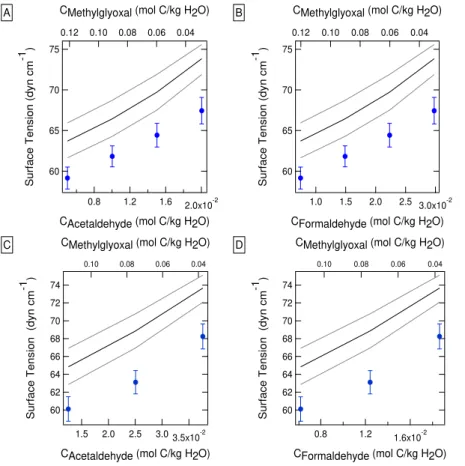
Surface tension results for aqueous solutions containing a mixture of two organic com-pounds (MG and formaldehyde or acetaldehyde) and 3.1 M AS are shown in Fig. 2. For a given total organic concentration (0.5 or 0.05 M), the surface tension decreased with increasing MG concentration. Re-plotting the data from Fig. 2 as a function of MG
5
concentration, it is apparent that the surface tension was very similar for mixtures with the same MG concentration, regardless of the identity or amount of the other species present in the mixture (Fig. 3).
Henning and coworkers developed the following model based on the Szyszkowski-Langmuir equation to predict the surface tension of complex, nonreacting mixtures of
10
organics (Henning et al., 2005):
σ=σ0(T)−ΣiχiaiTln(1+biCi) (3)
Here,Ci is the concentration of each organic species (moles carbon per kg H2O),χi
is the concentration (moles carbon per kg H2O) of compound i divided by the total soluble carbon concentration in solution, and ai and bi are the fit parameters from
15
the Szyszkowski-Langmuir equation for compound i. The Henning model has been shown to describe mixtures of nonreactive organics, such as succinic acid-adipic acid in inorganic salt solution, well (Henning et al., 2005). We also found that it was capable of describing surface tension depression in reactive aqueous mixtures containing MG, glyoxal, and AS (Schwier et al., 2010).
20
The predicted surface tension depression for the binary mixtures as calculated with the Henning model is shown in Fig. 2 as a black line, and the confidence intervals based on uncertainty in the Szyszkowski-Langmuir parameters are shown in grey. The ex-perimentally measured surface tensions are, in general, lower than the Henning model prediction, indicating a synergistic effect between MG and acetaldehyde/formaldehyde.
25
ACPD
11, 19477–19506, 2011Reactive processing of formaldehyde and
acetaldehyde
Z. Li et al.
Title Page
Abstract Introduction
Conclusions References
Tables Figures
◭ ◮
◭ ◮
Back Close
Full Screen / Esc
Printer-friendly Version Interactive Discussion
Discussion
P
a
per
|
Dis
cussion
P
a
per
|
Discussion
P
a
per
|
Discussio
n
P
a
per
|
3.1.3 Ternary mixtures
As shown in Fig. 4, 3.1 M AS solutions containing ternary mixtures of MG, acetaldehyde and formaldehyde also exhibit surface tension depression lower than that predicted by the Henning model. For the ternary mixture experiments, the molar ratio of acetalde-hyde to formaldeacetalde-hyde was either 1:3 (Fig. 4a and b) or 1:1 (Fig. 4c and d) and the MG
5
concentration was varied. The total organic concentration remained constant at 0.05 M. Recasting the data of Fig. 4 as a function of MG concentration shows a similar trend as what was observed for the binary mixtures; for a constant total organic concentration, MG content largely determines the surface tension, regardless of the relative amounts of acetaldehyde and formaldehyde present (Fig. 3).
10
3.2 Aerosol-CIMS characterization
The CIMS data show products of self- and cross-reactions of formaldehyde, acetalde-hyde and MG in pure water and 3.1 M AS. We did not perform Aerosol-CIMS analysis on acetaldehyde-AS or acetaldehyde-H2O solutions because these systems have been characterized extensively by others (Nozi `ere et al., 2010a; Casale et al., 2007).
15
3.2.1 Formaldehyde
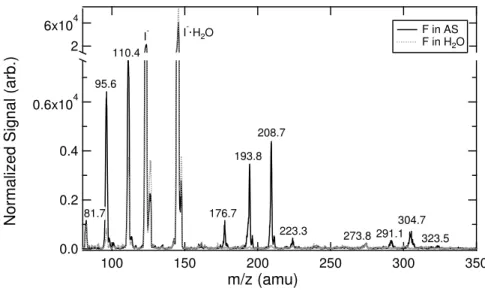
The mass spectra for formaldehyde in H2O and in 3.1 M AS obtained using negative ion detection with I− as the reagent ion is shown in Fig. 5. Possible structures are shown in Table 2. The spectrum shows peaks with mass-to-charge ratios correspond-ing to formic acid at 81.7 (CHO−2·2H2O) and 208.7 amu (I
−
·CH2O2·2H2O) and several
20
peaks consistent with hemiacetal oligomers. 223.3, 291.1, and 323.5 amu are con-sistent with clusters of hemiacetals with I−. A small amount of formic acid impurity exists in the 37 % formaldehyde aqueous stock solution (Sigma Aldrich). The peaks at 95.6, 110.4, 273.8 and 304.7 amu are consistent with clusters of ionized hemiac-etals with H2O. While ionization of alcohols by I
−
is normally not favorable, ionized
ACPD
11, 19477–19506, 2011Reactive processing of formaldehyde and
acetaldehyde
Z. Li et al.
Title Page
Abstract Introduction
Conclusions References
Tables Figures
◭ ◮
◭ ◮
Back Close
Full Screen / Esc
Printer-friendly Version Interactive Discussion
Discussion
P
a
per
|
Dis
cussion
P
a
per
|
Discussion
P
a
per
|
Discussio
n
P
a
per
|
paraformaldehyde-type hemiacetals are stabilized by interactions between the ionized
−O−and the other terminal hydroxyl group(s) on the molecule (see the Supplement).
Within our instrument resolution, the peaks atm/z176.7 and 193.8 amu peaks could be consistent with the mass of methanol, which is added to commercial formalde-hyde solutions as a stabilizer. However, methanol is not predicted to cluster with I−.
5
Furthermore, these peaks are not observed in the formaldehyde-H2O spectrum and are present only with the addition of AS, implying that the species observed at those masses are formed via reaction with AS. No favorable pathway for the reduction of formaldehyde to form methanol in an acidic medium is known. The peak at 193.8 amu is consistent with an organosulfate species formed from a formaldehyde hemiacetal
10
dimer (C2H5O6S−·2H2O). The peak at 176.7 amu matches an ion formula of C6H9O−6
or C2H7O6S
−
·H2O, but the structures and formation mechanisms of those species are unknown.
The positive-ion spectrum of the formaldehyde solution in 3.1 M AS corroborates the identification of hemiacetal oligomers. To our knowledge, organosulfate species have
15
not previously been observed using proton-transfer mass spectrometry (Sareen et al., 2010). The spectrum and peak assignments can be found in the Supplement.
3.2.2 Formaldehyde-methylglyoxal mixtures
The negative-ion spectrum (detected with I−) for an aqueous mixture of formaldehyde, MG, and AS is shown in Fig. 6, with possible peak assignments listed in Table 3. Most
20
of the peaks are consistent with formaldehyde hemiacetal oligomers, such as 186.7, 203.5, 230.3, 257.4, and 264.5 amu. Formic acid was detected at 172.8 amu and 208.7 amu. The peak at 288.1 corresponds to MG self-reaction products formed either via aldol condensation or hemiacetal mechanisms (Sareen et al., 2010; Schwier et al., 2010). Several peaks could correspond to self-reaction products of either
formalde-25
ACPD
11, 19477–19506, 2011Reactive processing of formaldehyde and
acetaldehyde
Z. Li et al.
Title Page
Abstract Introduction
Conclusions References
Tables Figures
◭ ◮
◭ ◮
Back Close
Full Screen / Esc
Printer-friendly Version Interactive Discussion
Discussion
P
a
per
|
Dis
cussion
P
a
per
|
Discussion
P
a
per
|
Discussio
n
P
a
per
|
correspond to either a similar cross-reaction product (MG+2 formaldehyde) or a MG dimer. Formaldehyde hemiacetal self-reaction products and formic acid were detected in the positive-ion spectrum (Supplement).
3.2.3 Acetaldehyde-methylglyoxal mixtures
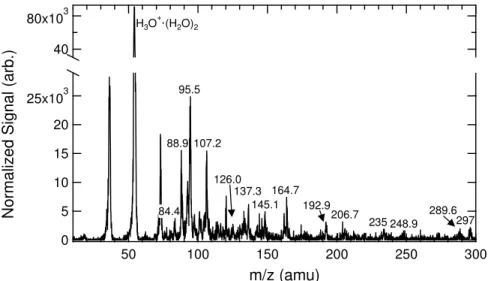
The H3O+.(H2O)n spectrum for aqueous acetaldehyde-MG-AS mixtures is shown in
5
Fig. 7, with peak assignments listed in Table 4. Hydrated acetaldehyde can be ob-served at 98.4 amu. Several peaks are consistent with the cross-reaction products of MG and acetaldehyde via an aldol mechanism (126.0, 134.0, 206.7, and 248.9 amu). Formic, glyoxylic, and glycolic acids correspond to the peaks at 84.4, 93.5, and 95.5 amu, respectively. Since no significant source of oxidants exists in the reaction
mix-10
tures, the formation mechanisms for these species in this system are unknown. The peaks at 88.9 and 107.2 are consistent with either pyruvic acid or crotonaldehyde. Large aldol condensation products from the addition of 6–10 acetaldehydes are ob-served at 192.9, 289.6, and 297 amu. The peaks at 145.1, 162.9, 164.7 and 235 amu are consistent with MG self-reactions, as discussed by Sareen et al. (2010). The peak
15
at 137.3 amu is consistent with a species with molecular formula C5H12O3, but the mechanism is unknown.
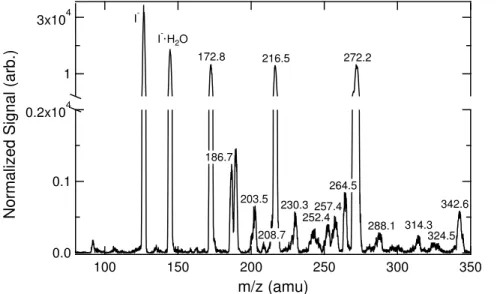
The I− negative-ion spectrum for acetaldehyde-MG-AS mixtures shows similar re-sults to the positive-ion spectrum (see Fig. 8 and Table 5), however aldol condensation products are not detected by this method unless they contain a terminal carboxylic acid
20
group or neighboring hydroxyl groups (Sareen et al., 2010). Small acid species, such as formic, acetic and crotonic acid (172.7 (208.4), 186.4 and 230.7 amu, respectively), were detected. Hydrated acetaldehyde (189.6 and 224.1 amu) and MG (216.3 amu), and hemiacetal self-dimers of acetaldehyde and MG (230.7, 256.4, 264.4, 269.5, and 342.3) were also observed. 256.4 amu is consistent with a MG aldol condensation
25
dimer product, and 272.2 amu could correspond either to a MG hemiacetal dimer or an aldol condensation product. 242.9 amu, I−·C5H8O3, is consistent with an aldol
ACPD
11, 19477–19506, 2011Reactive processing of formaldehyde and
acetaldehyde
Z. Li et al.
Title Page
Abstract Introduction
Conclusions References
Tables Figures
◭ ◮
◭ ◮
Back Close
Full Screen / Esc
Printer-friendly Version Interactive Discussion
Discussion
P
a
per
|
Dis
cussion
P
a
per
|
Discussion
P
a
per
|
Discussio
n
P
a
per
|
following ion formulas, C6H9O
−
6 and C2H7O6S
−
·H2O, but the mechanisms and struc-tures are unknown.
Note that several peaks appear at similar mass-to-charge ratios in the negative mode mass spectra of both the formaldehyde-MG and acetaldehyde-MG mixtures. MG self-reaction products are expected to be present in both systems. Beyond this,
formalde-5
hyde and acetaldehyde are structurally similar small molecules which follow similar oligomerization mechanisms alone and with MG. In several cases, peaks in the mass spectra corresponding to structurally distinct expected reaction products for each sys-tem have similar mass-to-charge ratios. For example, the formaldehyde hemiacetal 4-mer (I−.C4H10O5) and the acetaldehyde dimer (I
−.
C4H6O
.
32H2O) are both apparent
10
at 264 amu.
4 Discussion
Both formaldehyde and acetaldehyde, and their aqueous-phase reaction products, were found to depress surface tension in AS solutions. However, surface tension de-pression was not observed in aqueous formaldehyde solutions containing no salt. Net
15
surface tension depression by acetaldehyde was greater in the AS solutions than in pure water. These differences are likely due to chemical and physical effects of the salt. The salt promotes the formation of surface-active species: several of the reaction products in the AS systems identified using Aerosol-CIMS are known or expected to be surface-active, such as organosulfates (Nozi `ere et al., 2010b) and organic acids.
20
Salts can also alter the partitioning of these volatile yet water-soluble organic species between the gas phase and aqueous solution. Formaldehyde has a small Henry’s Law constant of 2.5 M atm−1, although hydration in the aqueous phase leads to an ef-fective Henry’s Law constant of 3×10³M atm−1, similar to that of MG (Seinfeld and
Pandis, 1998; Betterton and Hoffmann, 1988). The effective Henry’s Law constant for
25
ACPD
11, 19477–19506, 2011Reactive processing of formaldehyde and
acetaldehyde
Z. Li et al.
Title Page
Abstract Introduction
Conclusions References
Tables Figures
◭ ◮
◭ ◮
Back Close
Full Screen / Esc
Printer-friendly Version Interactive Discussion
Discussion
P
a
per
|
Dis
cussion
P
a
per
|
Discussion
P
a
per
|
Discussio
n
P
a
per
|
Mopper to increase slightly in aqueous solutions containing an increasing proportion of seawater (up to 100 %), but the opposite is true for acetaldehyde (Zhou and Mop-per, 1990). The reaction mixtures studied here equilibrated with the gas phase for 24 h before the surface tension measurements were performed. Each pendant drop equili-brated for 2 min before image capture, after which time there was no detectable change
5
in drop shape. Some of the organics may be lost to the gas phase during equilibration. However, the lower volatility of the aqueous-phase reaction products, especially those formed through oligomerization, leads to significant organic material remaining in the condensed phase (enough to cause surface tension depression and be detected via Aerosol-CIMS).
10
When formaldehyde and acetaldehyde are present in combination with MG, as would likely happen in the atmosphere, there is a synergistic effect: surface tension depres-sion in the solutions containing mixed organics exceeds that predicted by an additive model based on the single-species isotherms. This effect could be due to the formation of more surface-active reaction products in the mixed systems. The deviation from the
15
Henning model prediction was less than 10 % except in the case of the acetaldehyde-MG-AS mixtures. Between 21–30 % of the detected product mass was identified as cross products in the Aerosol-CIMS positive mode analysis of the acetaldehyde-MG mixtures following Schwier et al. (2010). Most of the oligomers identified in this sys-tem were aldol condensation products, which have fewer hydroxyl groups than acetal
20
oligomers and are therefore expected to be more hydrophobic. A number of organic acid products, likely to be surface-active, were also identified in the acetaldehyde-MG-AS system.
In contrast to the MG-glyoxal system (Schwier et al., 2010), the presence of formaldehyde and/or acetaldehyde in aqueous MG-AS solutions does influence
sur-25
ACPD
11, 19477–19506, 2011Reactive processing of formaldehyde and
acetaldehyde
Z. Li et al.
Title Page
Abstract Introduction
Conclusions References
Tables Figures
◭ ◮
◭ ◮
Back Close
Full Screen / Esc
Printer-friendly Version Interactive Discussion
Discussion
P
a
per
|
Dis
cussion
P
a
per
|
Discussion
P
a
per
|
Discussio
n
P
a
per
|
The formaldehyde hemiacetal dimer (C2H6O6S) may form via the reaction of C2H6O3 with H2SO4 (Deno and Newman, 1950). The equilibrium concentration of H2SO4 in our bulk solutions (3.1 M AS, pH=3) is small (2.8×10⁻⁷M). Minerath and coworkers showed that alcohol sulfate ester formation is slow under tropospheric aerosol con-ditions (Minerath et al., 2008). Based on our observations, assuming a maximum
5
Aerosol-CIMS sensitivity of 100 Hz ppt−1to this species (Sareen et al., 2010) we infer a concentration of ≥2×10⁻⁴M in the bulk solution after 24 h of reaction. Using our experimental conditions and the kinetics of ethylene glycol sulfate esterification from Minerath et al., we predict a maximum concentration of 7×10⁻⁸M. This suggests that
either (a) the kinetics of sulfate esterification for paraformaldehyde are significantly
10
faster than for alcohols (b) SO−42 or HSO−4 is the active reactant, contrary to the con-clusions of Deno and Newman, or (c) sulfate esterification is enhanced by atomization. See the Supplement for details of these calculations. Photochemical production of organosulfates has also been observed (Galloway et al., 2009; Nozi `ere et al., 2010b; Perri et al., 2010). Our samples were protected from UV light by the Pyrex reaction
15
vessels, and no significant OH source was present, so we don’t expect photochemical organosulfate production to be efficient in this system.
Nitrogen-containing compounds could also be formed in these reaction mixtures due to the presence of the ammonium ion (Sareen et al., 2010; Nozi `ere et al., 2009; Gal-loway et al., 2009). No unambiguous identifications of C-N containing products were
20
made in this study, but analysis using a mass spectrometry technique with higher mass resolution could reveal their presence.
The relatively low solubility of formaldehyde and acetaldehyde in water suggests that their potential to contribute to total SOA mass is low as compared to highly soluble species such as glyoxal. This is supported by the observations of Kroll et al. (2005) that
25
ACPD
11, 19477–19506, 2011Reactive processing of formaldehyde and
acetaldehyde
Z. Li et al.
Title Page
Abstract Introduction
Conclusions References
Tables Figures
◭ ◮
◭ ◮
Back Close
Full Screen / Esc
Printer-friendly Version Interactive Discussion
Discussion
P
a
per
|
Dis
cussion
P
a
per
|
Discussion
P
a
per
|
Discussio
n
P
a
per
|
Romakkaniemi and coworkers recently showed significant enhancement of aqueous-phase SOA production by surface-active species beyond what would be predicted based on Henry’s Law due to surface-bulk partitioning (Romakkaniemi et al., 2011).
5 Conclusions
Two highly volatile organic compounds, formaldehyde and acetaldehyde, were found to
5
form secondary organic products in aqueous ammonium sulfate (AS) solutions mimick-ing tropospheric aerosols. These species, and their aqueous-phase reaction products, lead to depressed surface tension in the aqueous solutions. This adds to the growing body of evidence that VOCs are a secondary source of surface-active organic material in aerosols.
10
Supplementary material related to this article is available online at: http://www.atmos-chem-phys-discuss.net/11/19477/2011/
acpd-11-19477-2011-supplement.pdf.
Acknowledgements. This work was funded by the NASA Tropospheric Chemistry program (grant NNX09AF26G) and the ACS Petroleum Research Fund (Grant 48788-DN14). The au-15
thors gratefully acknowledge the Koberstein group at Columbia University for use of the pendant drop tensiometer.
References
Adamson, A. W. and Gast, A. P.: Physical chemistry of surfaces, Wiley, New York, 1997.
Betterton, E. A. and Hoffmann, M. R.: Henry Law Constants of Some Environmentally
Impor-20
tant Aldehydes, Environ. Sci. Technol., 22(12), 1415–1418, 1988.
ACPD
11, 19477–19506, 2011Reactive processing of formaldehyde and
acetaldehyde
Z. Li et al.
Title Page
Abstract Introduction
Conclusions References
Tables Figures
◭ ◮
◭ ◮
Back Close
Full Screen / Esc
Printer-friendly Version Interactive Discussion
Discussion
P
a
per
|
Dis
cussion
P
a
per
|
Discussion
P
a
per
|
Discussio
n
P
a
per
|
Deno, N. C. and Newman, M. S.: Mechanism of Sulfation of Alcohols, J. Am. Chem. Soc., 72(9), 3852–3856, 1950.
Djikaev, Y. S. and Tabazadeh, A.: Effect of adsorption on the uptake of organic trace gas
by cloud droplets, J. Geophys. Res.-Atmos., 108(D22), 4869, doi:10.1029/2003JD003741, 2003.
5
Donaldson, D. J. and Vaida, V.: The influence of organic films at the air-aqueous boundary on atmospheric processes, Chem. Rev., 106(4), 1445–1461, 2006.
Ervens, B. and Volkamer, R.: Glyoxal processing by aerosol multiphase chemistry: towards a kinetic modeling framework of secondary organic aerosol formation in aqueous particles, Atmos. Chem. Phys., 10, 8219–8244, doi:10.5194/acp-10-8219-2010, 2010.
10
Facchini, M. C., Mircea, M., Fuzzi, S., and Charlson, R. J.: Cloud albedo enhancement by surface-active organic solutes in growing droplets, Nature, 401(6750), 257–259, 1999. Folkers, M., Mentel, T. F., and Wahner, A.: Influence of an organic coating on the reactivity of
aqueous aerosols probed by the heterogeneous hydrolysis of N2O5, Geophys. Res. Lett.,
30(12), 1644–1647, doi:10.1029/2003GL017168, 2003. 15
Galloway, M. M., Chhabra, P. S., Chan, A. W. H., Surratt, J. D., Flagan, R. C., Seinfeld, J. H., and Keutsch, F. N.: Glyoxal uptake on ammonium sulphate seed aerosol: reaction products and reversibility of uptake under dark and irradiated conditions, Atmos. Chem. Phys., 9, 3331–3345, doi:10.5194/acp-9-3331-2009, 2009.
Henning, S., Rosenrn, T., D’Anna, B., Gola, A. A., Svenningsson, B., and Bilde, M.: Cloud 20
droplet activation and surface tension of mixtures of slightly soluble organics and inorganic salt, Atmos. Chem. Phys., 5, 575–582, doi:10.5194/acp-5-575-2005, 2005.
Jimenez, J. L., Canagaratna, M. R., Donahue, N. M., Prevot, A. S. H., Zhang, Q., Kroll, J. H., DeCarlo, P. F., Allan, J. D., Coe, H., Ng, N. L., Aiken, A. C., Docherty, K. S., Ulbrich, I. M., Grieshop, A. P., Robinson, A. L., Duplissy, J., Smith, J. D., Wilson, K. R., Lanz, V. A., Hueglin, 25
C., Sun, Y. L., Tian, J., Laaksonen, A., Raatikainen, T., Rautiainen, J., Vaattovaara, P., Ehn,
M., Kulmala, M., Tomlinson, J. M., Collins, D. R., Cubison, M. J., Dunlea, E. J., Huffman, J.
A., Onasch, T. B., Alfarra, M. R., Williams, P. I., Bower, K., Kondo, Y., Schneider, J., Drewnick,
F., Borrmann, S., Weimer, S., Demerjian, K., Salcedo, D., Cottrell L., Griffin, R., Takami, A.,
Miyoshi, T., Hatakeyama, S., Shimono, A., Sun, J. Y., Zhang, Y. M., Dzepina, K., Kimmel, 30
ACPD
11, 19477–19506, 2011Reactive processing of formaldehyde and
acetaldehyde
Z. Li et al.
Title Page
Abstract Introduction
Conclusions References
Tables Figures
◭ ◮
◭ ◮
Back Close
Full Screen / Esc
Printer-friendly Version Interactive Discussion
Discussion
P
a
per
|
Dis
cussion
P
a
per
|
Discussion
P
a
per
|
Discussio
n
P
a
per
|
Kanakidou, M., Seinfeld, J. H., Pandis, S. N., Barnes, I., Dentener, F. J., Facchini, M. C., Van Dingenen, R., Ervens, B., Nenes, A., Nielsen, C. J., Swietlicki, E., Putaud, J. P., Balkanski, Y., Fuzzi, S., Horth, J., Moortgat, G. K., Winterhalter, R., Myhre, C. E. L., Tsigaridis, K., Vignati, E., Stephanou, E. G., and Wilson, J.: Organic aerosol and global climate modelling: a review, Atmos. Chem. Phys., 5, 1053–1123, doi:10.5194/acp-5-1053-2005, 2005.
5
Kohler, H.: The nucleus in the growth of hygroscopic droplets, Trans. Faraday Soc., 32, 1152– 1161, 1936.
Kroll, J. H., Ng, N. L., Murphy, S. M., Varutbangkul, V., Flagan, R. C., and Seinfeld, J. H.: Cham-ber studies of secondary organic aerosol growth by reactive uptake of simple carbonyl com-pounds, J. Geophys. Res.-Atmos., 110(D23), D23207, doi:10.1029/2005JD006004, 2005. 10
Lim, Y. B., Tan, Y., Perri, M. J., Seitzinger, S. P., and Turpin, B. J.: Aqueous chemistry and its role in secondary organic aerosol (SOA) formation, Atmos. Chem. Phys., 10, 10521–10539, doi:10.5194/acp-10-10521-2010, 2010.
Loudon, G. M.: Organic chemistry, Roberts and Co., Greenwood Village, CO, 2009.
McNeill, V. F., Patterson, J., Wolfe, G. M., and Thornton, J. A.: The effect of varying levels
15
of surfactant on the reactive uptake of N2O5 to aqueous aerosol, Atmos. Chem. Phys., 6,
1635–1644, doi:10.5194/acp-6-1635-2006, 2006.
Minerath, E. C., Casale, M. T., and Elrod, M. J.: Kinetics feasibility study of alcohol sulfate esterification reactions in tropospheric aerosols, Environ. Sci. Technol., 42(12), 4410–4415, 2008.
20
Nozi `ere, B., Dziedzic, P., and Cordova, A.: Products and Kinetics of the Liquid-Phase Reaction
of Glyoxal Catalyzed by Ammonium Ions (NH+4), J. Phys. Chem. A, 113(1), 231–237, 2009.
Nozi `ere, B., Dziedzic, P., and Cordova, A.: Inorganic ammonium salts and carbonate salts are
efficient catalysts for aldol condensation in atmospheric aerosols, Phys. Chem. Chem. Phys.,
12(15), 3864–3872, 2010a. 25
Nozi `ere, B., Ekstrom, S., Alsberg, T., and Holmstrom, S.: Radical-initiated formation of organosulfates and surfactants in atmospheric aerosols, Geophys. Res. Lett., 37, L05806, doi:10.1029/2009GL041683, 2010b.
Perri, M. J., Lim, Y. B., Seitzinger, S. P., and Turpin, B. J.: Organosulfates from glycolaldehyde in aqueous aerosols and clouds: Laboratory studies, Atmos. Environ., 44(21–22), 2658–2664, 30
2010.
ACPD
11, 19477–19506, 2011Reactive processing of formaldehyde and
acetaldehyde
Z. Li et al.
Title Page
Abstract Introduction
Conclusions References
Tables Figures
◭ ◮
◭ ◮
Back Close
Full Screen / Esc
Printer-friendly Version Interactive Discussion
Discussion
P
a
per
|
Dis
cussion
P
a
per
|
Discussion
P
a
per
|
Discussio
n
P
a
per
|
Surface, and Gas-Phase, Geophys. Res. Lett., 38(3), L03807, doi:10.1029/2010GL046147, 2011.
Sareen, N., Schwier, A. N., Shapiro, E. L., Mitroo, D., and McNeill, V. F.: Secondary organic material formed by methylglyoxal in aqueous aerosol mimics, Atmos. Chem. Phys., 10, 997– 1016, doi:10.5194/acp-10-997-2010, 2010.
5
Schwier, A. N., Sareen, N., Mitroo, D. M., Shapiro, E. L., and McNeill, V. F.: Glyoxal-Methylglyoxal Cross-Reactions in Secondary Organic Aerosol Formation, Environ. Sci. Tech-nol., 44(16), 6174–6182, 2010.
Seinfeld, J. H. and Pandis, S. N.: Atmospheric Chemistry and Physics: From air pollution to climate change, Wiley, New York, 1998.
10
Shapiro, E. L., Szprengiel, J., Sareen, N., Jen, C. N., Giordano, M. R., and McNeill, V. F.: Light-absorbing secondary organic material formed by glyoxal in aqueous aerosol mimics, Atmos. Chem. Phys., 9, 2289–2300, doi:10.5194/acp-9-2289-2009, 2009.
Shulman, M. L., Jacobson, M. C., Carlson, R. J., Synovec, R. E., and Young, T. E.: Dissolution
behavior and surface tension effects of organic compounds in nucleating cloud droplets,
15
Geophys. Res. Lett., 23(3), 277–280, 1996.
Wang, X. F., Gao, S., Yang, X., Chen, H., Chen, J. M., Zhuang, G. S., Surratt, J. D., Chan, M. N., and Seinfeld, J. H.: Evidence for High Molecular Weight Nitrogen-Containing Organic Salts in Urban Aerosols, Environ. Sci. Technol., 44(12), 4441–4446, 2010.
Zhou, X. L. and Mopper, K.: Apparent Partition-Coefficients of 15 Carbonyl-Compounds
Be-20
ACPD
11, 19477–19506, 2011Reactive processing of formaldehyde and
acetaldehyde
Z. Li et al.
Title Page
Abstract Introduction
Conclusions References
Tables Figures
◭ ◮
◭ ◮
Back Close
Full Screen / Esc
Printer-friendly Version Interactive Discussion
Discussion
P
a
per
|
Dis
cussion
P
a
per
|
Discussion
P
a
per
|
Discussio
n
P
a
per
|
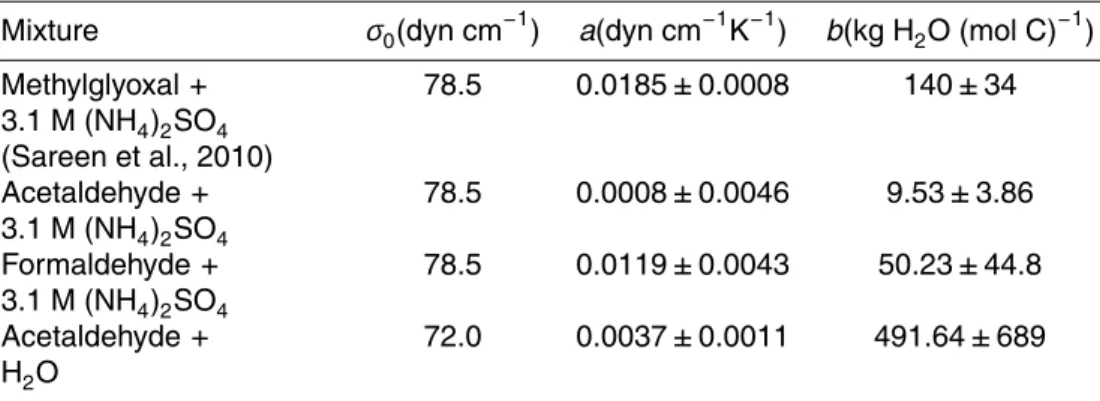
Table 1.Szyszkowski-Langmuir Fit Parameters according to Eq. (2).
Mixture σ0(dyn cm−1) a(dyn cm−1K−1) b(kg H2O (mol C)−1)
Methylglyoxal+
3.1 M (NH4)2SO4
(Sareen et al., 2010)
78.5 0.0185±0.0008 140±34
Acetaldehyde+
3.1 M (NH4)2SO4
78.5 0.0008±0.0046 9.53±3.86
Formaldehyde+
3.1 M (NH4)2SO4
78.5 0.0119±0.0043 50.23±44.8
Acetaldehyde+
H2O
ACPD
11, 19477–19506, 2011Reactive processing of formaldehyde and
acetaldehyde
Z. Li et al.
Title Page
Abstract Introduction
Conclusions References
Tables Figures
◭ ◮
◭ ◮
Back Close
Full Screen / Esc
Printer-friendly Version Interactive Discussion
Discussion
P
a
per
|
Dis
cussion
P
a
per
|
Discussion
P
a
per
|
Discussio
n
P
a
per
|
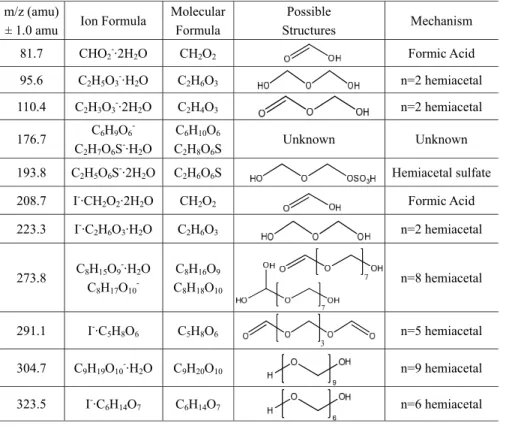
Table 2.Proposed peak assignments for Aerosol-CIMS mass spectra with I−of atomized
solu-tions of 0.2 M formaldehyde in 3.1 M AS. σ
ized solutions of 0.2 M formaldehyde in 3.1 M AS.
4
5
m/z (amu)
± 1.0 amu Ion Formula
Molecular Formula
Possible
Structures Mechanism
81.7 CHO2-·2H2O CH2O2 Formic Acid
95.6 C2H5O3-·H2O C2H6O3 n=2 hemiacetal
110.4 C2H3O3-·2H2O C2H4O3 n=2 hemiacetal
176.7 C6H9O6
-
C2H7O6S-·H2O
C6H10O6
C2H8O6S
Unknown Unknown
193.8 C2H5O6S-·2H2O C2H6O6S Hemiacetal sulfate
208.7 I-·CH2O2·2H2O CH2O2 Formic Acid
223.3 I
-·C2H6O3·H2O C2H6O3 n=2 hemiacetal
273.8 C8H15O9
-·H2O
C8H17O10
-C8H16O9
C8H18O10
n=8 hemiacetal
291.1 I-·C5H8O6 C5H8O6 n=5 hemiacetal
304.7 C9H19O10-·H2O C9H20O10 n=9 hemiacetal
ACPD
11, 19477–19506, 2011Reactive processing of formaldehyde and
acetaldehyde
Z. Li et al.
Title Page Abstract Introduction Conclusions References Tables Figures ◭ ◮ ◭ ◮ Back Close
Full Screen / Esc
Printer-friendly Version Interactive Discussion Discussion P a per | Dis cussion P a per | Discussion P a per | Discussio n P a per |
Table 3.Proposed peak assignments 446 for Aerosol-CIMS mass spectra with I− of atomized
solutions of 2 M formaldehyde/MG (1:1) in 3.1 M AS.
ized solutions of 2 M formaldehyde/MG (1:1) in 3.1 M AS.
7
m/z (amu)
± 1.0 amu Ion Formula
Molecular
Formula Possible Structures Mechanism
172.8 I
-·CH2O2 CH2O2 Formic Acid
186.7 I
-·C2H4O2 C2H4O2 cyclic F acetal
203.5 C5H11O6-·2H2O C5H12O6 n=5 F hemiacetal
208.7 I
-·CH2O2·2H2O CH2O2 Formic Acid
216.5 I
-·C3H6O3 C3H6O3
Hydrated MG or cyclic F acetal
230.3 I
-·C3H4O4 C3H4O4 n = 3 F hemiacetal
252.4 I
-·C6H6O3
I
-·C3H8O4·H2O
I
-·C3H6O3·2H2O
C6H6O3
C3H8O4
C3H6O3
MG aldol, n = 3 F hemiacetal,
Hydrated MG, or cyclic F acetal
257.4 C8H17O9
-C8H18O9 n=8 F hemiacetal
264.5 I
-·C4H10O5 C4H10O5 n=4 F hemiacetal
272.2 I
-·C6H10O4 C6H10O4
MG aldol and hemi-acetal
I
-·C5H6O5 C5H6O5
MG + 2F hemiacetal
288.1 I
-·C6H10O5
I
-·C6H8O4·H2O
I
-·C6H6O3·2H2O
C6H10O5
C6H8O4
C6H6O3
MG aldol and hemi-acetal
314.3 I
-·C5H12O5·2H2O C5H12O5
MG + 2F hemiacetal
324.5 I
-·C6H14O7
I
-·C6H12O6·H2O
I
-·C6H10O5·2H2O
C6H14O7
C6H12O6
C6H10O5
n=6 F hemiacetal, MG hemiacetal
342.6 I
-·C6H14O7·H2O
I
-·C6H12O6·2H2O
C6H14O7
C6H12O6
n=6 F hemiacetal, MG hemiacetal
ACPD
11, 19477–19506, 2011Reactive processing of formaldehyde and
acetaldehyde
Z. Li et al.
Title Page
Abstract Introduction
Conclusions References
Tables Figures
◭ ◮
◭ ◮
Back Close
Full Screen / Esc
Printer-friendly Version Interactive Discussion
Discussion
P
a
per
|
Dis
cussion
P
a
per
|
Discussion
P
a
per
|
Discussio
n
P
a
per
|
Table 4.Proposed peak assignments for Aerosol-CIMS mass spectra with H3O+ of atomized
solutions of 0.5 M acetaldehyde/MG (1:1) in 3.1 M AS.
atomized solutions of 0.5 M acetaldehyde/MG (1:1) in 3.1 M AS
1 m/z (amu) ± 1.0 amu Ion Formula
Molecular
Formula Possible Structures Mechanism 84.4 CH3O2+
·2H2O CH2O2 Formic Acid
88.9
C3H5O3+ C3H4O3 Pyruvic Acid C4H7O+
·H2O C4H9O2+
C4H6O C4H8O2
A aldol
93.5 C2H3O3+
·H2O C2H2O3 Glyoxylic Acid
95.5 C2H5O3+
·H2O C2H4O3 Glycolic Acid
98.4 C2H7O2+
·2H2O C2H6O2 Hydrated A
107.2 C3H5O3+
·H2O C3H4O3 Pyruvic Acid
C4H9O2+
·H2O C4H8O2 A aldol 126.0 C7H9O2+ C7H8O2 MG + 2 A aldol
134.0 C5H11O4+
·H2O C5H10O4 MG + A aldol
137.3 C5H11O3+
·H2O C5H10O3 Unknown
145.1 C6H9O4 + C6H7O3+
·H2O C6H8O4
C6H6O3 MG aldol
162.9 C6H11O5 + C6H9O4+
·H2O C6H10O5 C6H8O4
MG hemiacetal and aldol
164.7
C6H13O5+ C6H12O5 MG aldol
C6H11O4+
·H2O C6H10O4 MG hemiacetal and aldol 192.9 C12H15O+
·H2O C12H14O 6 A aldol
206.7 C11H11O4+ C11H10O4 A + 3 MG aldol
235 C9H15O7+ C9H14O7 MG hemiacetal
248.9 C15H17O2+
·H2O C15H16O2 1MG + 6 A aldol 289.6 C18H21O+
·2H2O C18H20O 9 A aldol 297 C20H23O+
ACPD
11, 19477–19506, 2011Reactive processing of formaldehyde and
acetaldehyde
Z. Li et al.
Title Page
Abstract Introduction
Conclusions References
Tables Figures
◭ ◮
◭ ◮
Back Close
Full Screen / Esc
Printer-friendly Version Interactive Discussion
Discussion
P
a
per
|
Dis
cussion
P
a
per
|
Discussion
P
a
per
|
Discussio
n
P
a
per
|
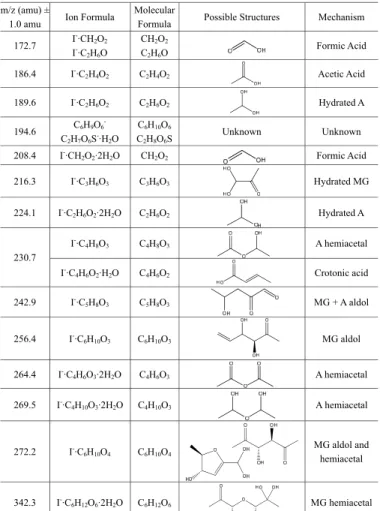
Table 5.Proposed peak assignments 454 for Aerosol-CIMS mass spectra with I− of atomized
solutions of 2 M acetaldehyde/MG (1:1) in 3.1 M AS.
ized solutions of 2 M acetaldehyde/MG (1:1) in 3.1 M AS.
5
m/z (amu) ±
1.0 amu Ion Formula
Molecular
Formula Possible Structures Mechanism
172.7 I
-·CH2O2 I-·C2H6O
CH2O2 C2H6O
Formic Acid
186.4 I
-·C2H4O2 C2H4O2 Acetic Acid
189.6 I
-·C2H6O2 C2H6O2 Hydrated A
194.6 C6H9O6 -
C2H7O6S-·H2O
C6H10O6 C2H8O6S
Unknown Unknown
208.4 I
-·CH2O2·2H2O CH2O2 Formic Acid
216.3 I
-·C3H6O3 C3H6O3 Hydrated MG
224.1 I
-·C2H6O2·2H2O C2H6O2 Hydrated A
230.7 I
-·C4H8O3 C4H8O3 A hemiacetal
I-·C4H6O2·H2O C4H6O2 Crotonic acid
242.9 I
-·C5H8O3 C5H8O3 MG + A aldol
256.4 I
-·C6H10O3 C6H10O3 MG aldol
264.4 I
-·C4H6O3·2H2O C4H6O3 A hemiacetal
269.5 I
-·C4H10O3·2H2O C4H10O3 A hemiacetal
272.2 I
-·C6H10O4 C6H10O4
MG aldol and hemiacetal
342.3 I
ACPD
11, 19477–19506, 2011Reactive processing of formaldehyde and
acetaldehyde
Z. Li et al.
Title Page
Abstract Introduction
Conclusions References
Tables Figures
◭ ◮
◭ ◮
Back Close
Full Screen / Esc
Printer-friendly Version Interactive Discussion
Discussion
P
a
per
|
Dis
cussion
P
a
per
|
Discussion
P
a
per
|
Discussio
n
P
a
per
|
● ■
80
75
70
65
60
Su
rfac
e Te
ns
io
n
(dy
n
c
m
-1 )
0.20 0.15 0.10 0.05 0.00
CFormaldehyde (mol C/kg H2O)
B
80
75
70
65
60
Surfac
e
Tension
(dyn cm
-1 )
1.0 0.8 0.6 0.4 0.2 0.0
CAcetaldehyde(mol C/kg H2O)
A
Fig. 1.Surface tension of solutions containing(A)acetaldehyde and(B)formaldehyde in 3.1 M AS (
AS (
●
) and in water () a
■
●
ter (
■
). The curves shown are fits to the data using the Szyszkowski-Langmuir).
ACPD
11, 19477–19506, 2011Reactive processing of formaldehyde and
acetaldehyde
Z. Li et al.
Title Page
Abstract Introduction
Conclusions References
Tables Figures
◭ ◮
◭ ◮
Back Close
Full Screen / Esc
Printer-friendly Version Interactive Discussion
Discussion
P
a
per
|
Dis
cussion
P
a
per
|
Discussion
P
a
per
|
Discussio
n
P
a
per
|
76 72 68 64 60
S
u
rf
ac
e Ten
s
ion
(d
yn
cm
-1)
6x10⁻² 4 2 0
CAcetaldehyde (mol C/kg H2O) 0.14 0.12 0.10 0.08 0.06 0.04 CMethylglyoxal (mol C/kg H2O)
A
70 65 60 55 50
Su
rfa
c
e Tens
ion (dy
n
c
m
-1)
0.8 0.6 0.4 0.2 0.0
CAcetaldehyde (mol C/kg H2O) 1.4 1.2 1.0 0.8 0.6 0.4 CMethylglyoxal (mol C/kg H2O)
B
65 60 55 50
Su
rfa
c
e Te
ns
ion (dy
n
c
m
-1)
1.4 1.2 1.0 0.8 0.6 0.4 CMethylglyoxal (mol C/kg H2O)
0.3 0.2 0.1 0.0
CFormaldehyde (mol C/kg H2O)
C
Fig. 2.Surface tension of binary mixtures of acetaldehyde or formaldehyde with MG in 3.1 M AS
solutions. The total organic concentration was 0.05 M(A)or 0.5 M(B, C). The black line shows
Henning model predictions (Eq. 3) using the parameters listed in Table 1. The grey lines show
the confidence interval of the model predictions.
●
ter (
■
: MG in AS (based on the Szyszkowski-).
Langmuir equation (Eq. 2), using the parameters in Table 1).
AS (
●
: Acetaldehyde () a
AandB) or■
ACPD
11, 19477–19506, 2011Reactive processing of formaldehyde and
acetaldehyde
Z. Li et al.
Title Page
Abstract Introduction
Conclusions References
Tables Figures
◭ ◮
◭ ◮
Back Close
Full Screen / Esc
Printer-friendly Version Interactive Discussion
Discussion
P
a
per
|
Dis
cussion
P
a
per
|
Discussion
P
a
per
|
Discussio
n
P
a
per
|
▲ ●
▲ ●
■
58
56
54
52
50
48
Surface
Tension (dyn
cm
-1 )
1.0 0.8 0.6 0.4
CMethylglyoxal (mol C/kg H2O)
A
70
68
66
64
62
60
58
Surfa
c
e Ten
s
ion
(dyn
c
m
-1 )
0.12 0.10 0.08 0.06 0.04
CMethylglyoxal (mol C/kg H2O)
B
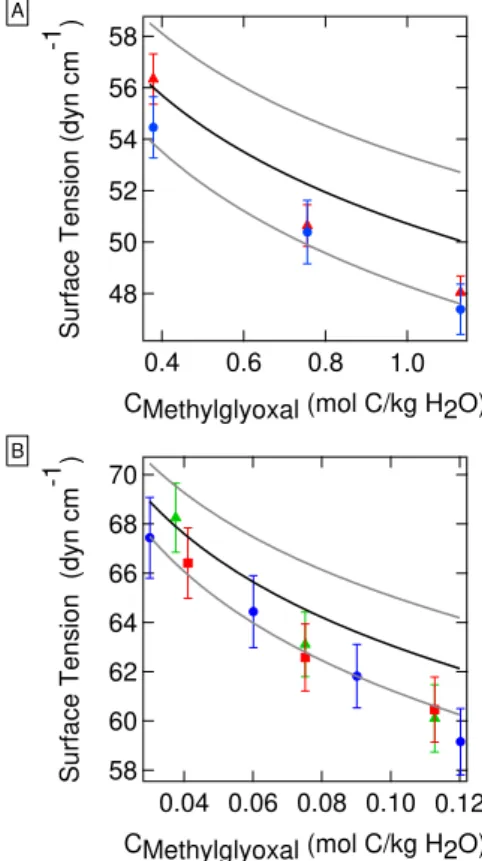
Fig. 3. Surface tension in binary and ternary organic mixtures (Figs. 2 and 3) as a
function of MG concentration. (A) Binary mixtures (0.5 M total organic concentration)8
▲
: ac
●
▲
●
■
:
acetaldehyde-MG,
AS (
●
: formaldehyde-MG) a
(B)0.05 M total organic concentration.■
▲
●
▲
: t
●
9
■
: ternary
mixture (acetaldehyde:formaldehyde=1:1 by mole, varying MG);
AS (
●
: ternary mixture (acetalde-) a
■
hyde:formaldehyde=
●
1:3 by mole, varying MG);ter (
■
: binary mixture (acetaldehyde-MG). Black).
ACPD
11, 19477–19506, 2011Reactive processing of formaldehyde and
acetaldehyde
Z. Li et al.
Title Page Abstract Introduction Conclusions References Tables Figures ◭ ◮ ◭ ◮ Back Close
Full Screen / Esc
Printer-friendly Version Interactive Discussion Discussion P a per | Dis cussion P a per | Discussion P a per | Discussio n P a per | 5 74 72 70 68 66 64 62 60 Surf ac e Tens io
n (
d y n c m -1 )
0.10 0.08 0.06 0.04
CMethylglyoxal (mol C/kg H2O)
1.6x10⁻² 1.2
0.8
CFormaldehyde (mol C/kg H2O) D 75 70 65 60 Surf ac e Tens ion (dy n c m -1 ) 2.0x10⁻² 1.6 1.2 0.8
CAcetaldehyde (mol C/kg H2O)
0.12 0.10 0.08 0.06 0.04
CMethylglyoxal (mol C/kg H2O) A 75 70 65 60 Surf ac e Tens ion (dy n c m -1 ) 3.0x10⁻² 2.5 2.0 1.5 1.0
CFormaldehyde (mol C/kg H2O)
0.12 0.10 0.08 0.06 0.04
CMethylglyoxal (mol C/kg H2O) B 74 72 70 68 66 64 62 60 Sur fac e Ten s ion (dy n c m -1 ) 3.5x10⁻² 3.0 2.5 2.0 1.5
CAcetaldehyde (mol C/kg H2O)
0.10 0.08 0.06 0.04
CMethylglyoxal (mol C/kg H2O) C
Fig. 4. Surface tension data for ternary (acetaldehyde, formaldehyde and MG) mixtures in
3.1 M AS solutions. The molar ratios of acetaldehyde to formaldehyde are 1:3 (AandB) and
1:1 (Cand D). The total organic concentration was constant at 0.05 M. The black line shows
ACPD
11, 19477–19506, 2011Reactive processing of formaldehyde and
acetaldehyde
Z. Li et al.
Title Page
Abstract Introduction
Conclusions References
Tables Figures
◭ ◮
◭ ◮
Back Close
Full Screen / Esc
Printer-friendly Version Interactive Discussion
Discussion
P
a
per
|
Dis
cussion
P
a
per
|
Discussion
P
a
per
|
Discussio
n
P
a
per
|
5
0.6x10⁴
0.4
0.2
0.0
No
rm
alized
Sig
nal (arb
.)
350 300
250 200
150 100
m/z (amu)
6x10⁴ 2
F in AS F in H2O
I- I
-·H2O
81.7 95.6
176.7 193.8
208.7
223.3 273.8 291.1304.7 323.5 110.4
Fig. 5. Aerosol-CIMS spectra of atomized solutions of 0.2 M formaldehyde in 3.1 M AS and
H2O. See the text for details of sample preparation and analysis. Negative-ion mass spectrum
ACPD
11, 19477–19506, 2011Reactive processing of formaldehyde and
acetaldehyde
Z. Li et al.
Title Page
Abstract Introduction
Conclusions References
Tables Figures
◭ ◮
◭ ◮
Back Close
Full Screen / Esc
Printer-friendly Version Interactive Discussion
Discussion
P
a
per
|
Dis
cussion
P
a
per
|
Discussion
P
a
per
|
Discussio
n
P
a
per
|
0.2x10⁴
0.1
0.0
No
rmali
z
ed Sig
nal (arb.
)
350 300
250 200
150 100
m/z (amu)
3x10⁴
1
I -I-·H2O
172.8
186.7
203.5
208.7 216.5
230.3 252.4257.4
264.5 272.2
288.1 314.3 324.5
342.6
Fig. 6. Aerosol-CIMS spectra of atomized solutions of 2 M formaldehyde/MG (1:1) in 3.1 M
AS. See the text for details of sample preparation and analysis. Negative-ion mass spectrum
obtained using I−
ACPD
11, 19477–19506, 2011Reactive processing of formaldehyde and
acetaldehyde
Z. Li et al.
Title Page
Abstract Introduction
Conclusions References
Tables Figures
◭ ◮
◭ ◮
Back Close
Full Screen / Esc
Printer-friendly Version Interactive Discussion
Discussion
P
a
per
|
Dis
cussion
P
a
per
|
Discussion
P
a
per
|
Discussio
n
P
a
per
|
5
25x103
20
15
10
5
0
Normalize
d
Si
gnal (arb.
)
300 250
200 150
100 50
m/z (amu)
80x103
40
84.4 88.9
95.5
107.2
126.0 137.3
145.1 164.7
192.9 206.7
235 248.9 289.6
297 H3O
+
·(H2O)2
Fig. 7. Aerosol-CIMS spectra of atomized solutions of 0.5 M acetaldehyde/MG (1:1) in 3.1 M
AS. See the text for details of sample preparation and analysis. Positive-ion mass spectrum
ACPD
11, 19477–19506, 2011Reactive processing of formaldehyde and
acetaldehyde
Z. Li et al.
Title Page
Abstract Introduction
Conclusions References
Tables Figures
◭ ◮
◭ ◮
Back Close
Full Screen / Esc
Printer-friendly Version Interactive Discussion
Discussion
P
a
per
|
Dis
cussion
P
a
per
|
Discussion
P
a
per
|
Discussio
n
P
a
per
|
0.2x10⁴
0.1
0.0
N
o
rmaliz
ed
S
ignal
(
a
rb.
)
350 300
250 200
150 100
m/z (amu) 3x10⁴
1 172.7
186.4 189.6
208.4 216.3
224.1
230.7 242.9
256.4 264.4
272.2
342.3 I
-I-·H2O
Fig. 8.Aerosol-CIMS spectra of atomized solutions of 2 M acetaldehyde/MG (1:1) in 3.1 M AS. See the text for details of sample preparation and analysis. Negative-ion mass spectrum was
obtained using I−